| Param | Original file | Final file |
|---|---|---|
| Filename | modeM0/AS1G08_028T01_9000002220_15098cztM0_level2.evt | modeM0/AS1G08_028T01_9000002220_15098cztM0_level2_quad_clean.evt |
| Size (bytes) | 450,959,040 | 83,894,400 |
| Size | 430.1 MB | 80.0 MB |
| Events in quadrant A | 3,070,681 | 535,902 |
| Events in quadrant B | 3,709,580 | 541,927 |
| Events in quadrant C | 3,521,339 | 523,690 |
| Events in quadrant D | 2,930,619 | 502,311 |
| Mode M0 | |||
|---|---|---|---|
| Quadrant | BADHDUFLAG | Total packets | Discarded packets |
| A | 0 | 12966 | 2 |
| B | 0 | 14835 | 1 |
| C | 0 | 14053 | 1 |
| D | 0 | 12994 | 1 |
| Mode SS | |||
|---|---|---|---|
| Quadrant | BADHDUFLAG | Total packets | Discarded packets |
| A | 0 | 126 | 0 |
| B | 0 | 126 | 0 |
| C | 0 | 126 | 0 |
| D | 0 | 126 | 0 |
| Mode M9 | |||
|---|---|---|---|
| Quadrant | BADHDUFLAG | Total packets | Discarded packets |
| A | 0 | 15 | 0 |
| B | 0 | 15 | 0 |
| C | 0 | 15 | 0 |
| D | 0 | 16 | 0 |
| Quadrant | Total seconds | Saturated seconds | Saturation percentage |
|---|---|---|---|
| A | 6261 | 19 | 0.303466% |
| B | 6261 | 150 | 2.395783% |
| C | 6261 | 17 | 0.271522% |
| D | 6261 | 15 | 0.239578% |
Noise dominated data is calculated using 1-second bins in cleaned event files. If a bin has >2000 counts, and if more than 50% of those come from <1% of pixels, then it is considered to be noise-dominated and hence unusable.
| Quadrant | # 1 sec bins | Bins with >0 counts | Bins with >2000 counts | High rate bins dominated by noise | Noise dominated (total time) | Noise dominated (detector-on time) | Marked lightcurve |
|---|---|---|---|---|---|---|---|
| A | 7467 | 6263 | 0 | 0 | 0.00% | 0.00% | 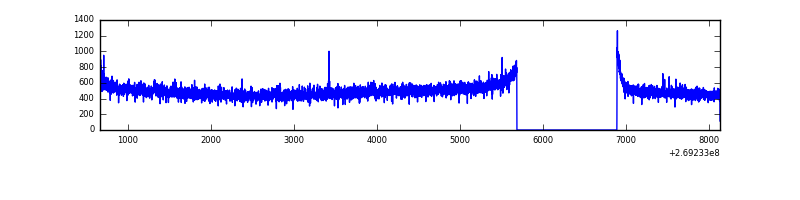 |
| B | 7467 | 6263 | 36 | 36 | 0.48% | 0.57% | 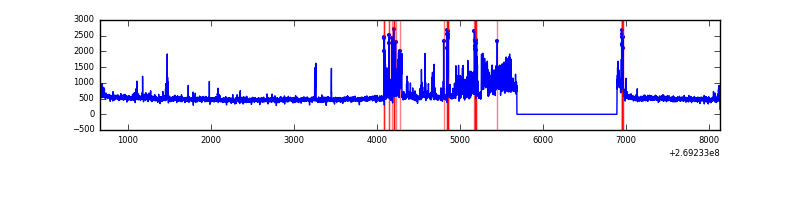 |
| C | 7467 | 6263 | 0 | 0 | 0.00% | 0.00% | 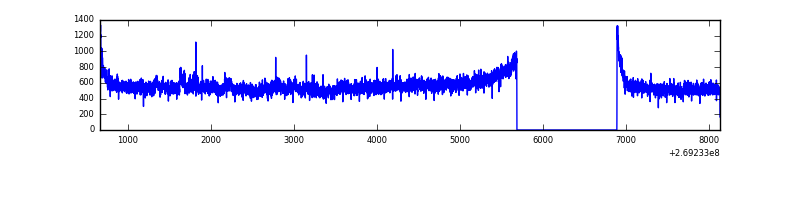 |
| D | 7467 | 6263 | 5 | 5 | 0.07% | 0.08% | 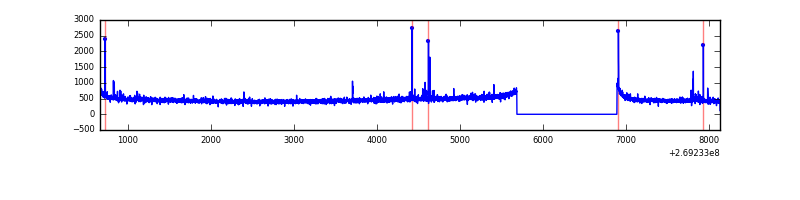 |
Top three noisy pixels from each quadrant. If the there are fewer than three noisy pixels in the level2.evt file, extra rows are filled as -1
| Pixel properties | Quadrant properties | ||||||
|---|---|---|---|---|---|---|---|
| Quadrant | DetID | PixID | Counts | Sigma | Mean | Median | Sigma |
| A | 12 | 189 | 16287 | 96.61 | 795 | 780 | 160.5 |
| A | 0 | 226 | 6996 | 38.72 | 795 | 780 | 160.5 |
| A | 12 | 194 | 5753 | 30.98 | 795 | 780 | 160.5 |
| B | 10 | 245 | 484551 | 3236.23 | 789 | 772 | 149.5 |
| B | 3 | 64 | 135161 | 898.99 | 789 | 772 | 149.5 |
| B | 12 | 111 | 18412 | 118.0 | 789 | 772 | 149.5 |
| C | 3 | 233 | 527620 | 2988.81 | 762 | 770 | 176.3 |
| C | 3 | 9 | 17792 | 96.57 | 762 | 770 | 176.3 |
| C | 13 | 61 | 5488 | 26.77 | 762 | 770 | 176.3 |
| D | 13 | 104 | 56657 | 303.66 | 760 | 738 | 184.1 |
| D | 2 | 234 | 23100 | 121.43 | 760 | 738 | 184.1 |
| D | 14 | 226 | 7400 | 36.18 | 760 | 738 | 184.1 |
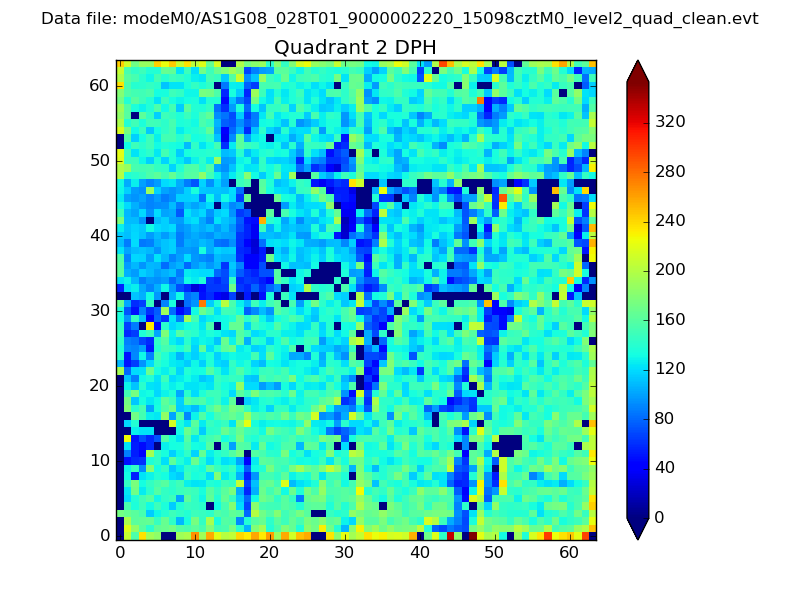
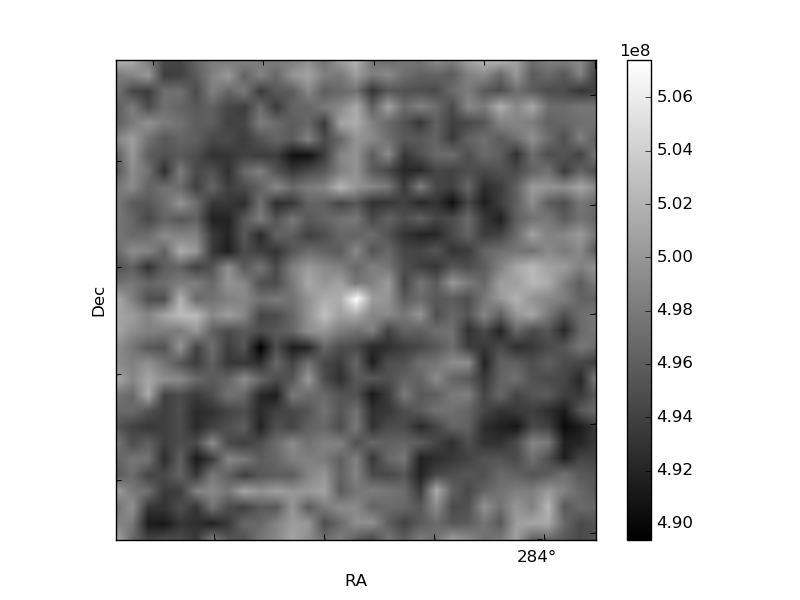
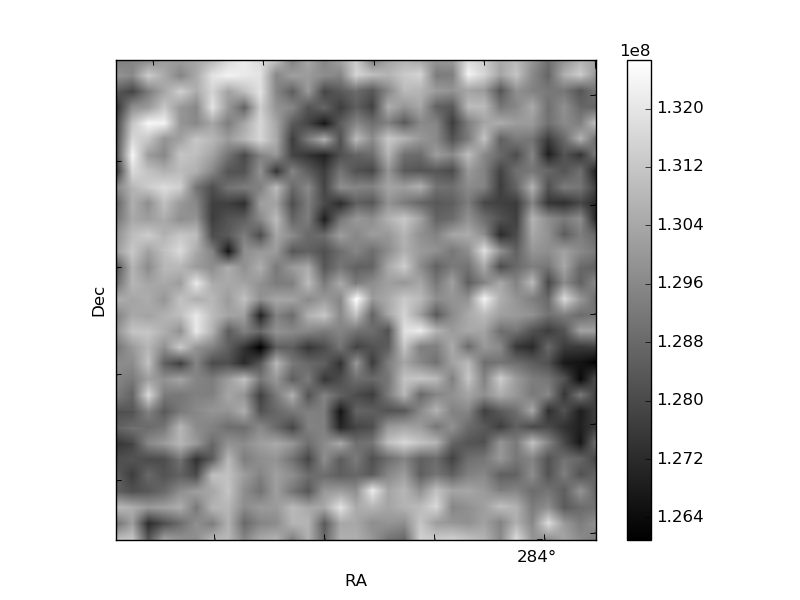
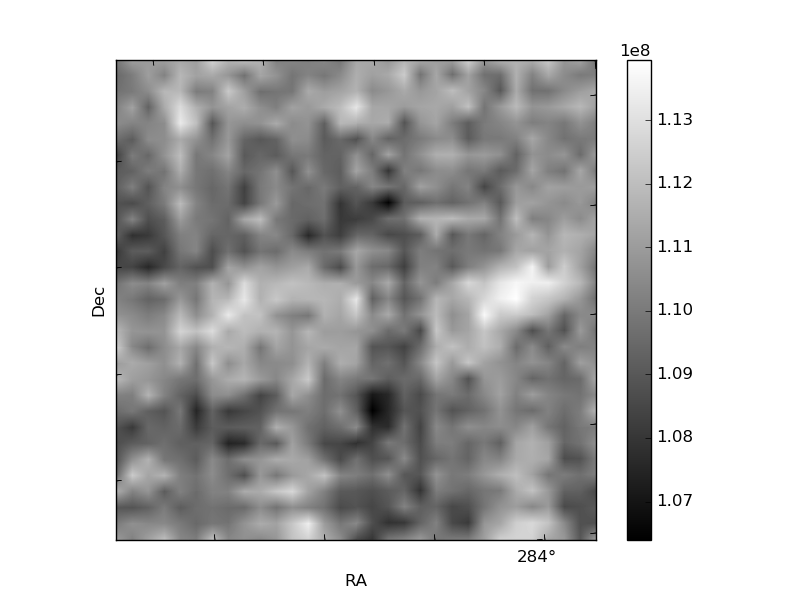
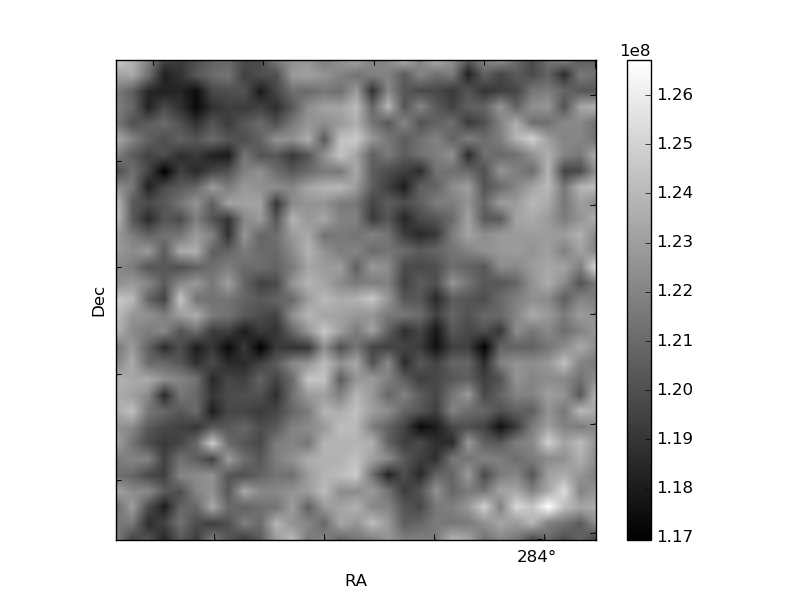
Histogram calculated using DETX and DETY for each event in the final _common_clean file
| Quadrant A | 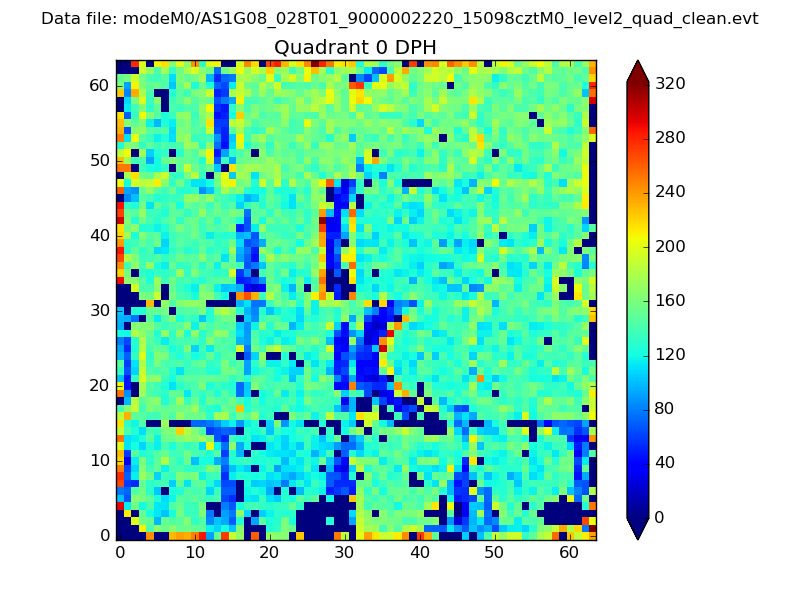 |
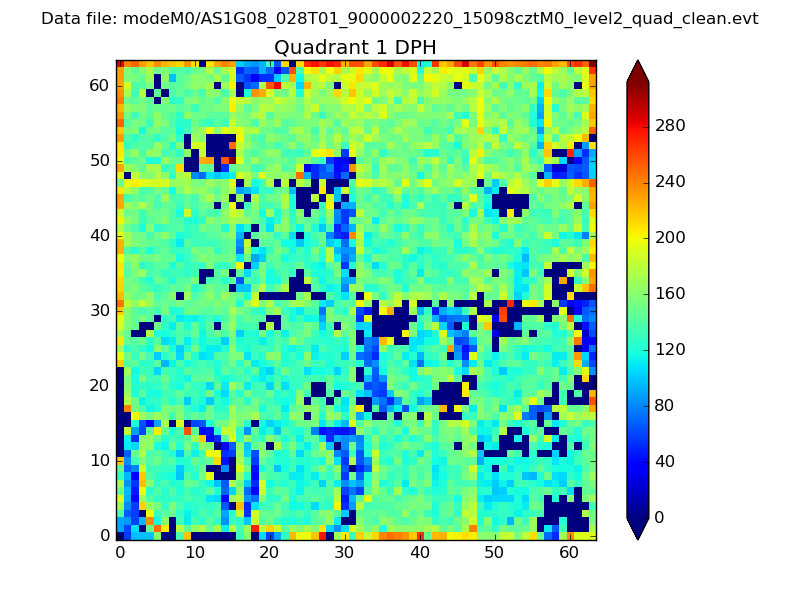 |
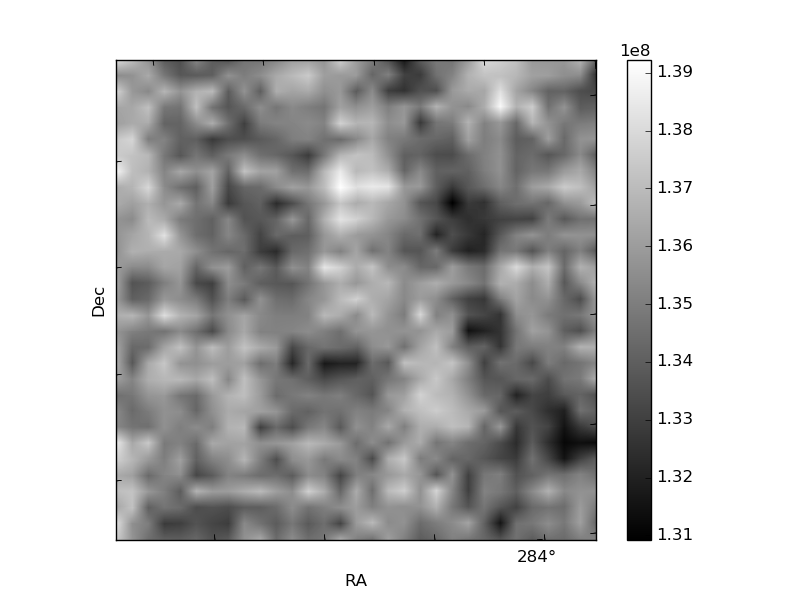
Quadrant B |
|---|---|---|---|
| Quadrant D | 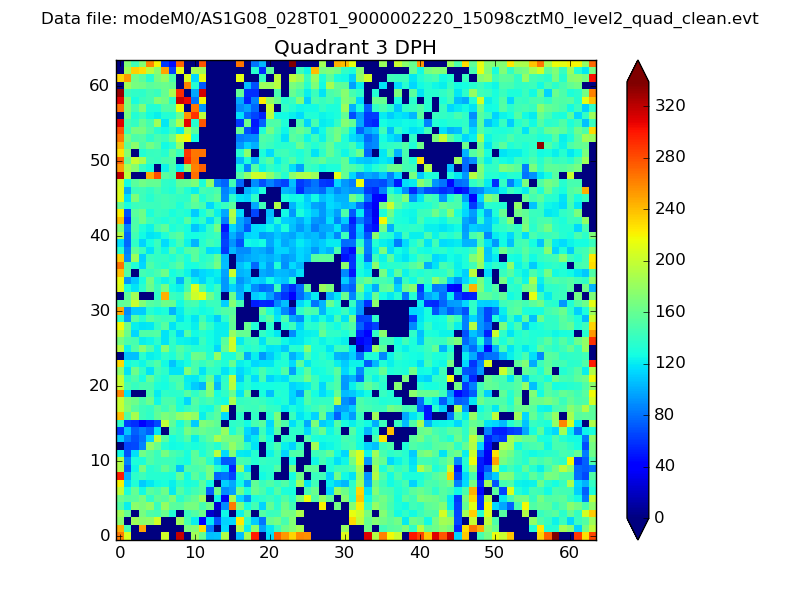 |
 |
Quadrant C |
| Plot type | Count rate plots | Images |
|---|---|---|
| Comparison with Poisson distribution Blue bars denote a histogram of data divided into 1 sec bins. Red curve is a Poisson curve with rate = median count rate of data. |
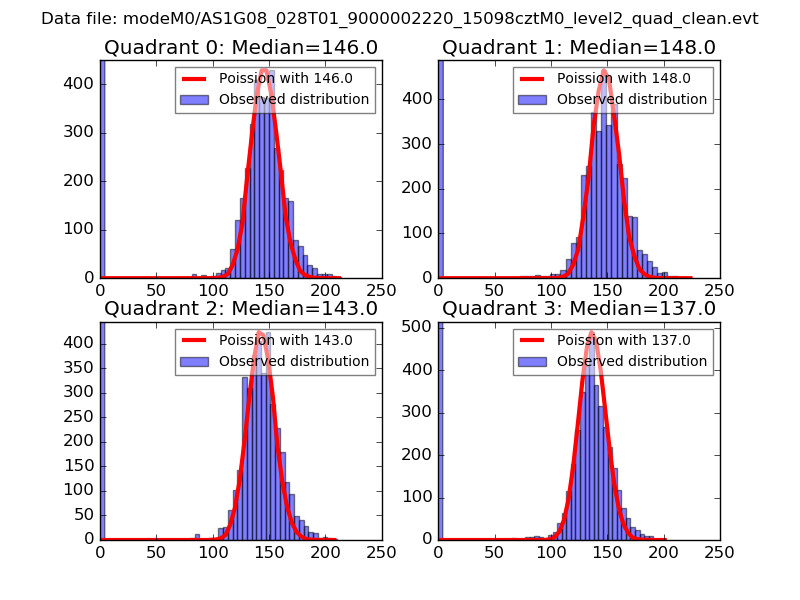 |
 |
| Quadrant-wise count rates Data is divided into 100 sec bins |
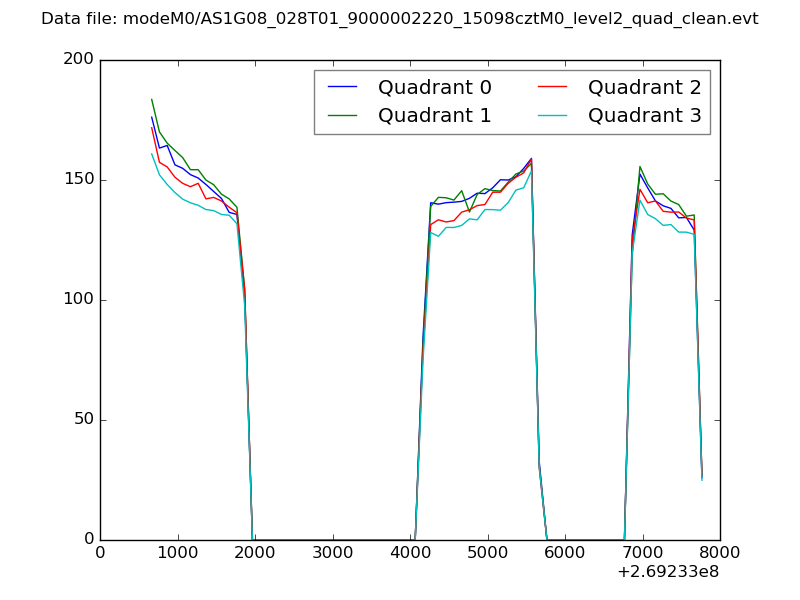 |
|
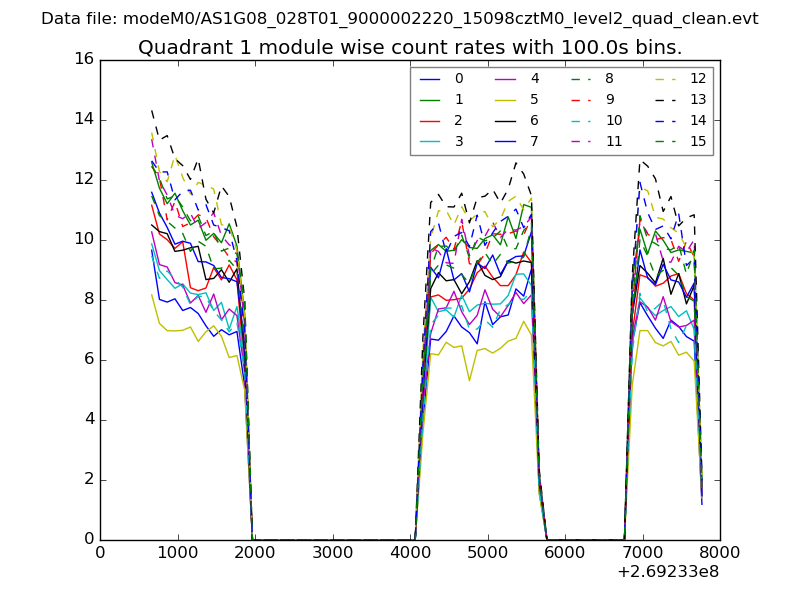
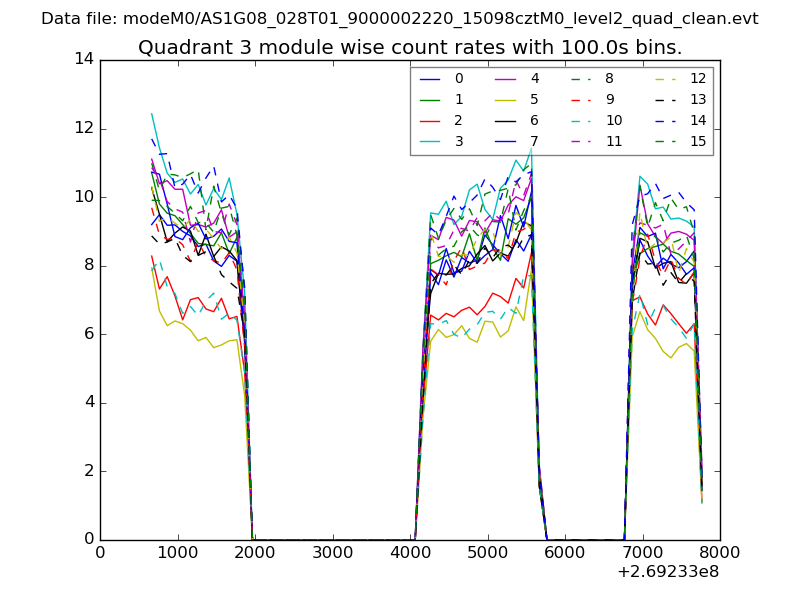
| Module-wise count rates for Quadrant A Data is divided into 100 sec bins |
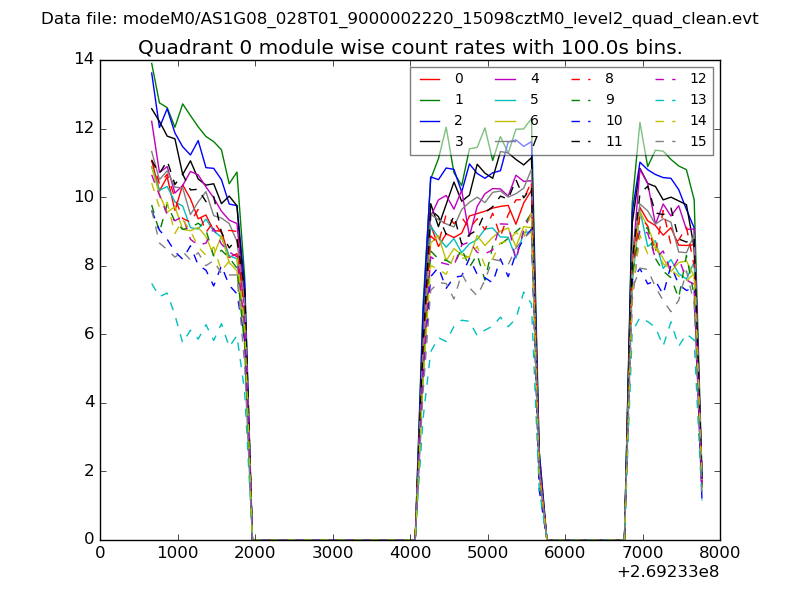 |
 |
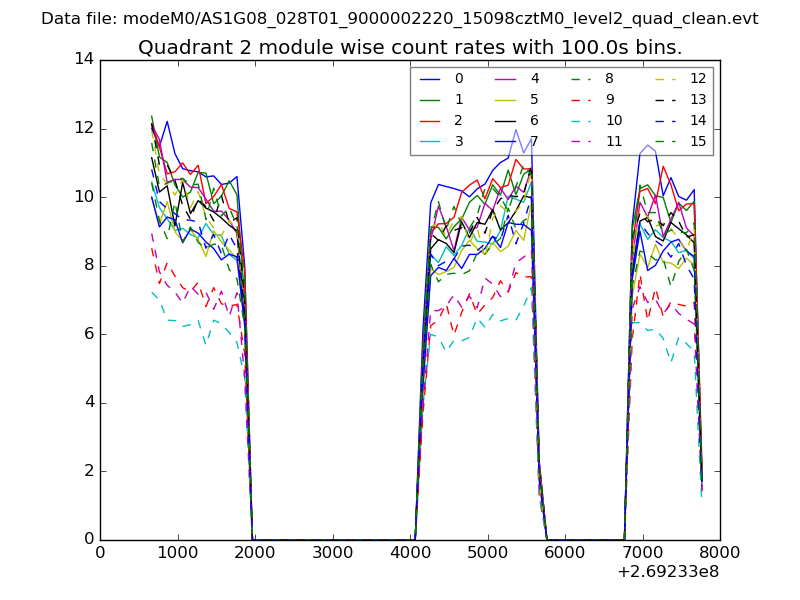
| Module-wise count rates for Quadrant B Data is divided into 100 sec bins |
 |
 |
| Module-wise count rates for Quadrant C Data is divided into 100 sec bins |
 |
 |
| Module-wise count rates for Quadrant D Data is divided into 100 sec bins |
 |
 |
| Parameter | Plot |
|---|---|
| CZT HV Monitor | 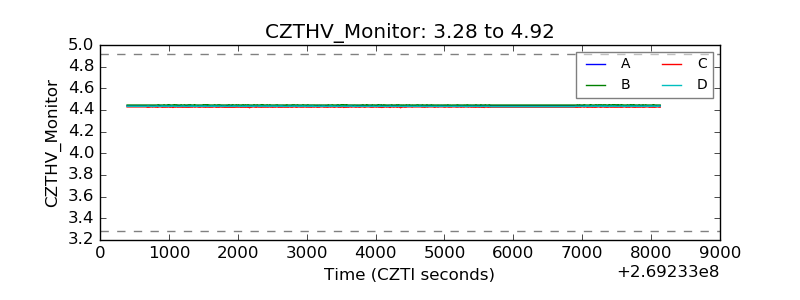 |
| D_VDD |  |
| Temperature 1 | 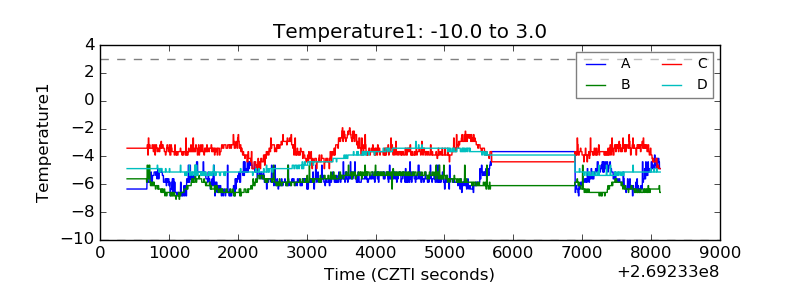 |
| Veto HV Monitor | 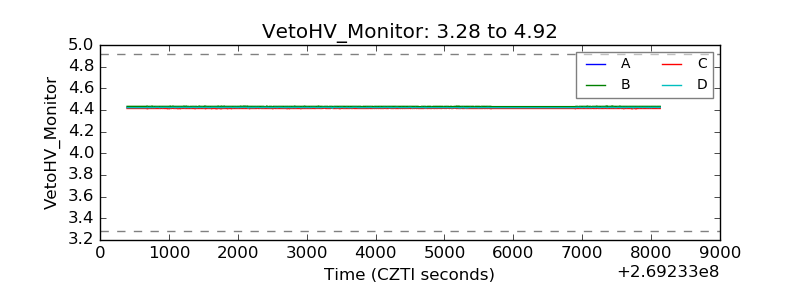 |
| Veto LLD | 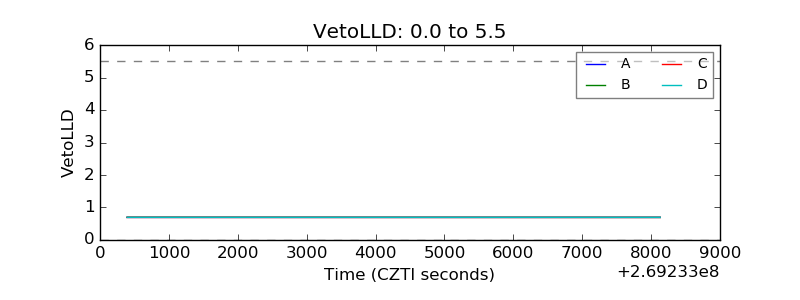 |
| Alpha Counter | 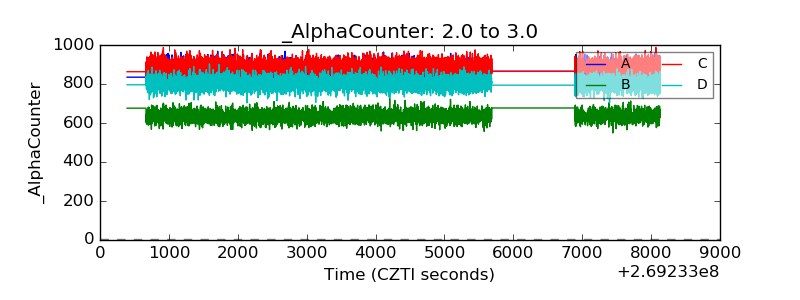 |
| _CPM_Rate | 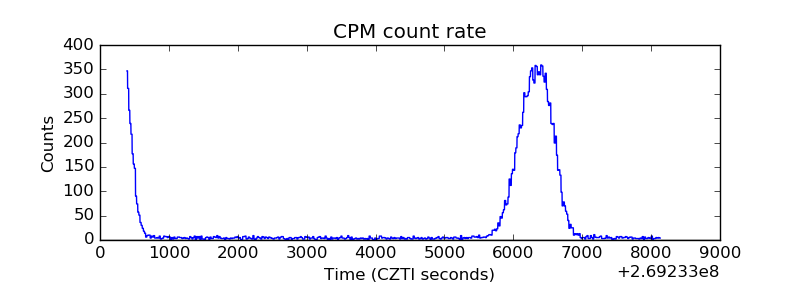 |
| CZT Counter | 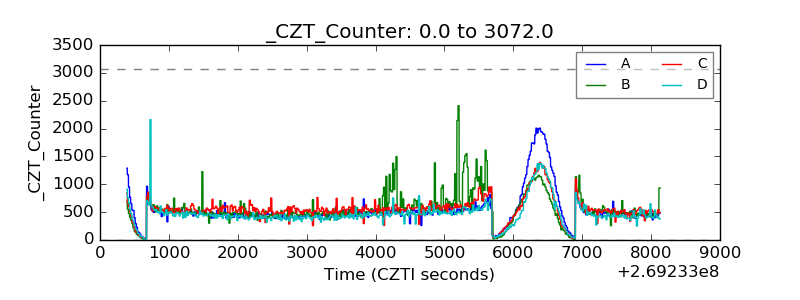 |
| +2.5 Volts monitor |  |
| +5 Volts monitor |  |
| _ROLL_ROT | 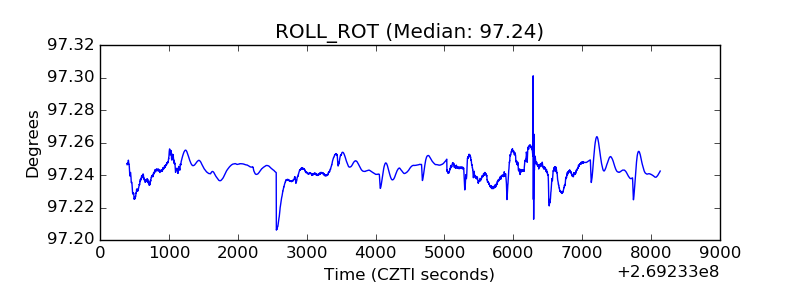 |
| _Roll_DEC | 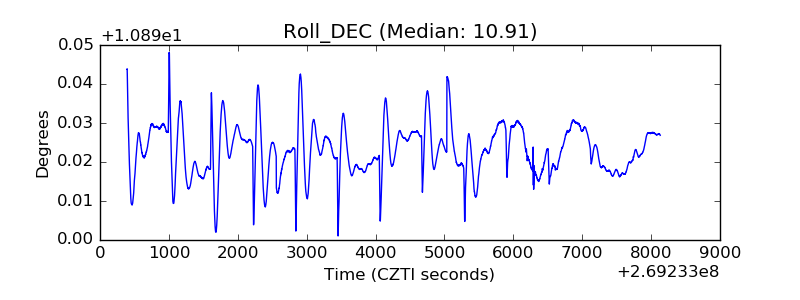 |
| _Roll_RA | 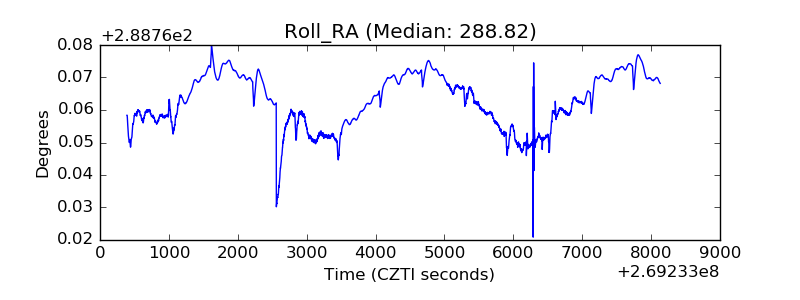 |
| Veto Counter | 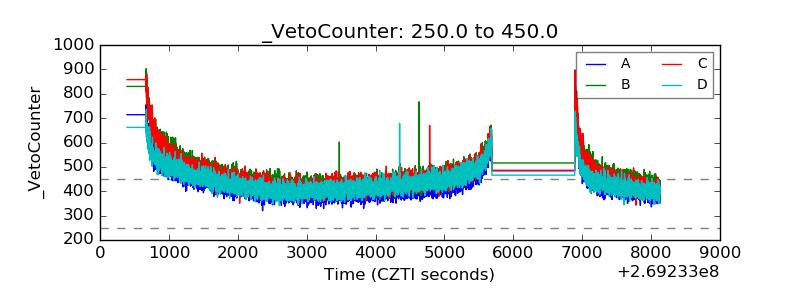 |