| Param | Original file | Final file |
|---|---|---|
| Filename | modeM0/AS1G08_028T01_9000002220_15102cztM0_level2.evt | modeM0/AS1G08_028T01_9000002220_15102cztM0_level2_quad_clean.evt |
| Size (bytes) | 663,048,000 | 82,059,840 |
| Size | 632.3 MB | 78.3 MB |
| Events in quadrant A | 3,928,667 | 492,814 |
| Events in quadrant B | 7,167,857 | 494,129 |
| Events in quadrant C | 4,599,749 | 472,731 |
| Events in quadrant D | 3,839,180 | 466,702 |
| Mode M0 | |||
|---|---|---|---|
| Quadrant | BADHDUFLAG | Total packets | Discarded packets |
| A | 0 | 16942 | 3 |
| B | 0 | 26813 | 2 |
| C | 0 | 18449 | 2 |
| D | 0 | 17156 | 2 |
| Mode SS | |||
|---|---|---|---|
| Quadrant | BADHDUFLAG | Total packets | Discarded packets |
| A | 0 | 164 | 0 |
| B | 0 | 164 | 0 |
| C | 0 | 164 | 0 |
| D | 0 | 164 | 0 |
| Mode M9 | |||
|---|---|---|---|
| Quadrant | BADHDUFLAG | Total packets | Discarded packets |
| A | 0 | 4 | 0 |
| B | 0 | 4 | 0 |
| C | 0 | 4 | 0 |
| D | 0 | 4 | 0 |
| Quadrant | Total seconds | Saturated seconds | Saturation percentage |
|---|---|---|---|
| A | 8038 | 382 | 4.752426% |
| B | 8038 | 1408 | 17.516795% |
| C | 8038 | 420 | 5.225180% |
| D | 8038 | 312 | 3.881563% |
Noise dominated data is calculated using 1-second bins in cleaned event files. If a bin has >2000 counts, and if more than 50% of those come from <1% of pixels, then it is considered to be noise-dominated and hence unusable.
| Quadrant | # 1 sec bins | Bins with >0 counts | Bins with >2000 counts | High rate bins dominated by noise | Noise dominated (total time) | Noise dominated (detector-on time) | Marked lightcurve |
|---|---|---|---|---|---|---|---|
| A | 8379 | 8040 | 0 | 0 | 0.00% | 0.00% | 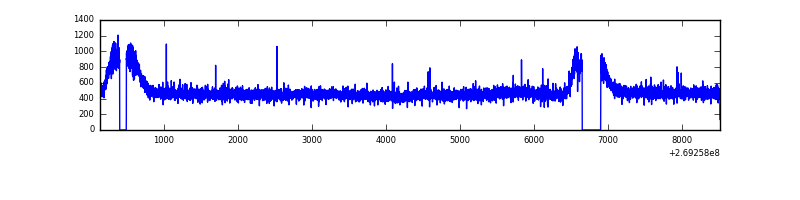 |
| B | 8379 | 8040 | 604 | 604 | 7.21% | 7.51% | 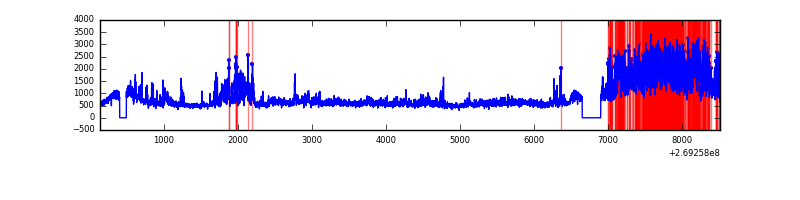 |
| C | 8379 | 8039 | 65 | 65 | 0.78% | 0.81% | 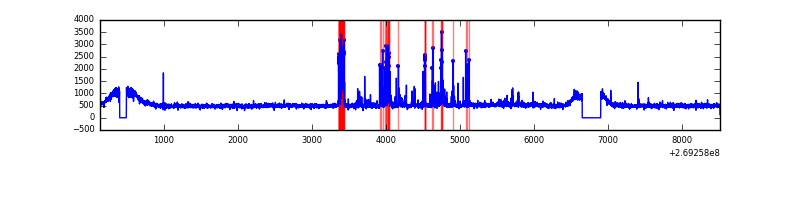 |
| D | 8379 | 8039 | 20 | 20 | 0.24% | 0.25% | 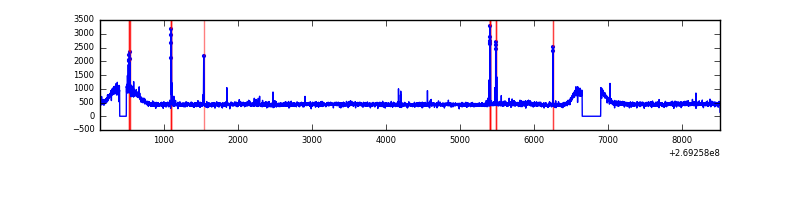 |
Top three noisy pixels from each quadrant. If the there are fewer than three noisy pixels in the level2.evt file, extra rows are filled as -1
| Pixel properties | Quadrant properties | ||||||
|---|---|---|---|---|---|---|---|
| Quadrant | DetID | PixID | Counts | Sigma | Mean | Median | Sigma |
| A | 0 | 226 | 8776 | 37.14 | 1020 | 994 | 209.5 |
| A | 12 | 194 | 7634 | 31.69 | 1020 | 994 | 209.5 |
| A | 3 | 137 | 7575 | 31.41 | 1020 | 994 | 209.5 |
| B | 10 | 245 | 3016575 | 15766.94 | 970 | 943 | 191.3 |
| B | 3 | 64 | 318660 | 1661.15 | 970 | 943 | 191.3 |
| B | 0 | 229 | 37187 | 189.5 | 970 | 943 | 191.3 |
| C | 3 | 233 | 376168 | 1617.48 | 983 | 984 | 232.0 |
| C | 4 | 254 | 375484 | 1614.53 | 983 | 984 | 232.0 |
| C | 3 | 9 | 8693 | 33.23 | 983 | 984 | 232.0 |
| D | 10 | 70 | 59600 | 243.33 | 986 | 955 | 241.0 |
| D | 13 | 104 | 54824 | 223.52 | 986 | 955 | 241.0 |
| D | 2 | 234 | 33024 | 133.06 | 986 | 955 | 241.0 |
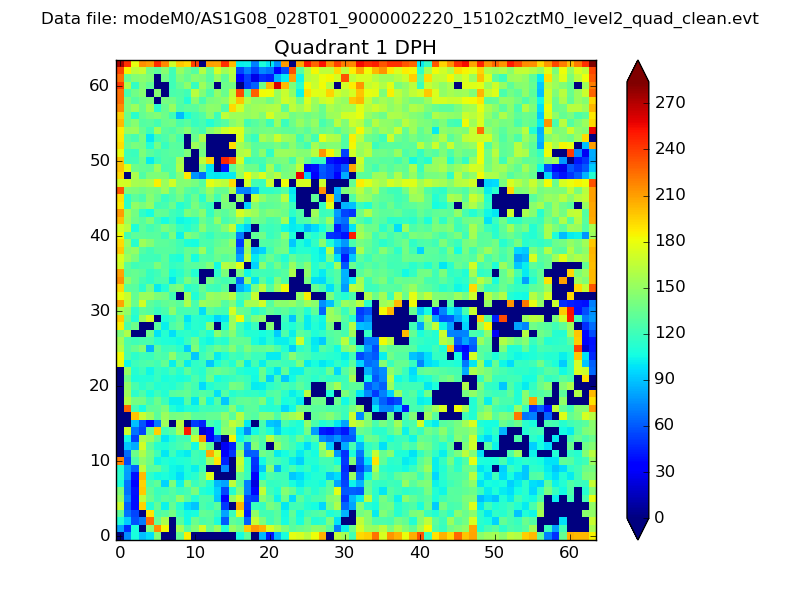
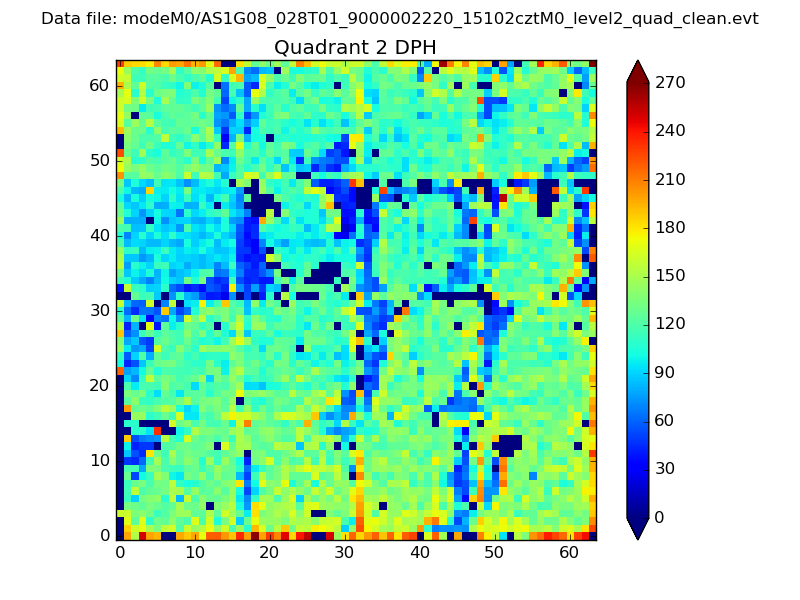
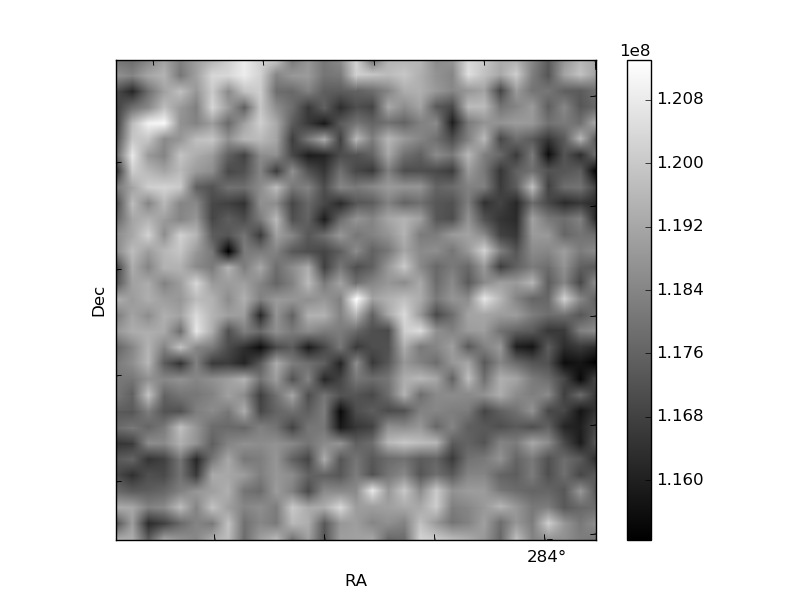
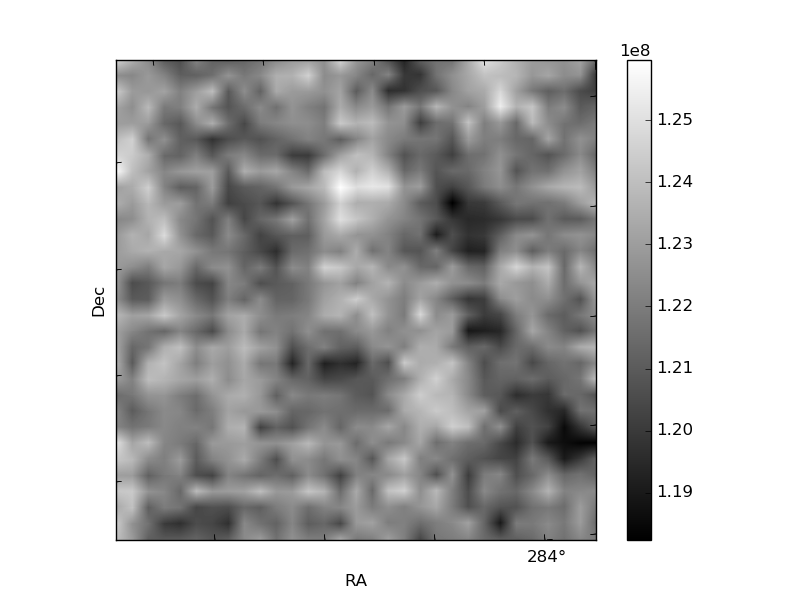
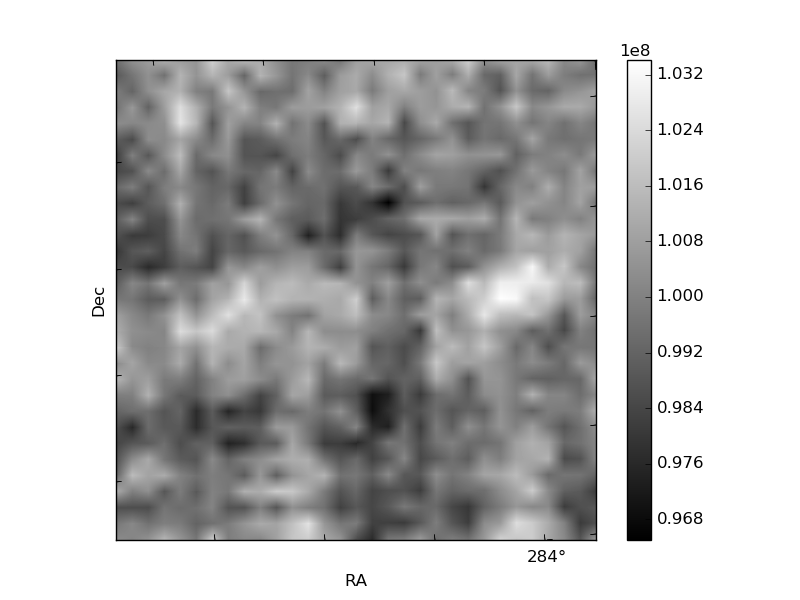
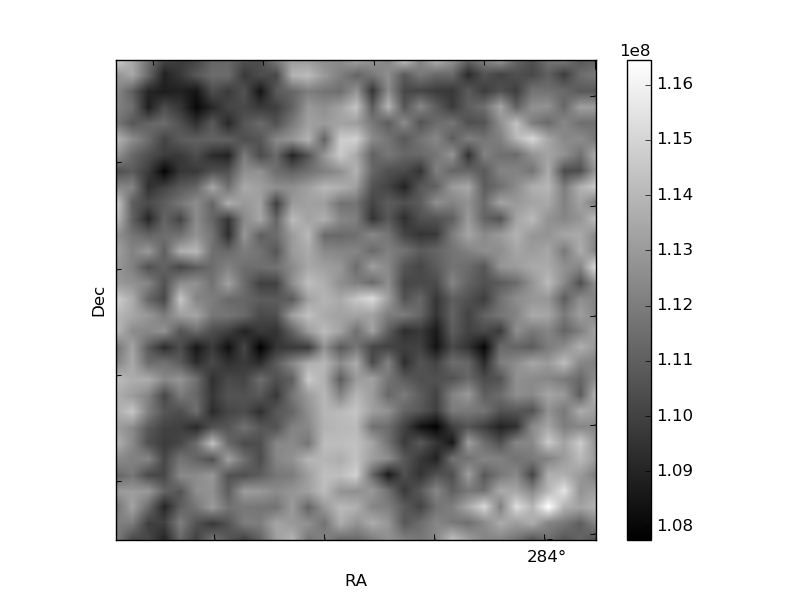
Histogram calculated using DETX and DETY for each event in the final _common_clean file
| Quadrant A |  |
 |
Quadrant B |
|---|---|---|---|
| Quadrant D |  |
 |
Quadrant C |
| Plot type | Count rate plots | Images |
|---|---|---|
| Comparison with Poisson distribution Blue bars denote a histogram of data divided into 1 sec bins. Red curve is a Poisson curve with rate = median count rate of data. |
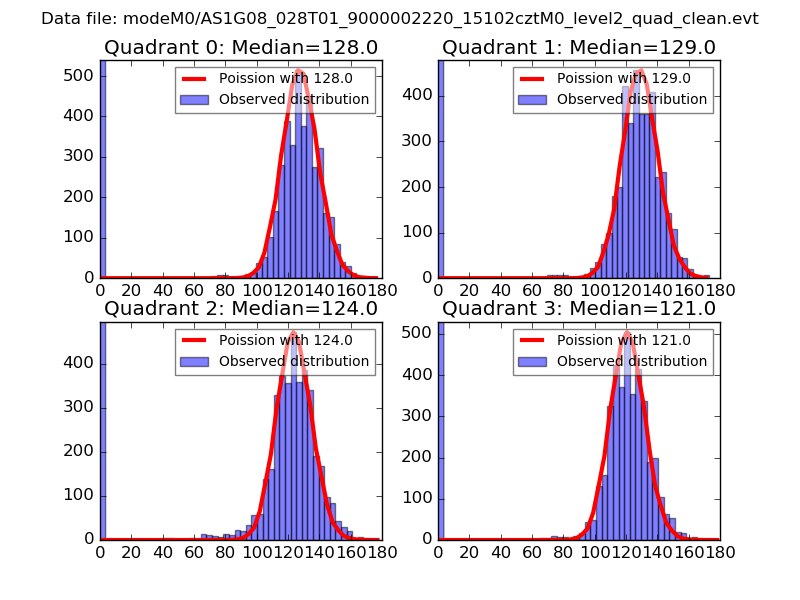 |
 |
| Quadrant-wise count rates Data is divided into 100 sec bins |
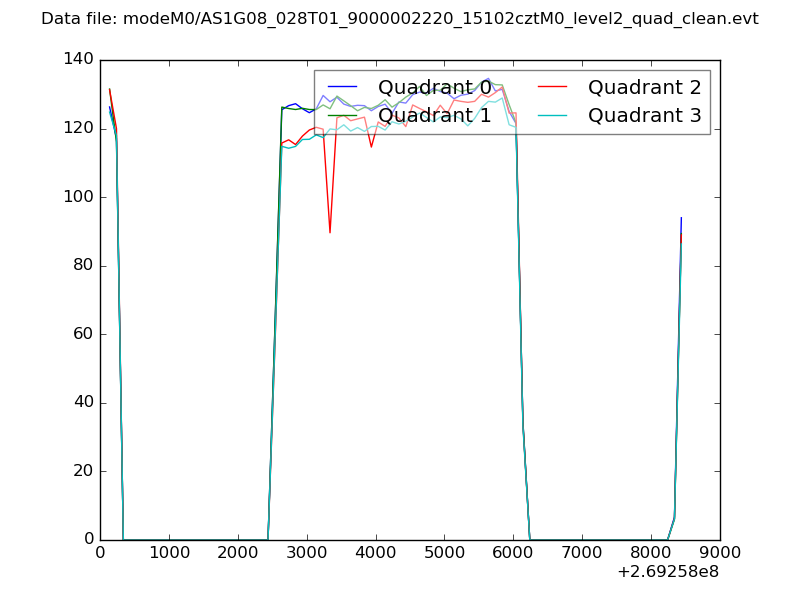 |
|
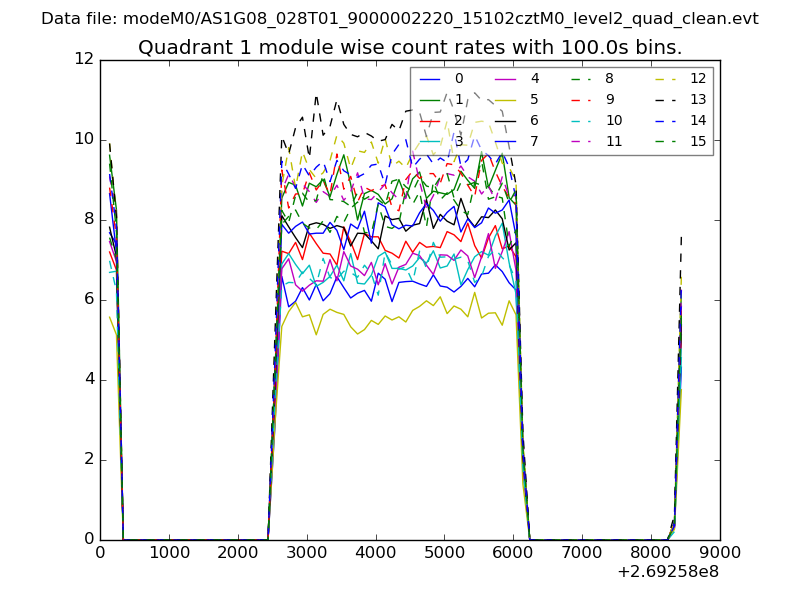
| Module-wise count rates for Quadrant A Data is divided into 100 sec bins |
 |
 |
| Module-wise count rates for Quadrant B Data is divided into 100 sec bins |
 |
 |
| Module-wise count rates for Quadrant C Data is divided into 100 sec bins |
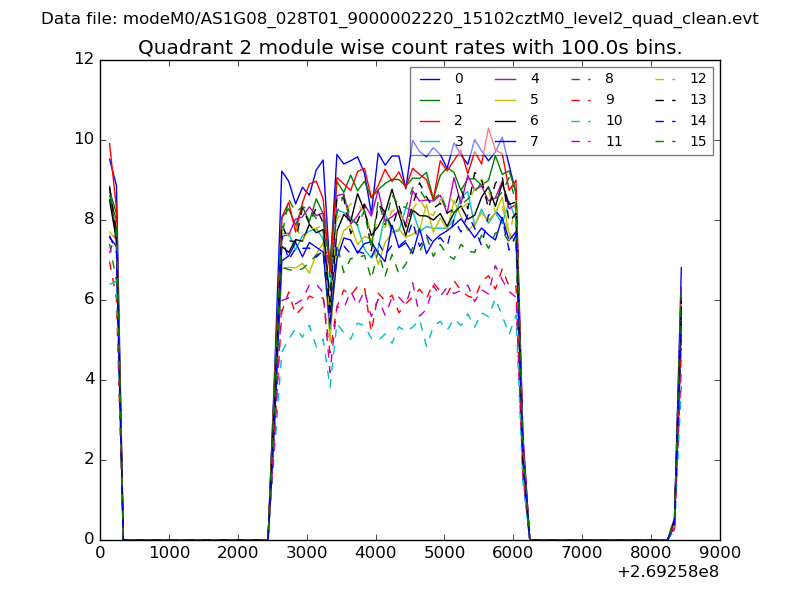 |
 |
| Module-wise count rates for Quadrant D Data is divided into 100 sec bins |
 |
 |
| Parameter | Plot |
|---|---|
| CZT HV Monitor | 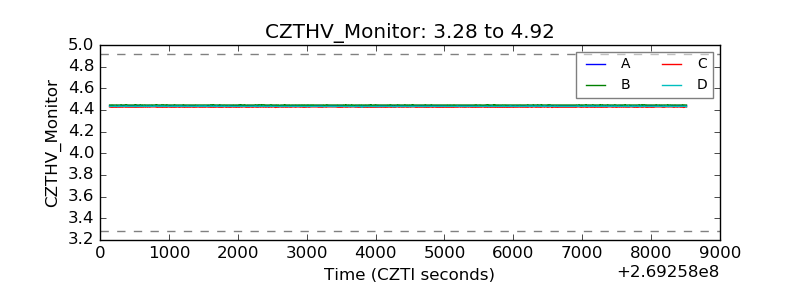 |
| D_VDD | 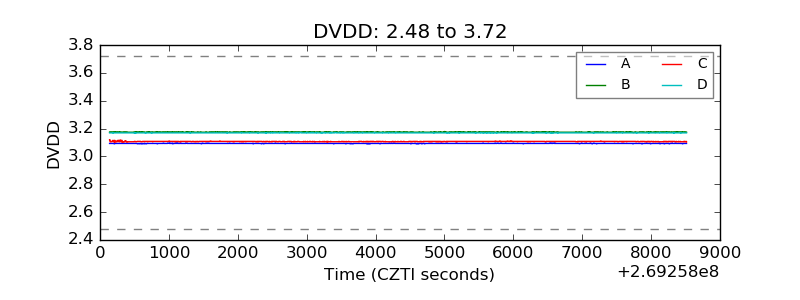 |
| Temperature 1 | 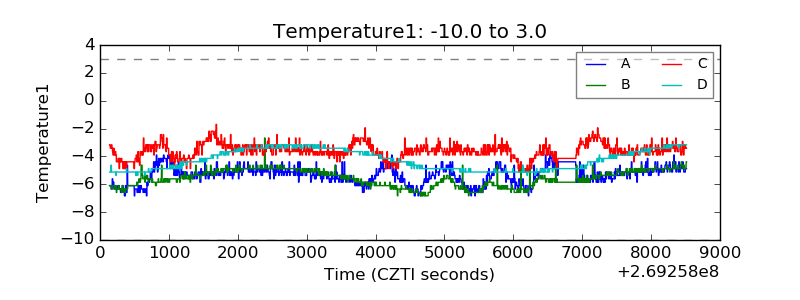 |
| Veto HV Monitor | 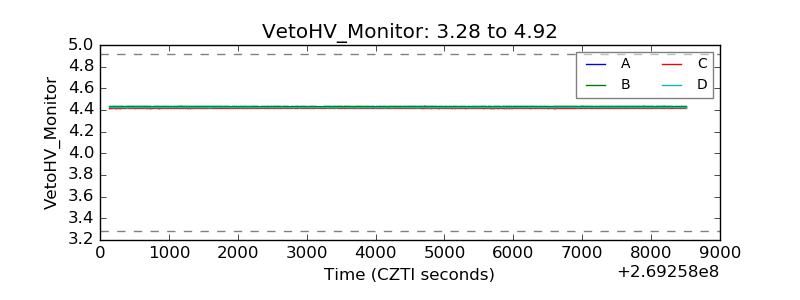 |
| Veto LLD | 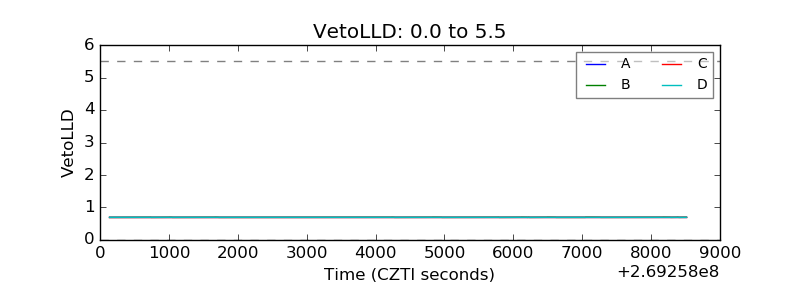 |
| Alpha Counter | 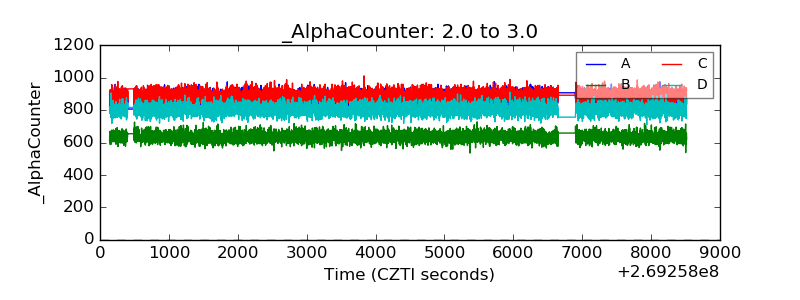 |
| _CPM_Rate | 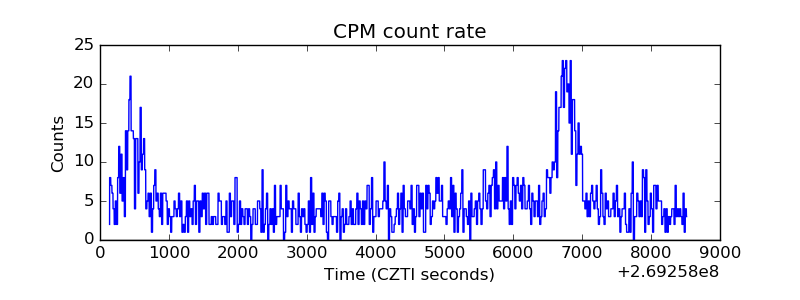 |
| CZT Counter | 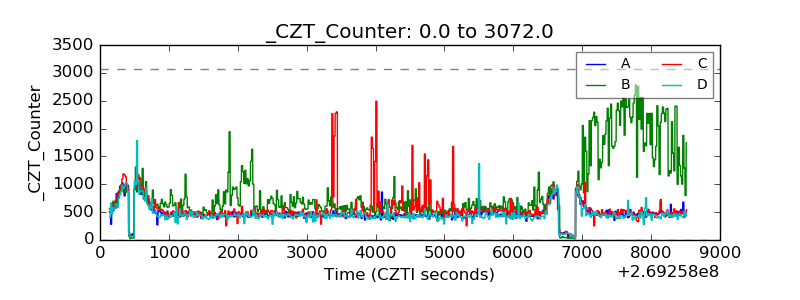 |
| +2.5 Volts monitor |  |
| +5 Volts monitor | 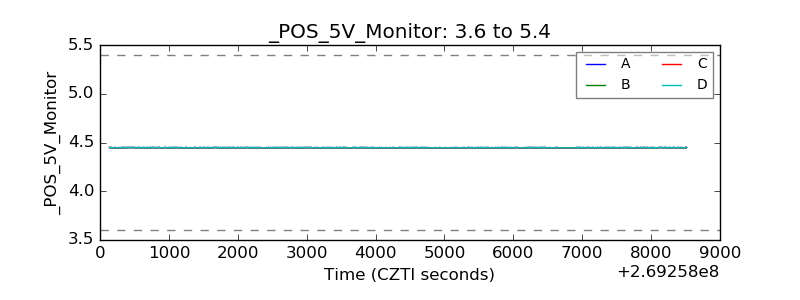 |
| _ROLL_ROT |  |
| _Roll_DEC | 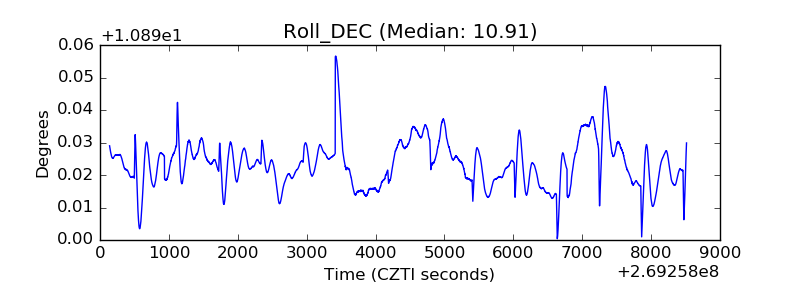 |
| _Roll_RA | 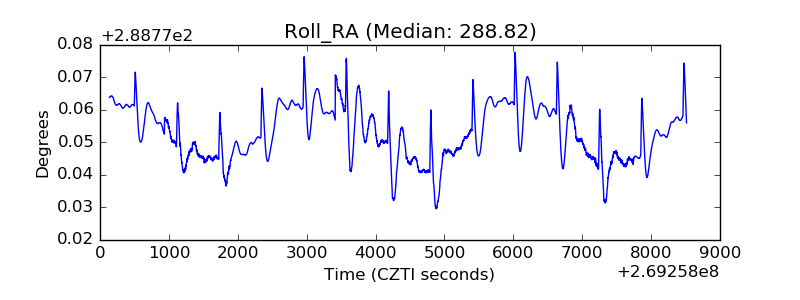 |
| Veto Counter | 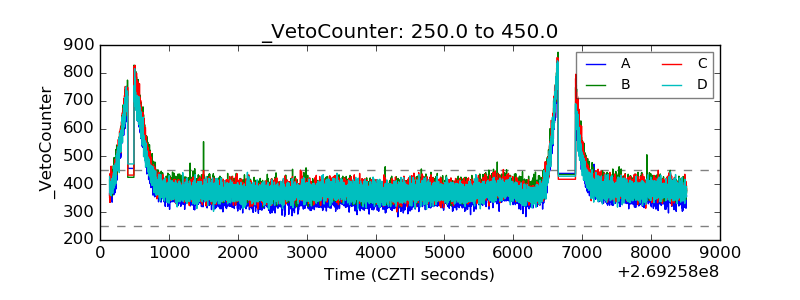 |