| Param | Original file | Final file |
|---|---|---|
| Filename | modeM0/AS1G08_028T01_9000002220_15105cztM0_level2.evt | modeM0/AS1G08_028T01_9000002220_15105cztM0_level2_quad_clean.evt |
| Size (bytes) | 1,257,192,000 | 219,265,920 |
| Size | 1.2 GB | 209.1 MB |
| Events in quadrant A | 8,037,630 | 1,389,230 |
| Events in quadrant B | 11,573,506 | 1,399,914 |
| Events in quadrant C | 9,598,068 | 1,345,729 |
| Events in quadrant D | 7,698,449 | 1,316,663 |
| Mode M0 | |||
|---|---|---|---|
| Quadrant | BADHDUFLAG | Total packets | Discarded packets |
| A | 0 | 35296 | 4 |
| B | 0 | 45604 | 4 |
| C | 0 | 38757 | 4 |
| D | 0 | 35313 | 4 |
| Mode SS | |||
|---|---|---|---|
| Quadrant | BADHDUFLAG | Total packets | Discarded packets |
| A | 0 | 352 | 0 |
| B | 0 | 352 | 0 |
| C | 0 | 352 | 0 |
| D | 0 | 352 | 0 |
| Mode M9 | |||
|---|---|---|---|
| Quadrant | BADHDUFLAG | Total packets | Discarded packets |
| A | 0 | 20 | 0 |
| B | 0 | 20 | 0 |
| C | 0 | 20 | 0 |
| D | 0 | 20 | 0 |
| Quadrant | Total seconds | Saturated seconds | Saturation percentage |
|---|---|---|---|
| A | 17252 | 146 | 0.846279% |
| B | 17252 | 1206 | 6.990494% |
| C | 17252 | 324 | 1.878043% |
| D | 17252 | 144 | 0.834686% |
Noise dominated data is calculated using 1-second bins in cleaned event files. If a bin has >2000 counts, and if more than 50% of those come from <1% of pixels, then it is considered to be noise-dominated and hence unusable.
| Quadrant | # 1 sec bins | Bins with >0 counts | Bins with >2000 counts | High rate bins dominated by noise | Noise dominated (total time) | Noise dominated (detector-on time) | Marked lightcurve |
|---|---|---|---|---|---|---|---|
| A | 19253 | 17254 | 5 | 5 | 0.03% | 0.03% | 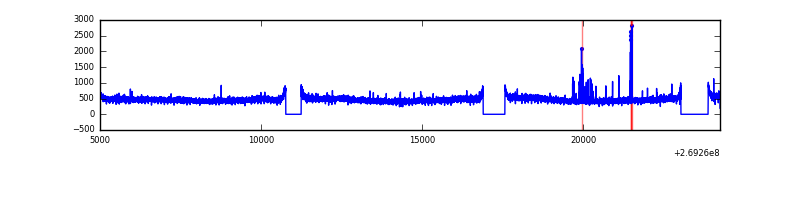 |
| B | 19253 | 17254 | 621 | 621 | 3.23% | 3.60% | 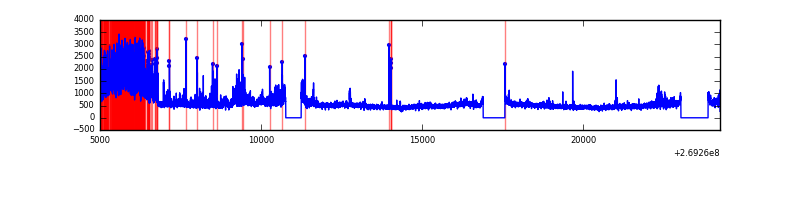 |
| C | 19253 | 17255 | 166 | 166 | 0.86% | 0.96% | 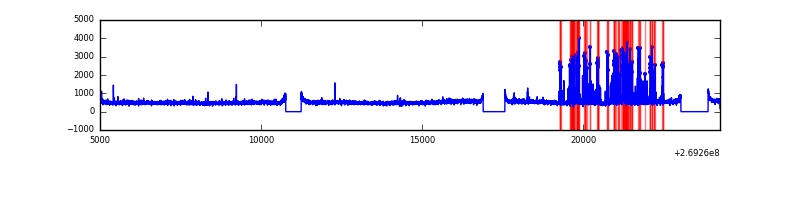 |
| D | 19253 | 17254 | 15 | 15 | 0.08% | 0.09% | 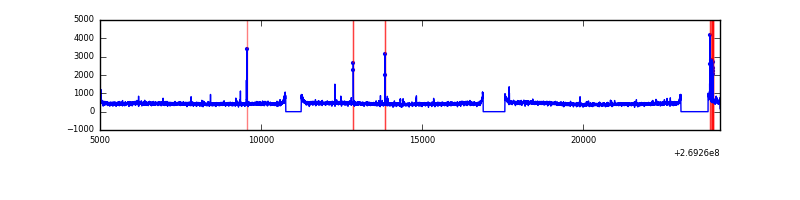 |
Top three noisy pixels from each quadrant. If the there are fewer than three noisy pixels in the level2.evt file, extra rows are filled as -1
| Pixel properties | Quadrant properties | ||||||
|---|---|---|---|---|---|---|---|
| Quadrant | DetID | PixID | Counts | Sigma | Mean | Median | Sigma |
| A | 11 | 29 | 68643 | 160.19 | 2070 | 2025 | 415.9 |
| A | 0 | 226 | 17934 | 38.25 | 2070 | 2025 | 415.9 |
| A | 12 | 194 | 15007 | 31.22 | 2070 | 2025 | 415.9 |
| B | 10 | 245 | 3100666 | 7973.45 | 2027 | 1974 | 388.6 |
| B | 3 | 64 | 519392 | 1331.4 | 2027 | 1974 | 388.6 |
| B | 12 | 111 | 49139 | 121.36 | 2027 | 1974 | 388.6 |
| C | 4 | 254 | 979926 | 2101.9 | 2004 | 2019 | 465.2 |
| C | 3 | 233 | 784265 | 1681.35 | 2004 | 2019 | 465.2 |
| C | 8 | 128 | 14833 | 27.54 | 2004 | 2019 | 465.2 |
| D | 7 | 223 | 72928 | 145.04 | 2008 | 1949 | 489.4 |
| D | 2 | 234 | 71522 | 142.17 | 2008 | 1949 | 489.4 |
| D | 10 | 70 | 27095 | 51.38 | 2008 | 1949 | 489.4 |
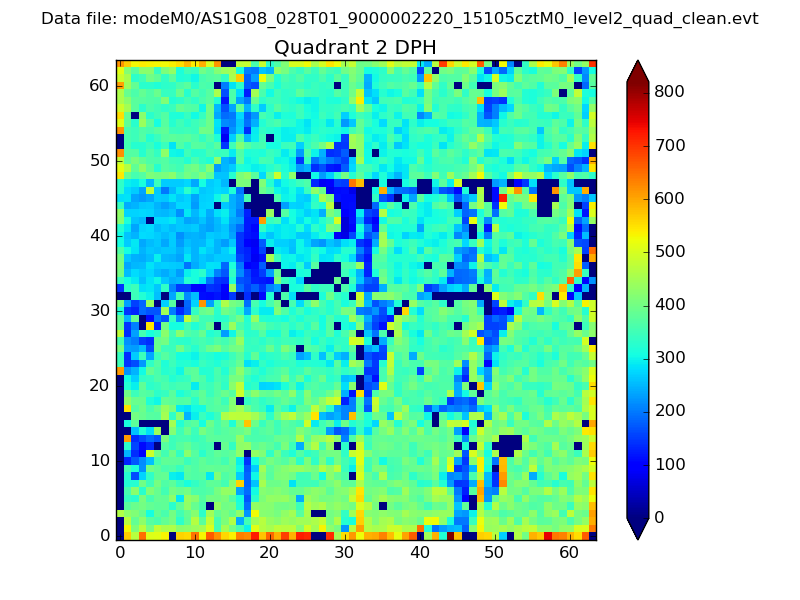
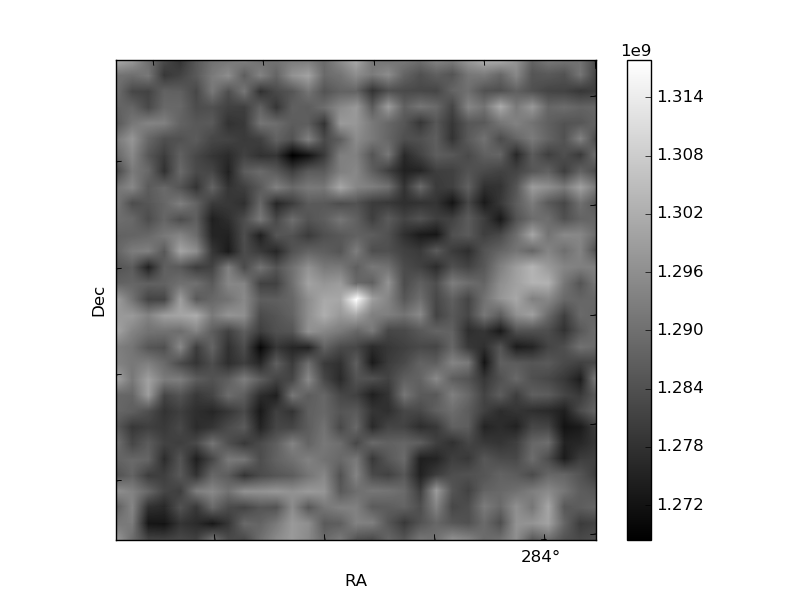
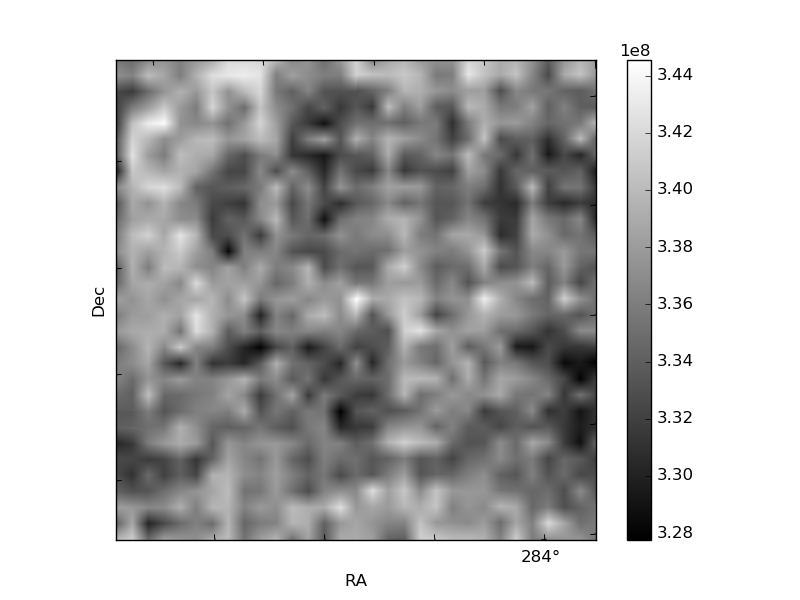
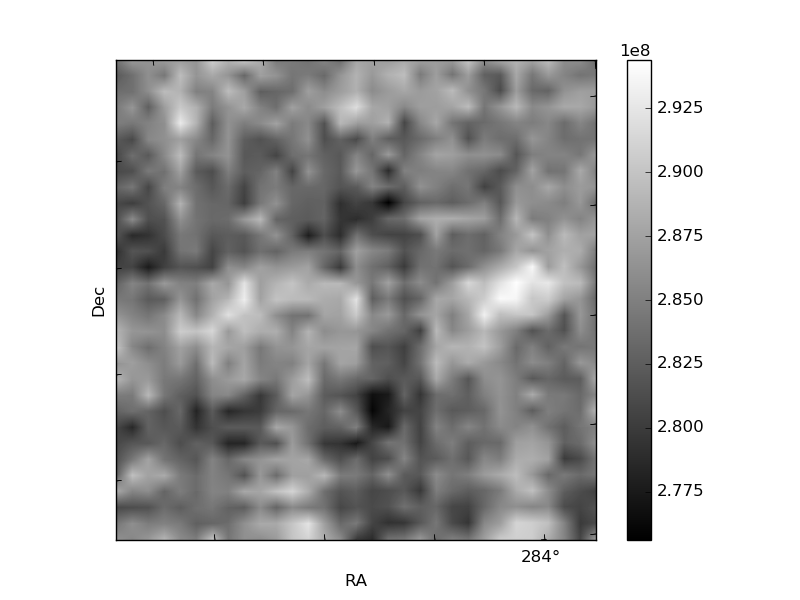
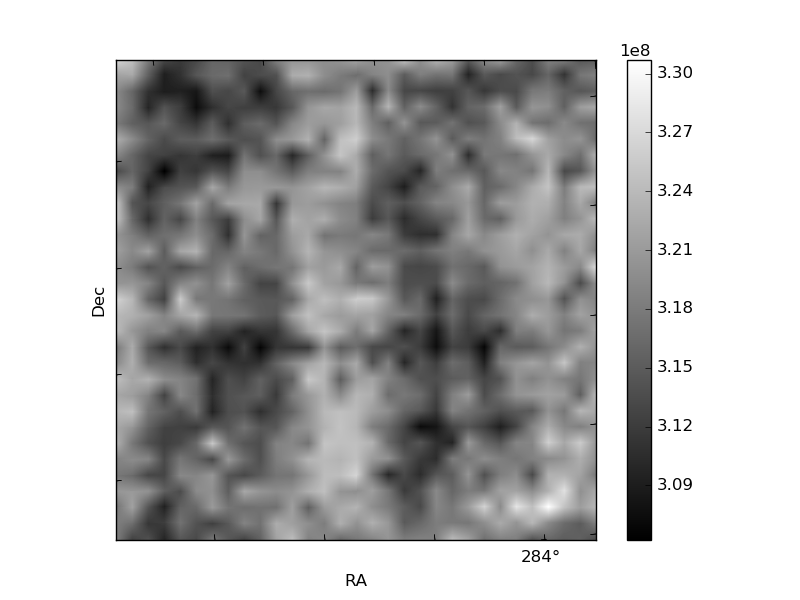
Histogram calculated using DETX and DETY for each event in the final _common_clean file
| Quadrant A | 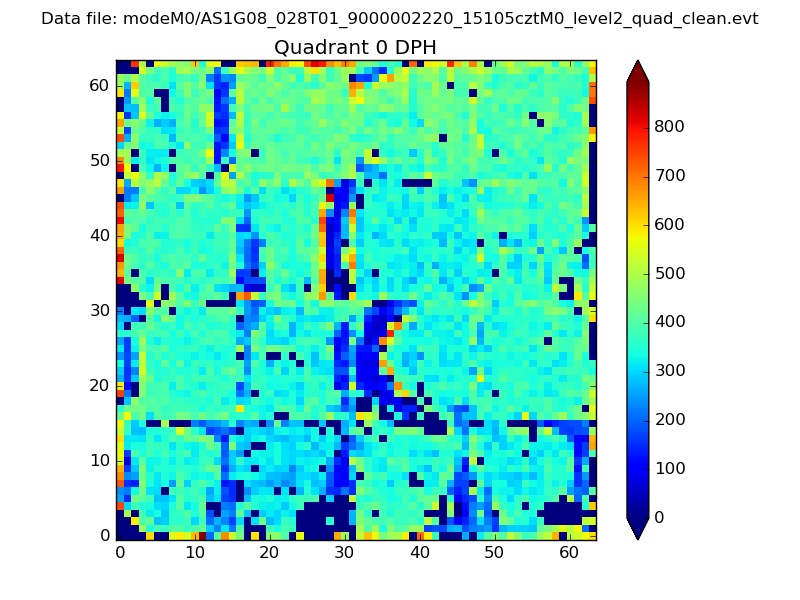 |
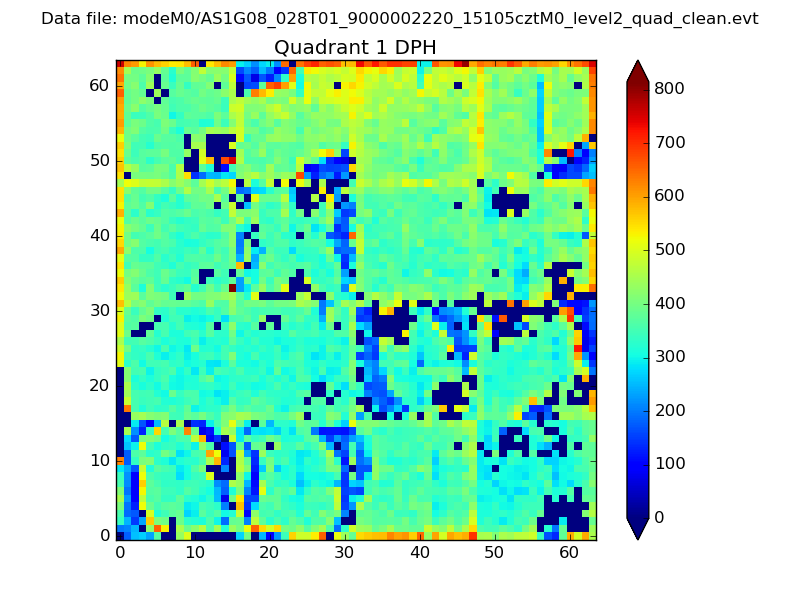 |
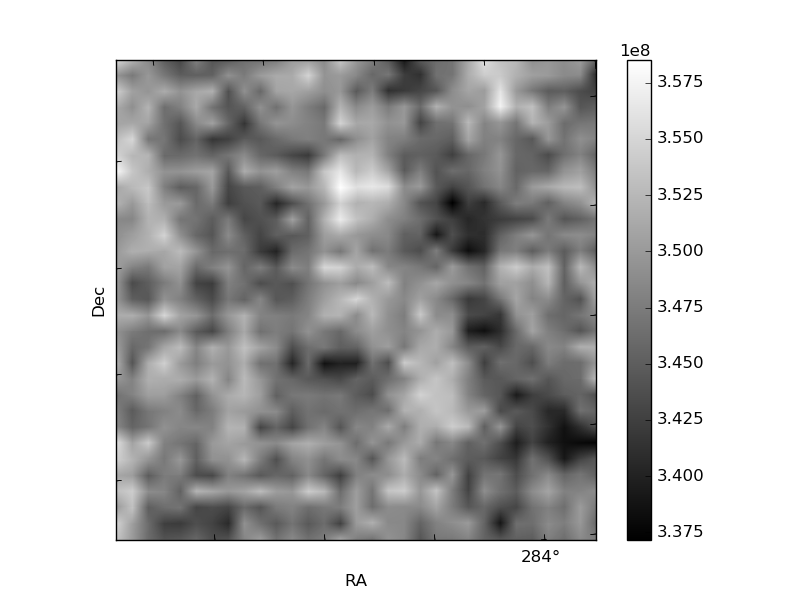
Quadrant B |
|---|---|---|---|
| Quadrant D | 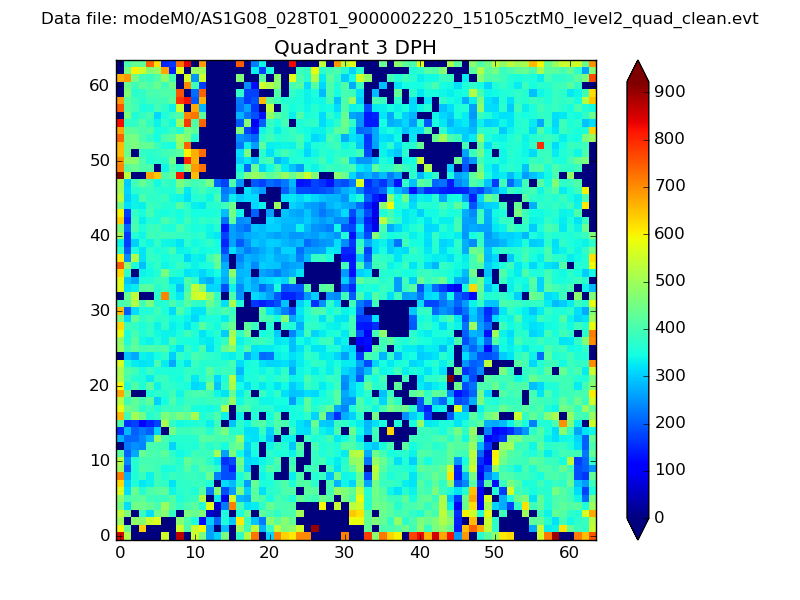 |
 |
Quadrant C |
| Plot type | Count rate plots | Images |
|---|---|---|
| Comparison with Poisson distribution Blue bars denote a histogram of data divided into 1 sec bins. Red curve is a Poisson curve with rate = median count rate of data. |
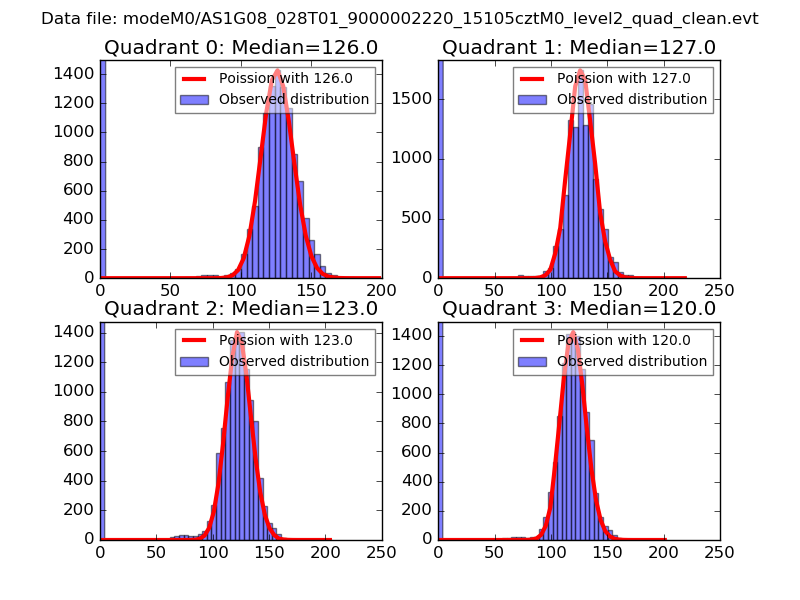 |
 |
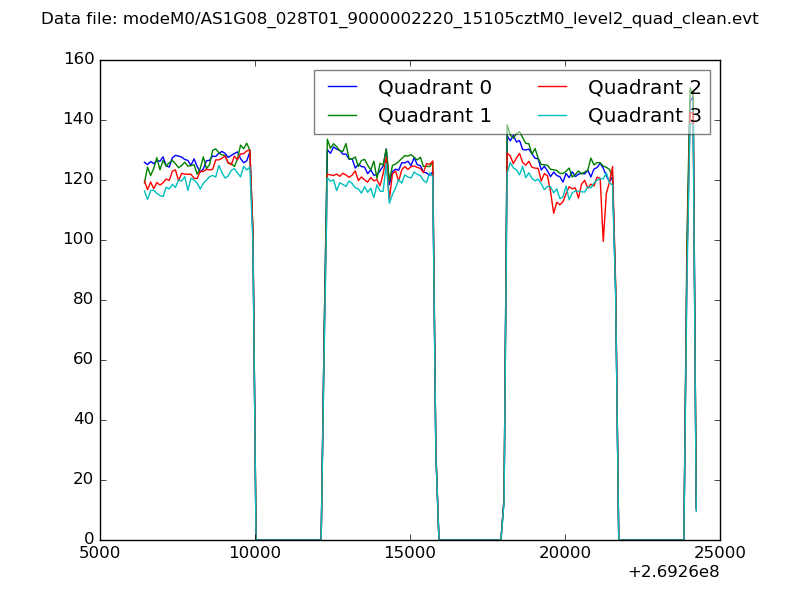
| Quadrant-wise count rates Data is divided into 100 sec bins |
 |
|
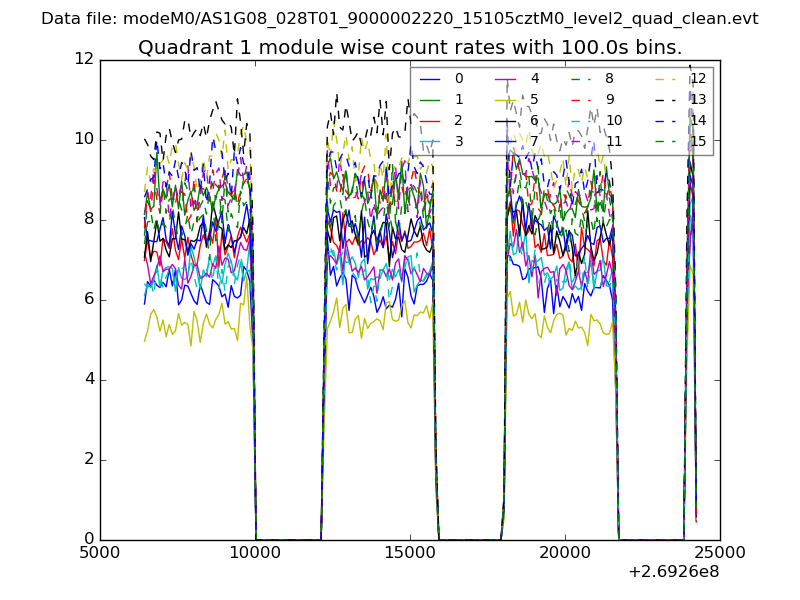
| Module-wise count rates for Quadrant A Data is divided into 100 sec bins |
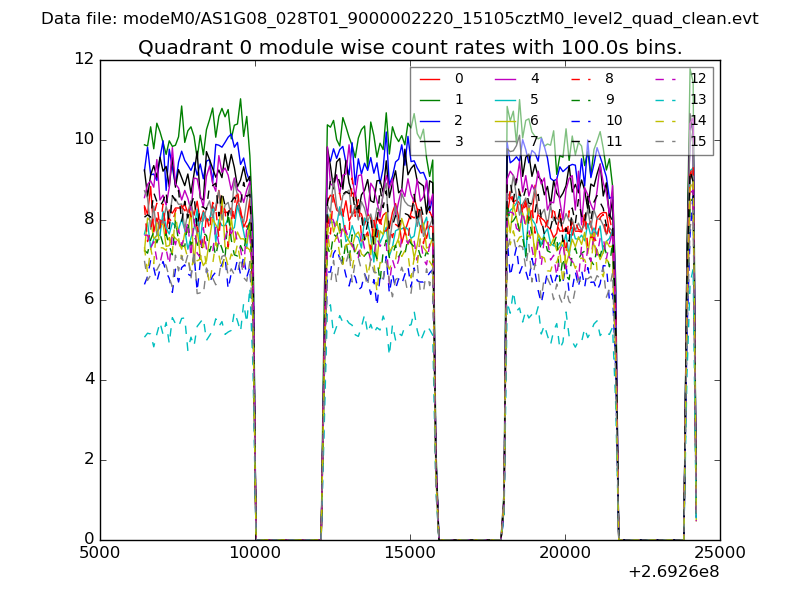 |
 |
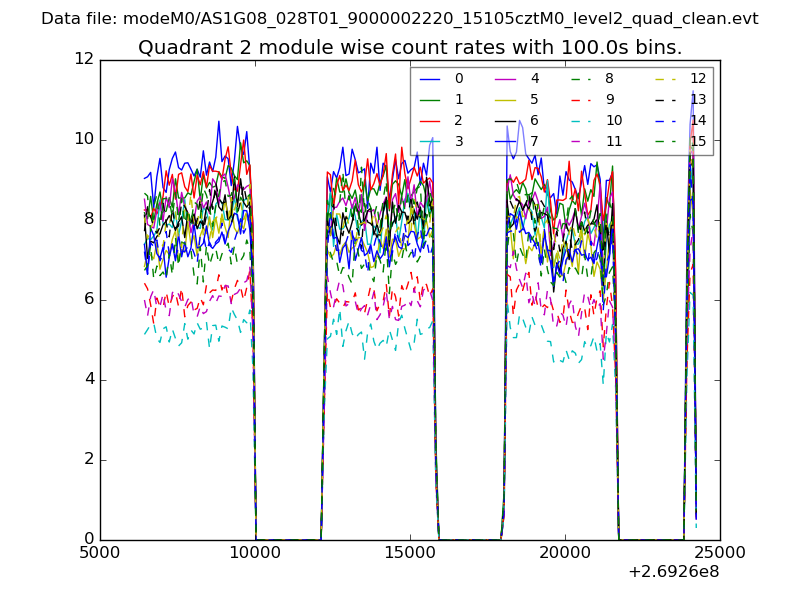
| Module-wise count rates for Quadrant B Data is divided into 100 sec bins |
 |
 |
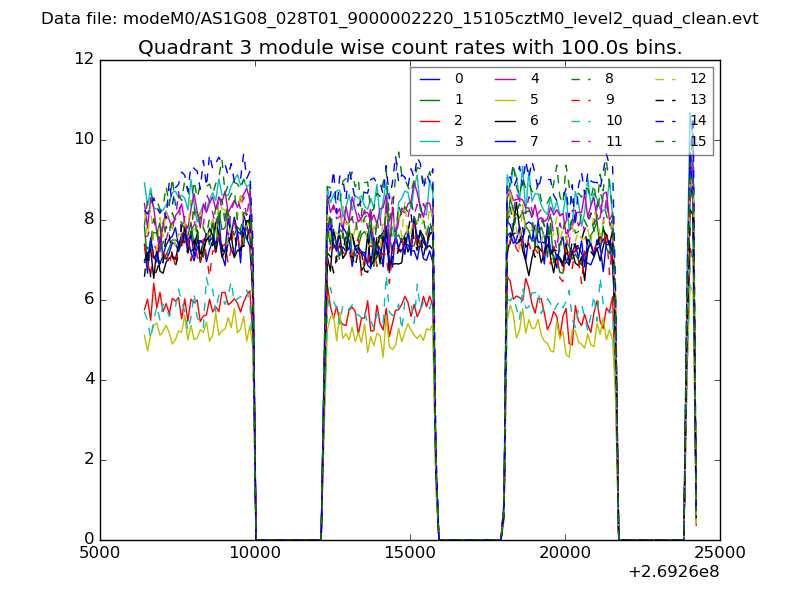
| Module-wise count rates for Quadrant C Data is divided into 100 sec bins |
 |
 |
| Module-wise count rates for Quadrant D Data is divided into 100 sec bins |
 |
 |
| Parameter | Plot |
|---|---|
| CZT HV Monitor | 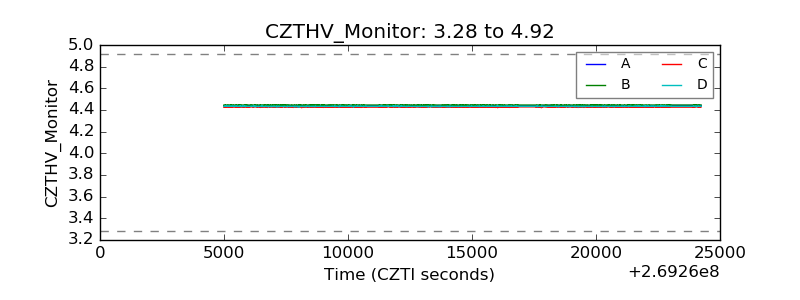 |
| D_VDD | 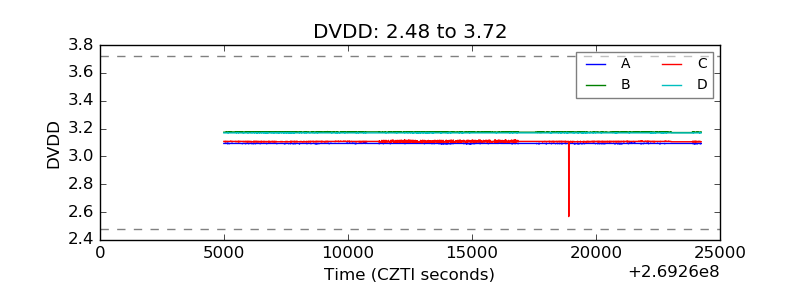 |
| Temperature 1 | 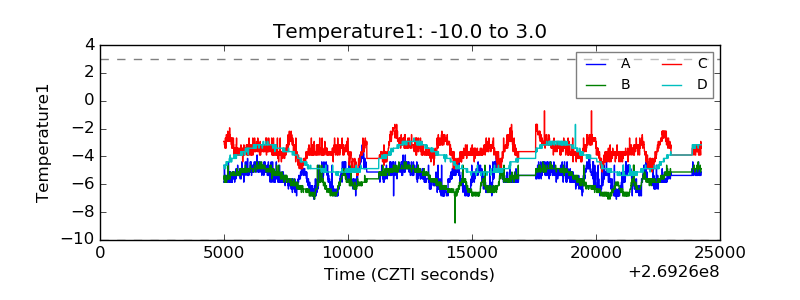 |
| Veto HV Monitor | 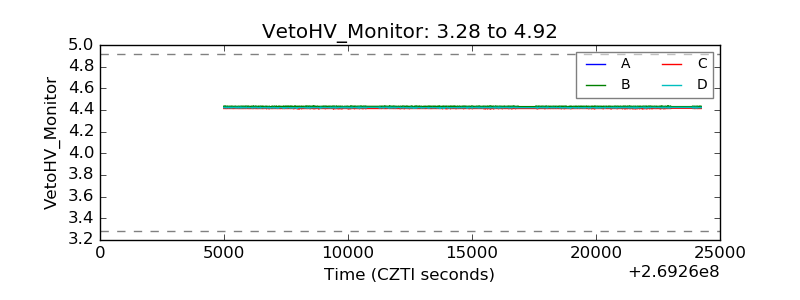 |
| Veto LLD | 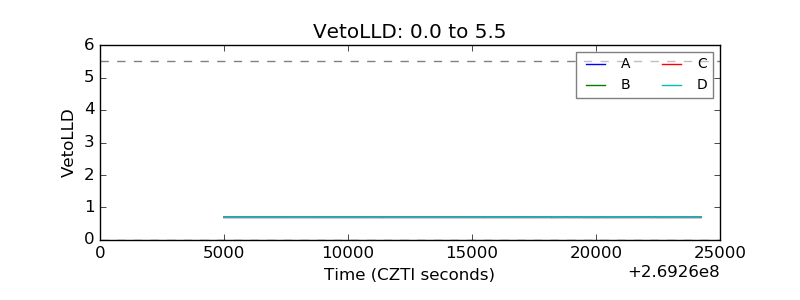 |
| Alpha Counter | 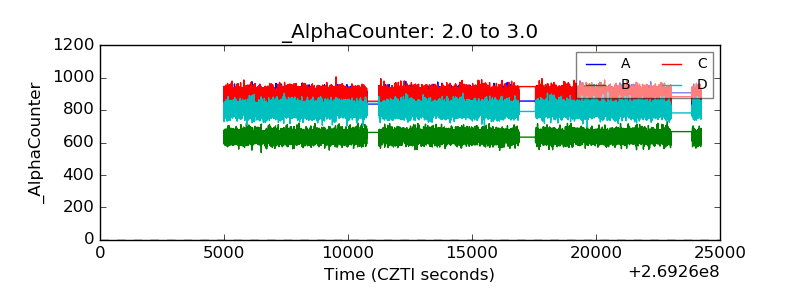 |
| _CPM_Rate | 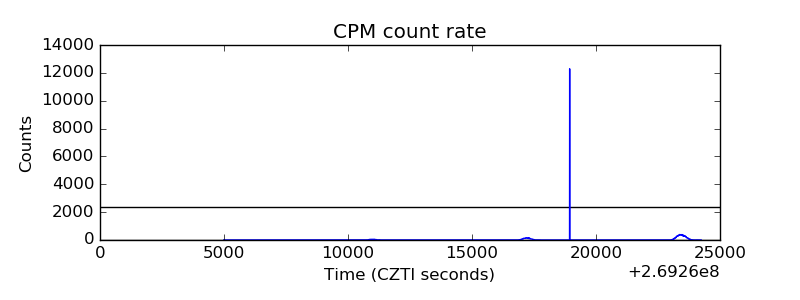 |
| CZT Counter | 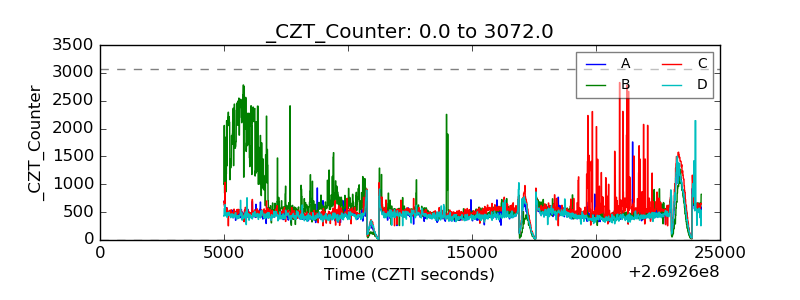 |
| +2.5 Volts monitor |  |
| +5 Volts monitor | 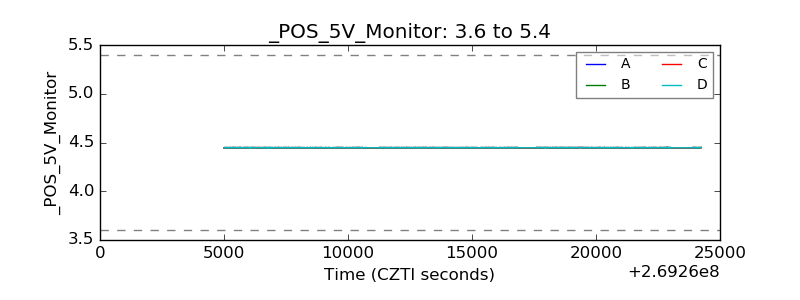 |
| _ROLL_ROT | 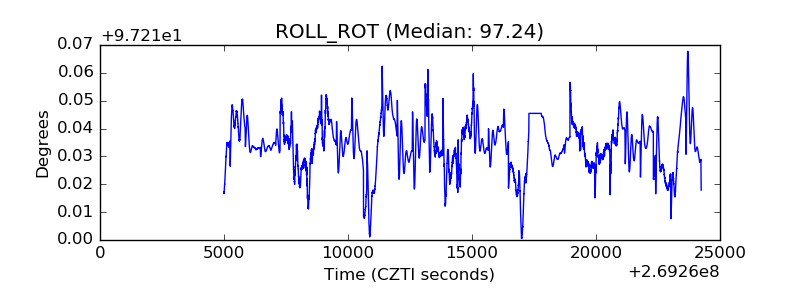 |
| _Roll_DEC | 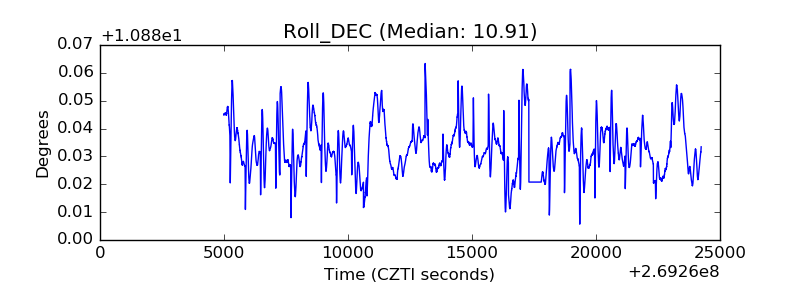 |
| _Roll_RA | 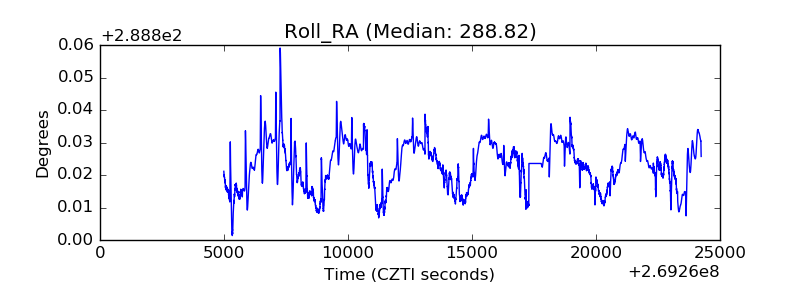 |
| Veto Counter | 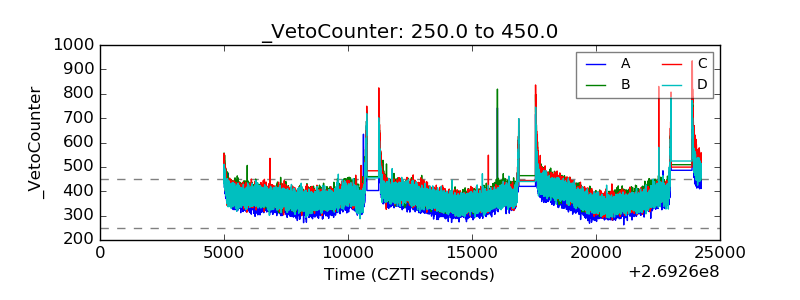 |