| Param | Original file | Final file |
|---|---|---|
| Filename | modeM0/AS1A04_130T03_9000002224_15110cztM0_level2.evt | modeM0/AS1A04_130T03_9000002224_15110cztM0_level2_quad_clean.evt |
| Size (bytes) | 349,012,800 | 54,138,240 |
| Size | 332.8 MB | 51.6 MB |
| Events in quadrant A | 2,097,620 | 337,661 |
| Events in quadrant B | 3,680,226 | 340,516 |
| Events in quadrant C | 2,427,090 | 343,968 |
| Events in quadrant D | 2,084,048 | 326,223 |
| Mode SS | |||
|---|---|---|---|
| Quadrant | BADHDUFLAG | Total packets | Discarded packets |
| A | 0 | 86 | 0 |
| B | 0 | 86 | 0 |
| C | 0 | 86 | 0 |
| D | 0 | 86 | 0 |
| Mode M9 | |||
|---|---|---|---|
| Quadrant | BADHDUFLAG | Total packets | Discarded packets |
| A | 0 | 13 | 0 |
| B | 0 | 13 | 0 |
| C | 0 | 13 | 0 |
| D | 0 | 13 | 0 |
| Mode M0 | |||
|---|---|---|---|
| Quadrant | BADHDUFLAG | Total packets | Discarded packets |
| A | 0 | 8687 | 3 |
| B | 0 | 13775 | 1 |
| C | 0 | 9795 | 1 |
| D | 0 | 8692 | 1 |
| Quadrant | Total seconds | Saturated seconds | Saturation percentage |
|---|---|---|---|
| A | 4119 | 22 | 0.534110% |
| B | 4119 | 389 | 9.444040% |
| C | 4119 | 15 | 0.364166% |
| D | 4119 | 20 | 0.485555% |
Noise dominated data is calculated using 1-second bins in cleaned event files. If a bin has >2000 counts, and if more than 50% of those come from <1% of pixels, then it is considered to be noise-dominated and hence unusable.
| Quadrant | # 1 sec bins | Bins with >0 counts | Bins with >2000 counts | High rate bins dominated by noise | Noise dominated (total time) | Noise dominated (detector-on time) | Marked lightcurve |
|---|---|---|---|---|---|---|---|
| A | 5451 | 4122 | 0 | 0 | 0.00% | 0.00% | 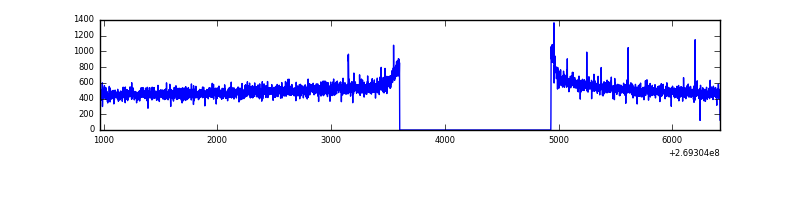 |
| B | 5451 | 4122 | 214 | 214 | 3.93% | 5.19% | 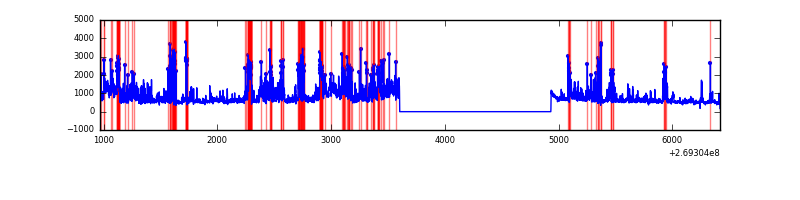 |
| C | 5451 | 4122 | 2 | 2 | 0.04% | 0.05% | 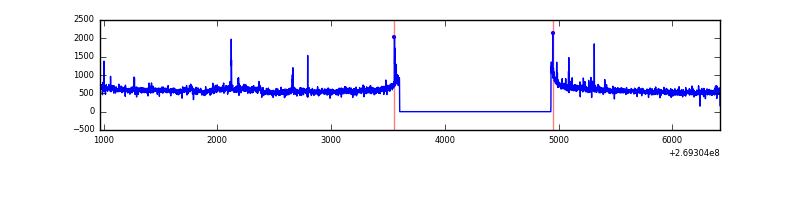 |
| D | 5451 | 4122 | 14 | 14 | 0.26% | 0.34% | 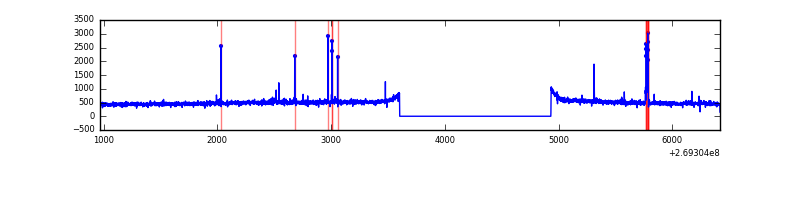 |
Top three noisy pixels from each quadrant. If the there are fewer than three noisy pixels in the level2.evt file, extra rows are filled as -1
| Pixel properties | Quadrant properties | ||||||
|---|---|---|---|---|---|---|---|
| Quadrant | DetID | PixID | Counts | Sigma | Mean | Median | Sigma |
| A | 12 | 189 | 9940 | 85.2 | 540 | 529 | 110.5 |
| A | 9 | 143 | 5567 | 45.61 | 540 | 529 | 110.5 |
| A | 0 | 226 | 4877 | 39.36 | 540 | 529 | 110.5 |
| B | 10 | 245 | 1174672 | 11703.95 | 526 | 512 | 100.3 |
| B | 0 | 229 | 290064 | 2886.23 | 526 | 512 | 100.3 |
| B | 3 | 64 | 137414 | 1364.63 | 526 | 512 | 100.3 |
| C | 3 | 233 | 298481 | 2403.19 | 535 | 539 | 124.0 |
| C | 4 | 254 | 43852 | 349.36 | 535 | 539 | 124.0 |
| C | 13 | 61 | 3730 | 25.74 | 535 | 539 | 124.0 |
| D | 13 | 249 | 26656 | 202.13 | 532 | 516 | 129.3 |
| D | 2 | 152 | 20056 | 151.09 | 532 | 516 | 129.3 |
| D | 2 | 120 | 16267 | 121.79 | 532 | 516 | 129.3 |
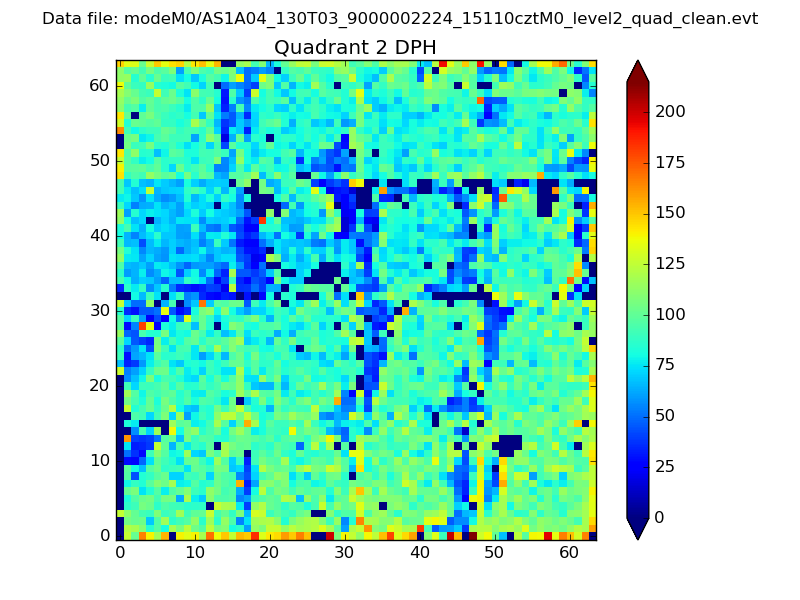
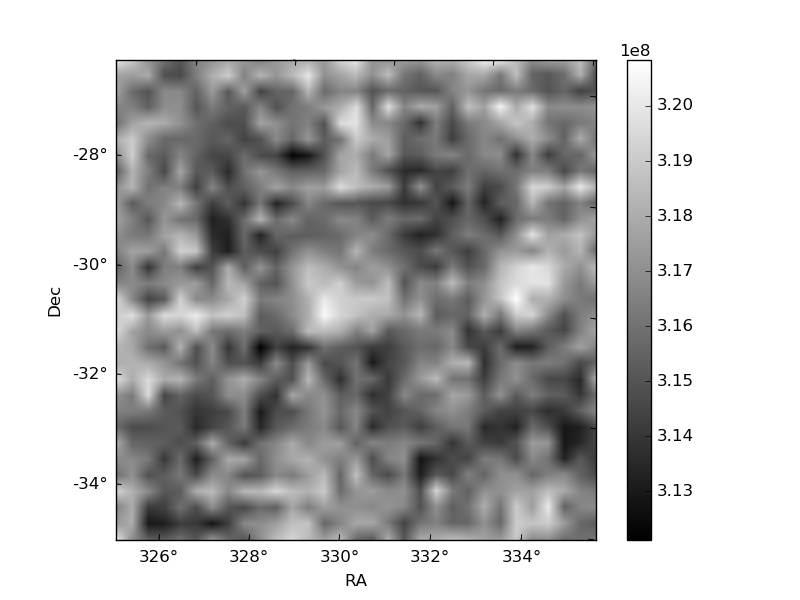
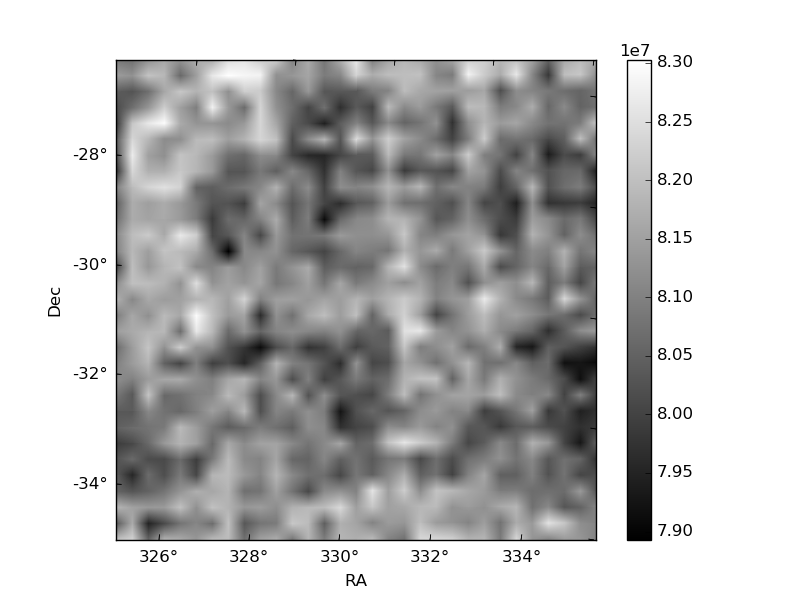
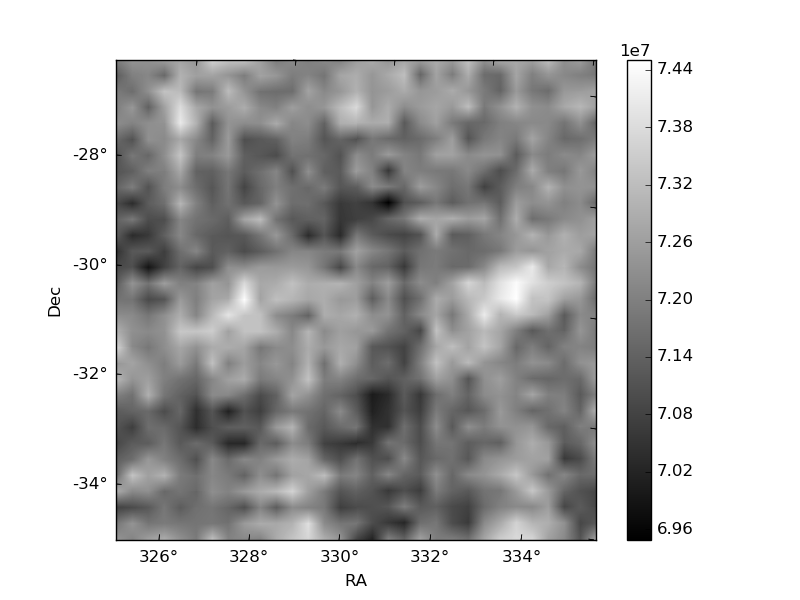
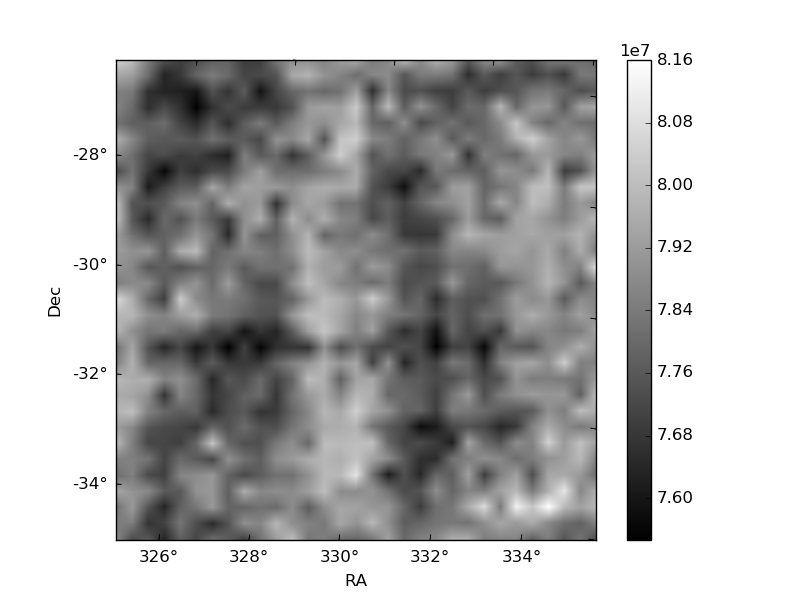
Histogram calculated using DETX and DETY for each event in the final _common_clean file
| Quadrant A | 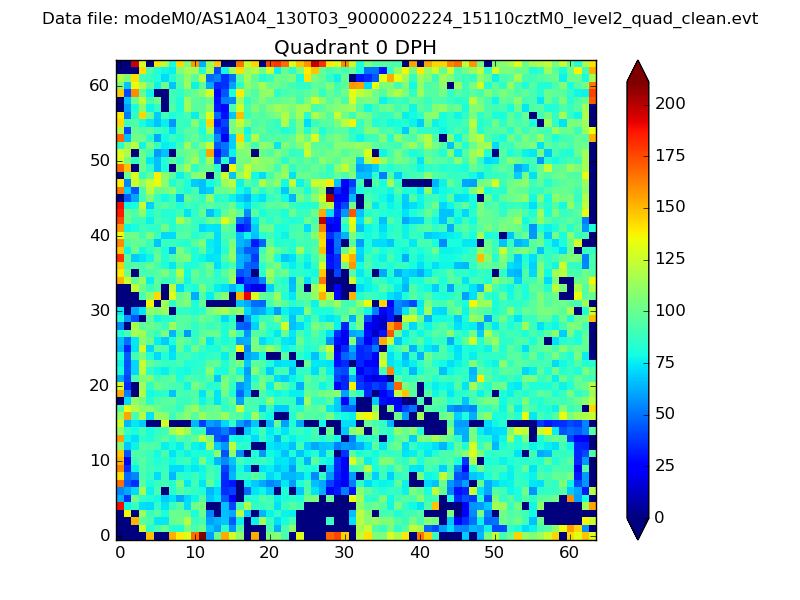 |
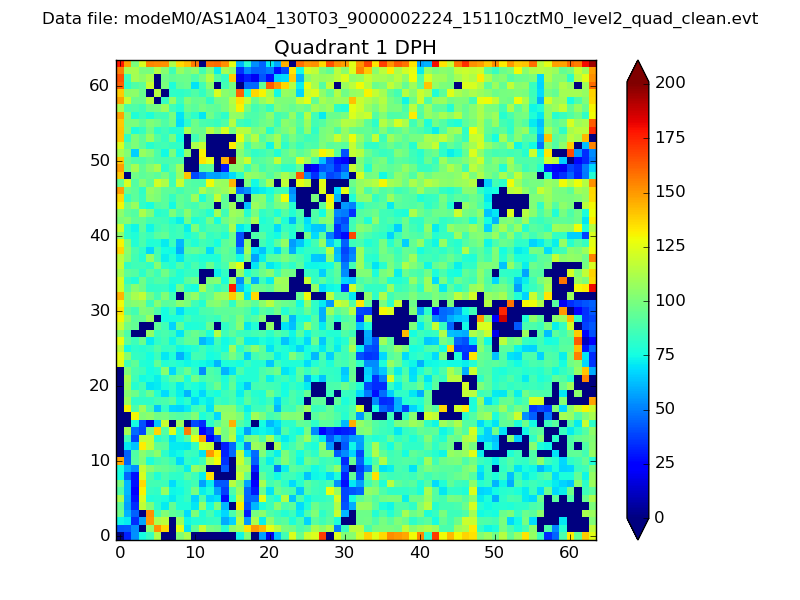 |
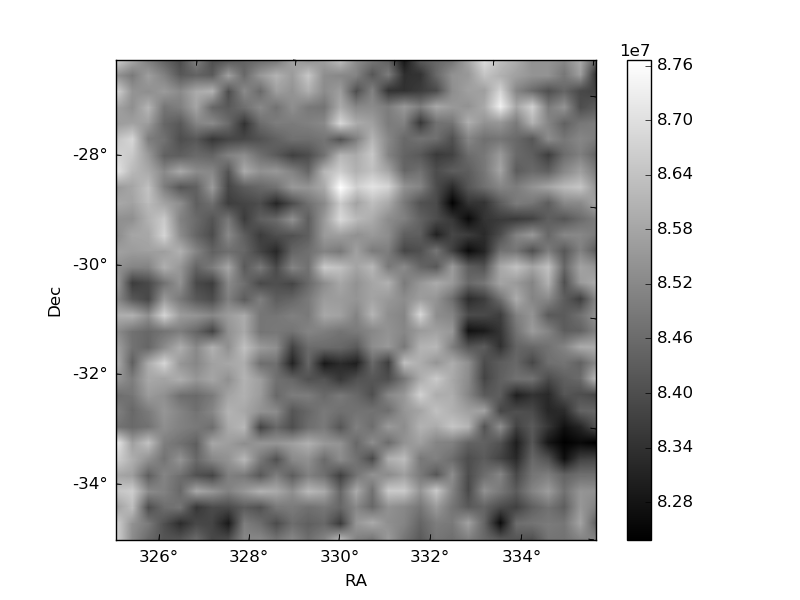
Quadrant B |
|---|---|---|---|
| Quadrant D | 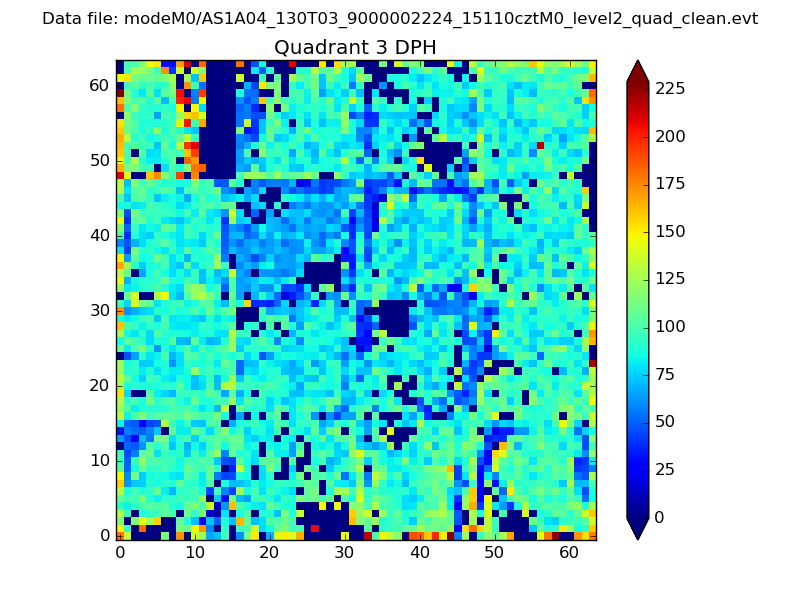 |
 |
Quadrant C |
| Plot type | Count rate plots | Images |
|---|---|---|
| Comparison with Poisson distribution Blue bars denote a histogram of data divided into 1 sec bins. Red curve is a Poisson curve with rate = median count rate of data. |
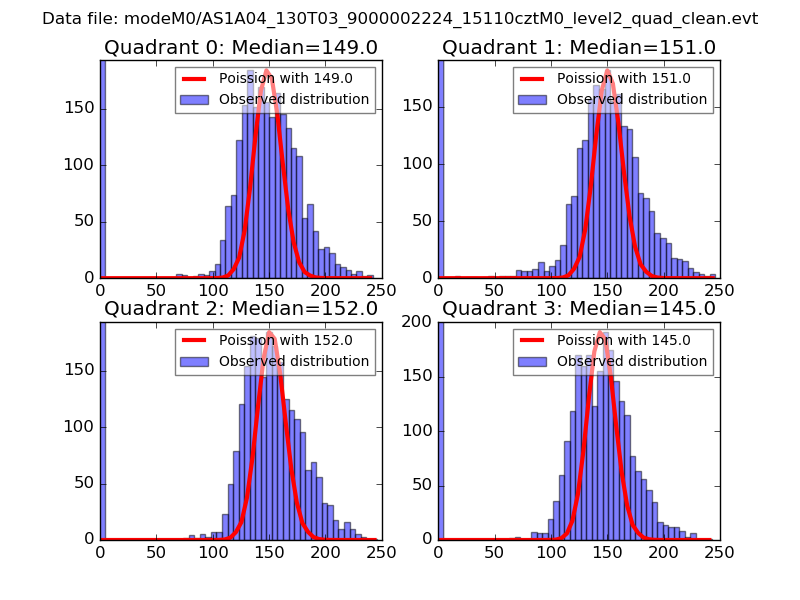 |
 |
| Quadrant-wise count rates Data is divided into 100 sec bins |
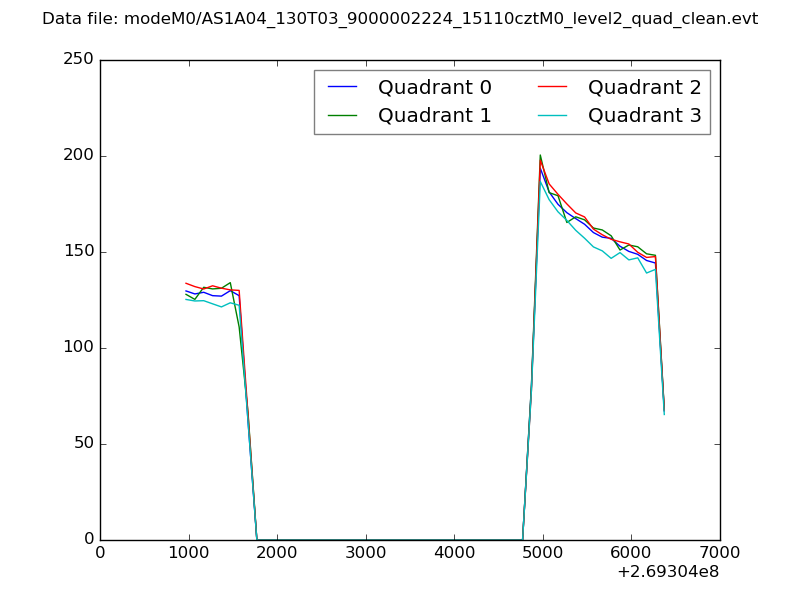 |
|
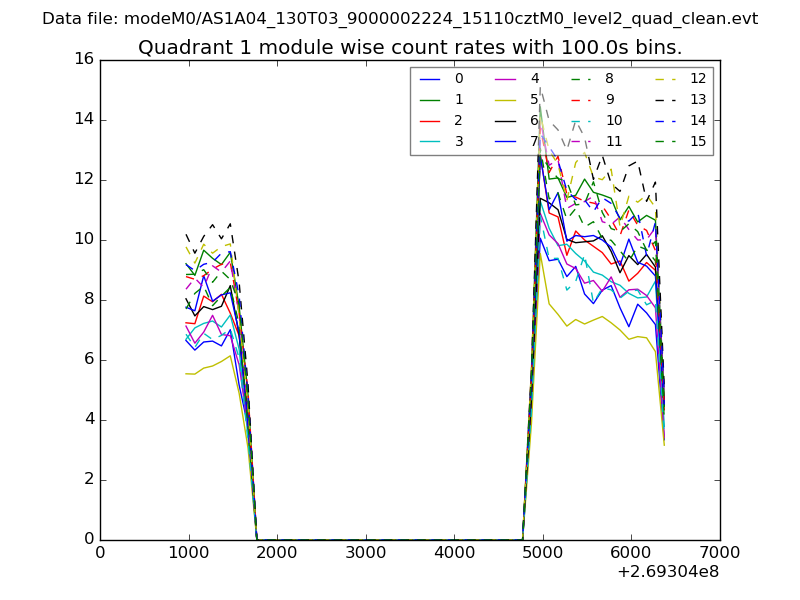
| Module-wise count rates for Quadrant A Data is divided into 100 sec bins |
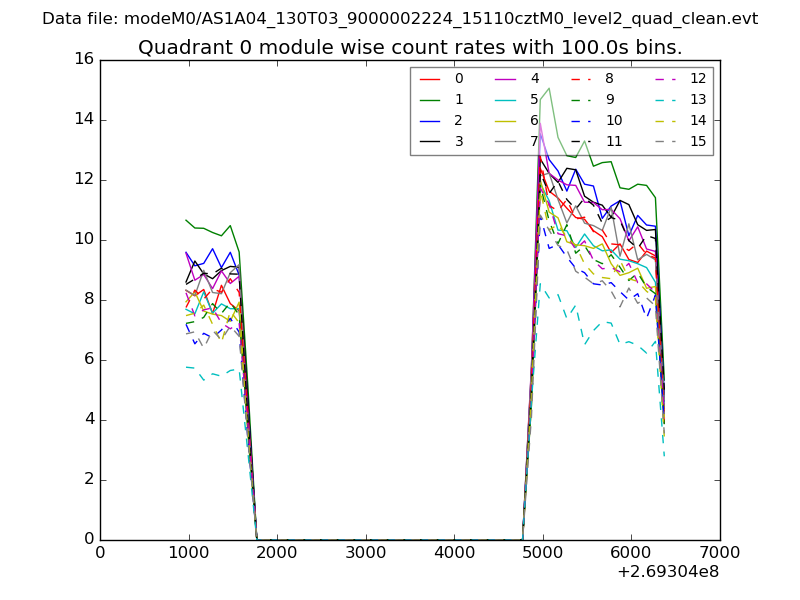 |
 |
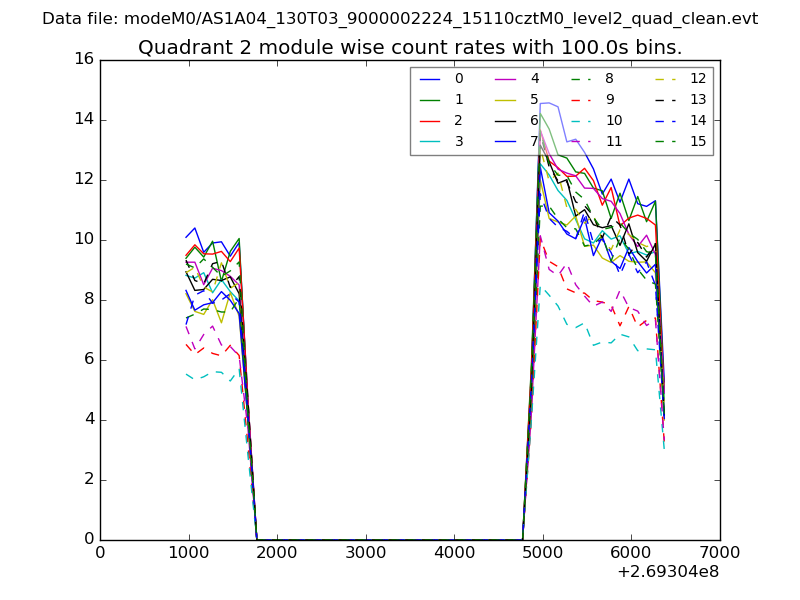
| Module-wise count rates for Quadrant B Data is divided into 100 sec bins |
 |
 |
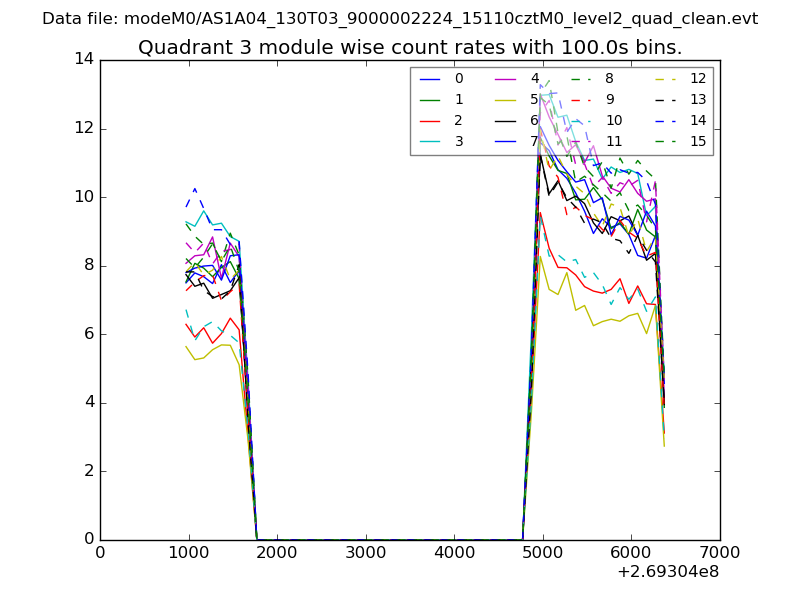
| Module-wise count rates for Quadrant C Data is divided into 100 sec bins |
 |
 |
| Module-wise count rates for Quadrant D Data is divided into 100 sec bins |
 |
 |
| Parameter | Plot |
|---|---|
| CZT HV Monitor | 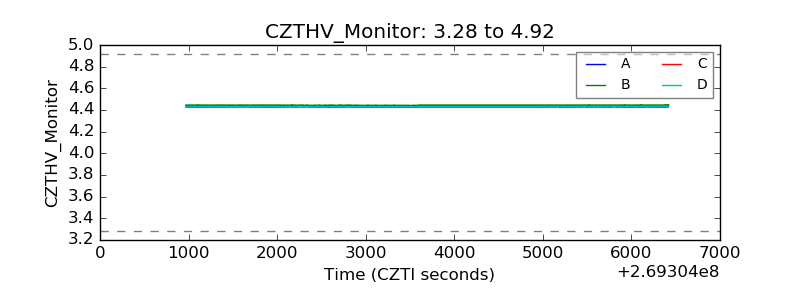 |
| D_VDD | 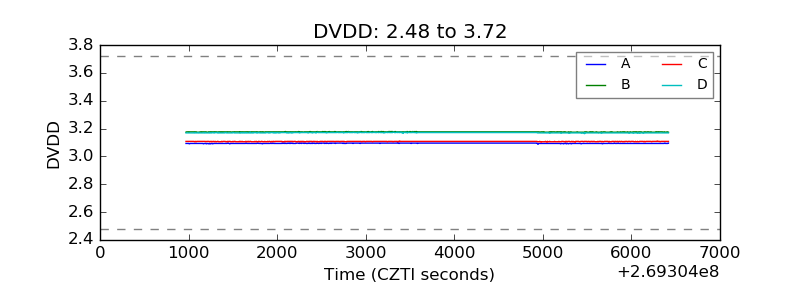 |
| Temperature 1 | 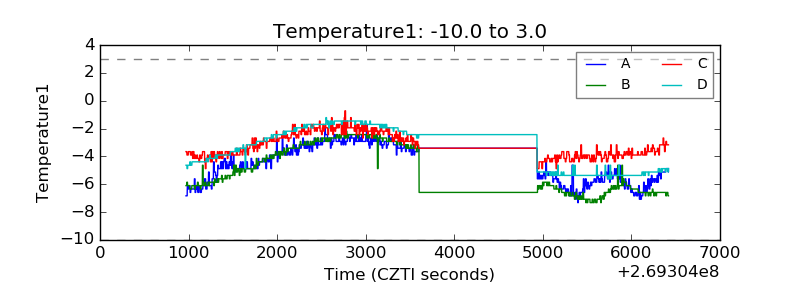 |
| Veto HV Monitor | 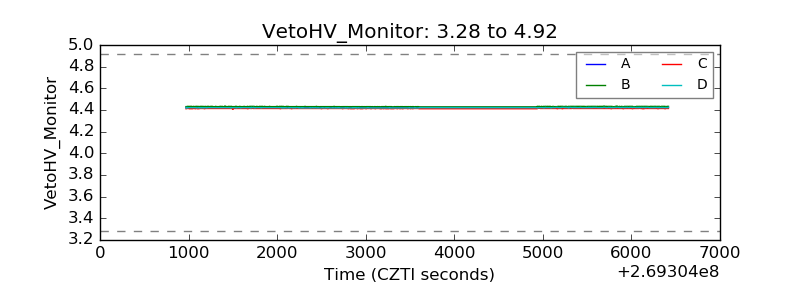 |
| Veto LLD | 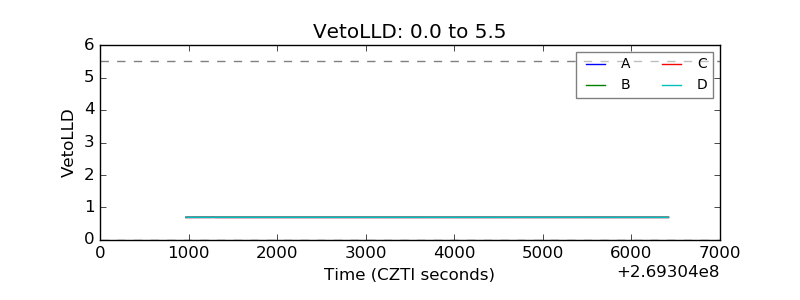 |
| Alpha Counter | 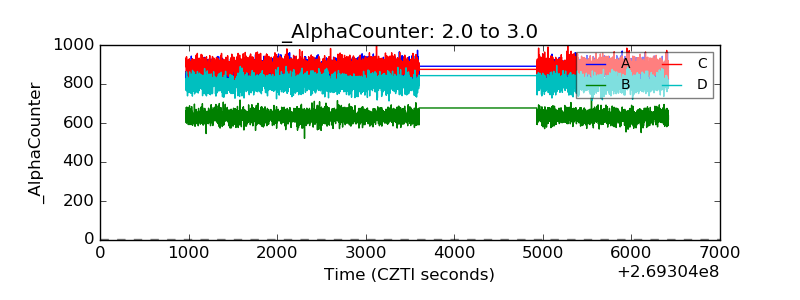 |
| _CPM_Rate | 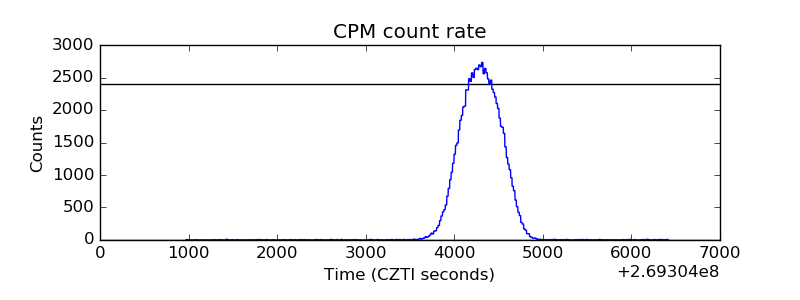 |
| CZT Counter | 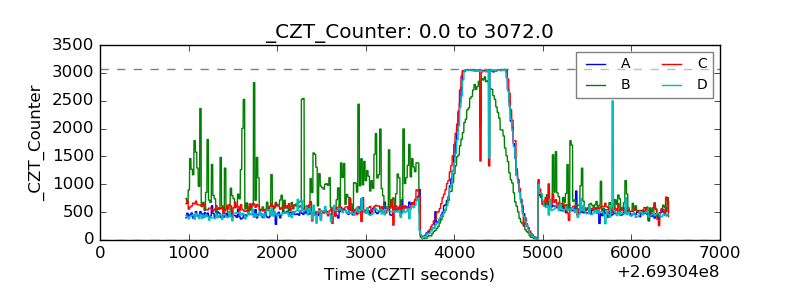 |
| +2.5 Volts monitor |  |
| +5 Volts monitor |  |
| _ROLL_ROT | 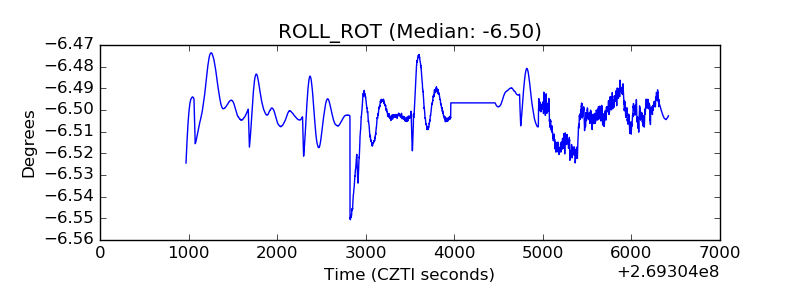 |
| _Roll_DEC | 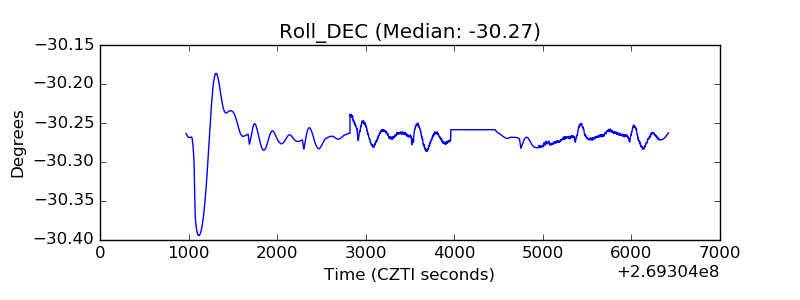 |
| _Roll_RA | 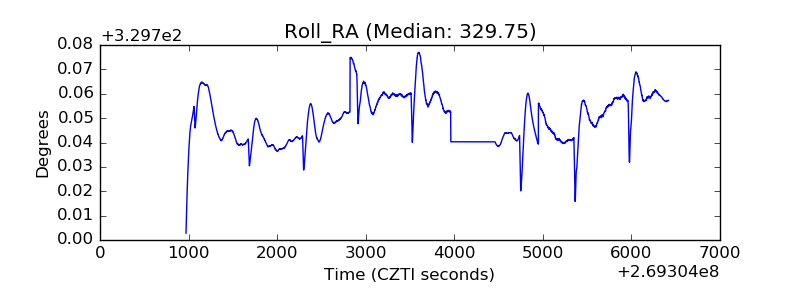 |
| Veto Counter | 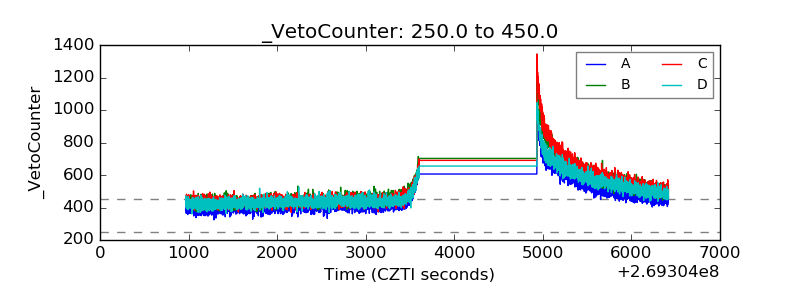 |