| Param | Original file | Final file |
|---|---|---|
| Filename | modeM0/AS1A04_130T03_9000002224_15111cztM0_level2.evt | modeM0/AS1A04_130T03_9000002224_15111cztM0_level2_quad_clean.evt |
| Size (bytes) | 506,479,680 | 97,824,960 |
| Size | 483.0 MB | 93.3 MB |
| Events in quadrant A | 3,212,799 | 632,436 |
| Events in quadrant B | 4,932,371 | 637,143 |
| Events in quadrant C | 3,581,072 | 641,897 |
| Events in quadrant D | 3,184,479 | 610,703 |
| Mode SS | |||
|---|---|---|---|
| Quadrant | BADHDUFLAG | Total packets | Discarded packets |
| A | 0 | 128 | 0 |
| B | 0 | 128 | 0 |
| C | 0 | 128 | 0 |
| D | 0 | 128 | 0 |
| Mode M9 | |||
|---|---|---|---|
| Quadrant | BADHDUFLAG | Total packets | Discarded packets |
| A | 0 | 16 | 0 |
| B | 0 | 16 | 0 |
| C | 0 | 16 | 0 |
| D | 0 | 16 | 0 |
| Mode M0 | |||
|---|---|---|---|
| Quadrant | BADHDUFLAG | Total packets | Discarded packets |
| A | 0 | 13337 | 4 |
| B | 0 | 18892 | 2 |
| C | 0 | 14278 | 2 |
| D | 0 | 13268 | 2 |
| Quadrant | Total seconds | Saturated seconds | Saturation percentage |
|---|---|---|---|
| A | 6311 | 42 | 0.665505% |
| B | 6311 | 464 | 7.352242% |
| C | 6311 | 43 | 0.681350% |
| D | 6311 | 24 | 0.380288% |
Noise dominated data is calculated using 1-second bins in cleaned event files. If a bin has >2000 counts, and if more than 50% of those come from <1% of pixels, then it is considered to be noise-dominated and hence unusable.
| Quadrant | # 1 sec bins | Bins with >0 counts | Bins with >2000 counts | High rate bins dominated by noise | Noise dominated (total time) | Noise dominated (detector-on time) | Marked lightcurve |
|---|---|---|---|---|---|---|---|
| A | 7653 | 6314 | 1 | 1 | 0.01% | 0.02% | 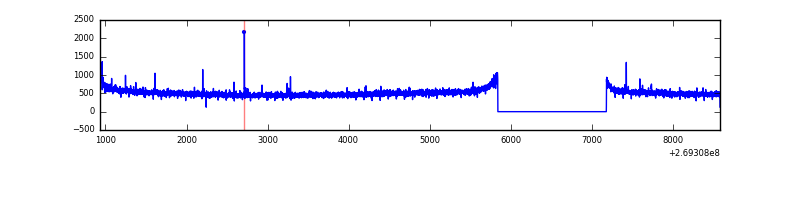 |
| B | 7653 | 6314 | 314 | 314 | 4.10% | 4.97% | 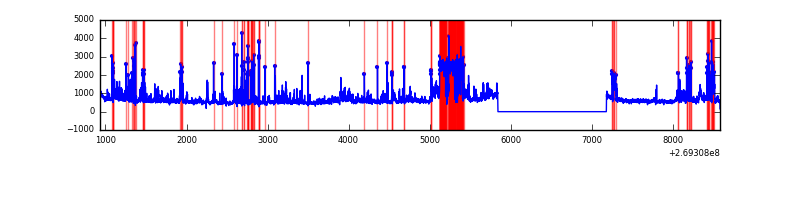 |
| C | 7653 | 6314 | 5 | 5 | 0.07% | 0.08% | 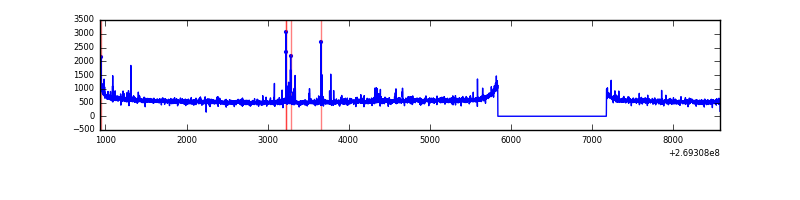 |
| D | 7653 | 6314 | 8 | 8 | 0.10% | 0.13% | 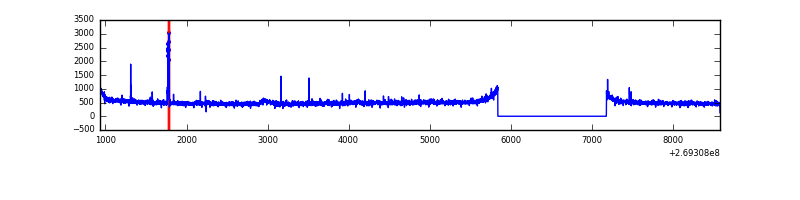 |
Top three noisy pixels from each quadrant. If the there are fewer than three noisy pixels in the level2.evt file, extra rows are filled as -1
| Pixel properties | Quadrant properties | ||||||
|---|---|---|---|---|---|---|---|
| Quadrant | DetID | PixID | Counts | Sigma | Mean | Median | Sigma |
| A | 9 | 143 | 13537 | 76.94 | 829 | 812 | 165.4 |
| A | 12 | 189 | 9630 | 53.32 | 829 | 812 | 165.4 |
| A | 0 | 226 | 7454 | 40.16 | 829 | 812 | 165.4 |
| B | 10 | 245 | 1259173 | 8431.45 | 805 | 786 | 149.2 |
| B | 3 | 64 | 442410 | 2958.97 | 805 | 786 | 149.2 |
| B | 0 | 229 | 76238 | 505.54 | 805 | 786 | 149.2 |
| C | 3 | 233 | 281198 | 1480.88 | 824 | 832 | 189.3 |
| C | 4 | 254 | 85756 | 448.57 | 824 | 832 | 189.3 |
| C | 13 | 61 | 5755 | 26.0 | 824 | 832 | 189.3 |
| D | 2 | 152 | 32969 | 161.65 | 819 | 797 | 199.0 |
| D | 13 | 249 | 28943 | 141.42 | 819 | 797 | 199.0 |
| D | 9 | 251 | 23630 | 114.73 | 819 | 797 | 199.0 |
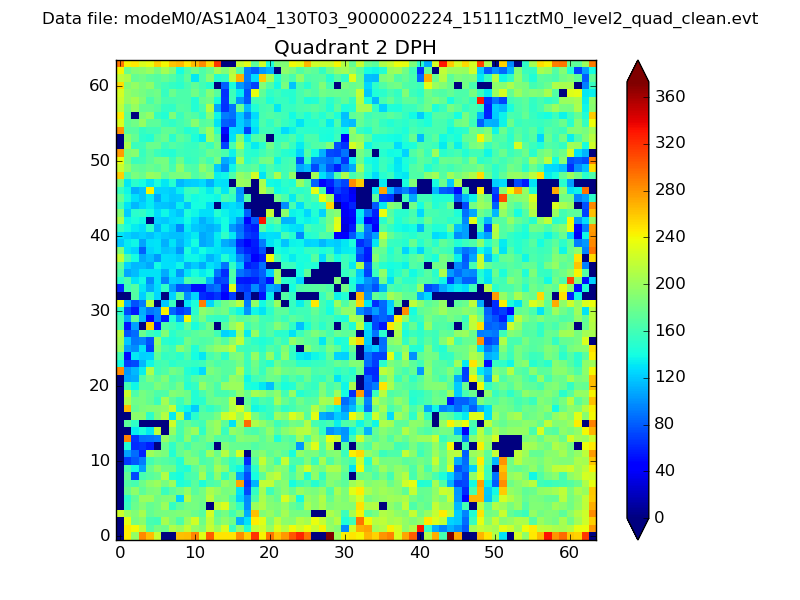
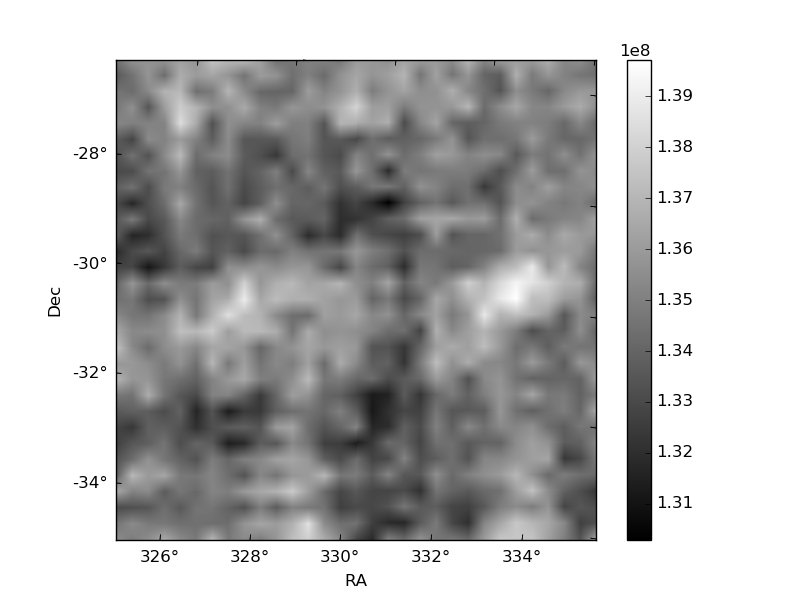
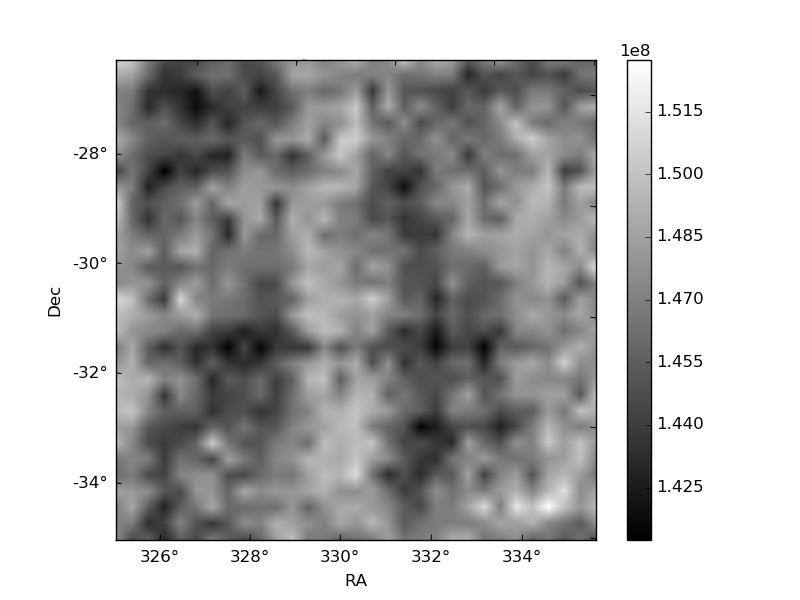
Histogram calculated using DETX and DETY for each event in the final _common_clean file
| Quadrant A | 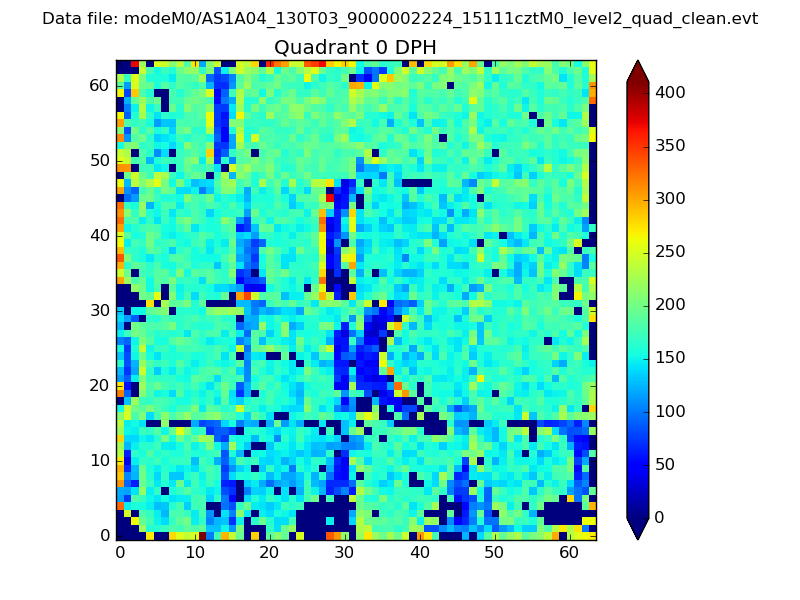 |
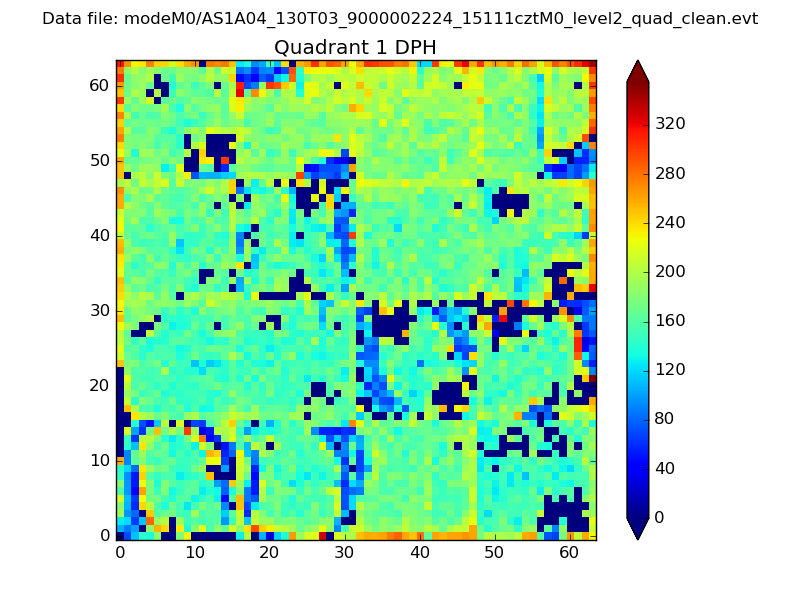 |
Quadrant B |
|---|---|---|---|
| Quadrant D | 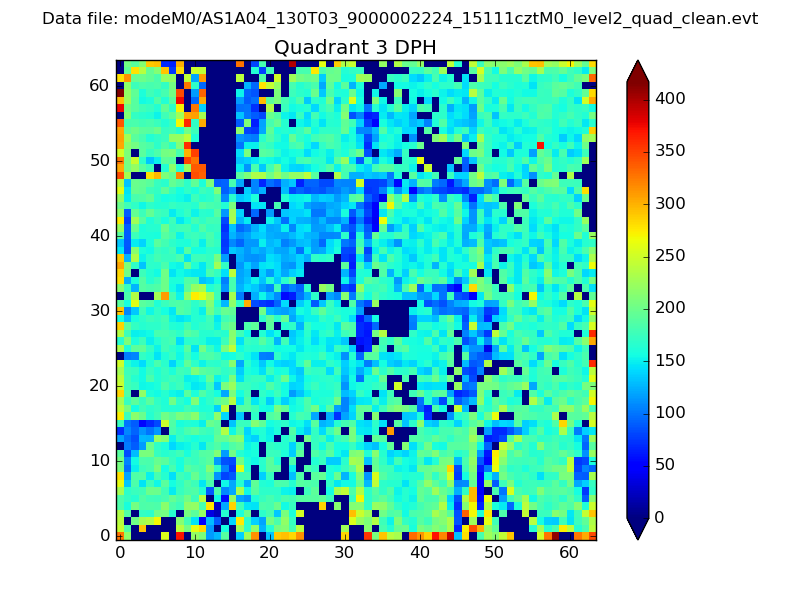 |
 |
Quadrant C |
| Plot type | Count rate plots | Images |
|---|---|---|
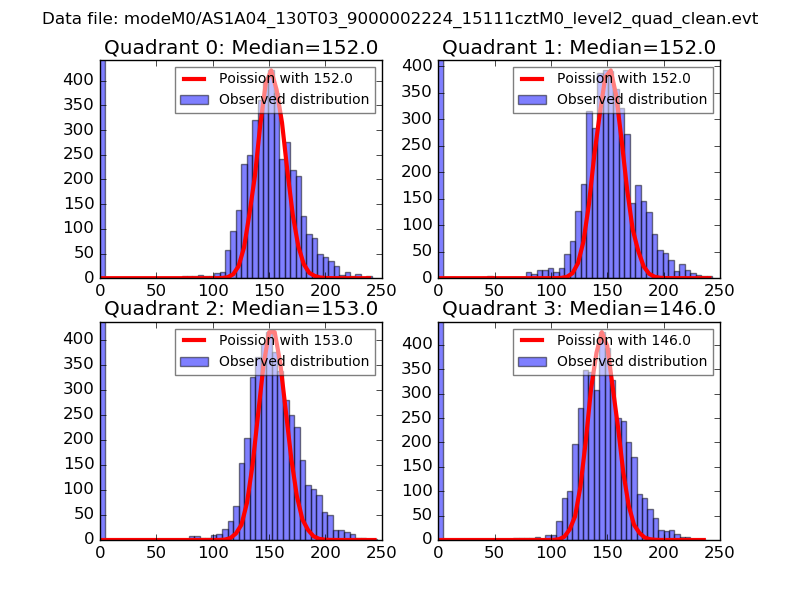
| Comparison with Poisson distribution Blue bars denote a histogram of data divided into 1 sec bins. Red curve is a Poisson curve with rate = median count rate of data. |
 |
 |
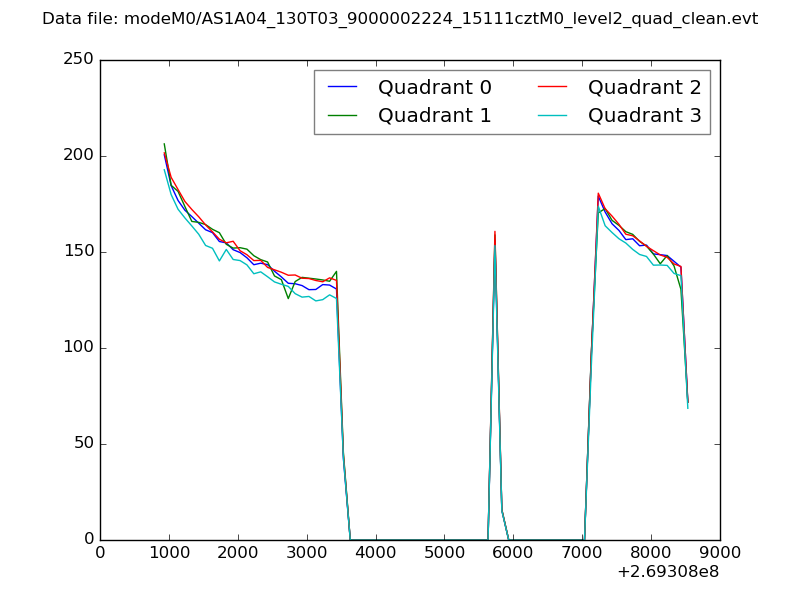
| Quadrant-wise count rates Data is divided into 100 sec bins |
 |
|
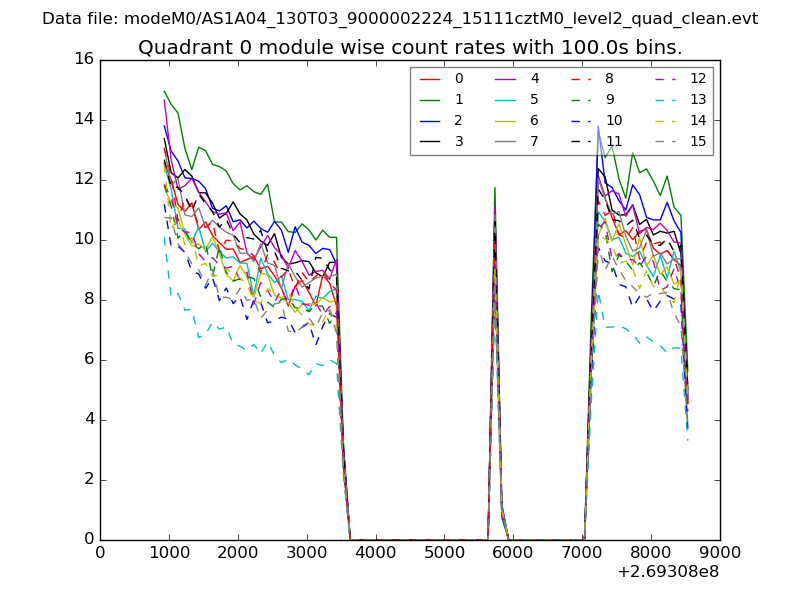
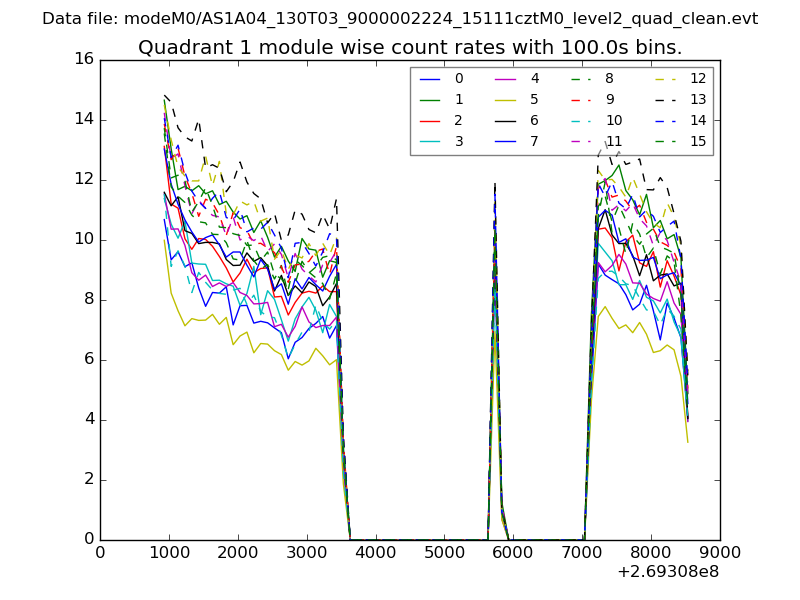
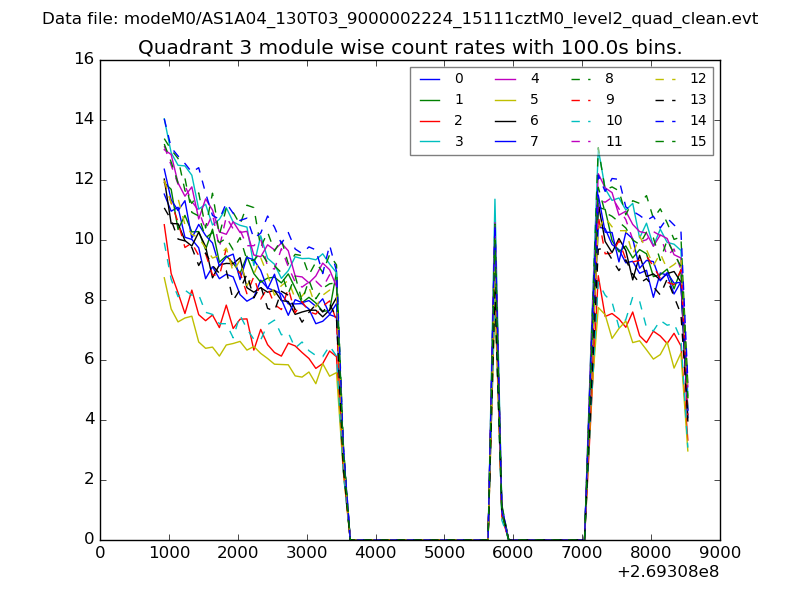
| Module-wise count rates for Quadrant A Data is divided into 100 sec bins |
 |
 |
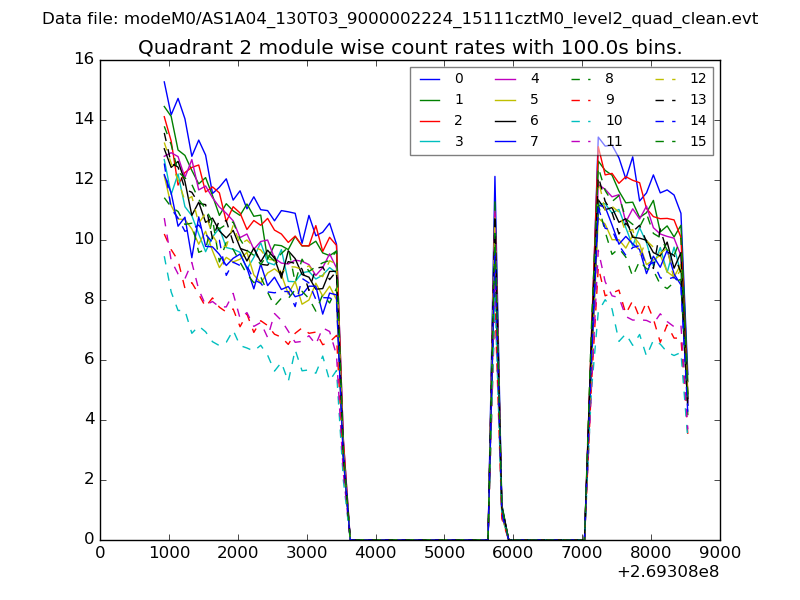
| Module-wise count rates for Quadrant B Data is divided into 100 sec bins |
 |
 |
| Module-wise count rates for Quadrant C Data is divided into 100 sec bins |
 |
 |
| Module-wise count rates for Quadrant D Data is divided into 100 sec bins |
 |
 |
| Parameter | Plot |
|---|---|
| CZT HV Monitor | 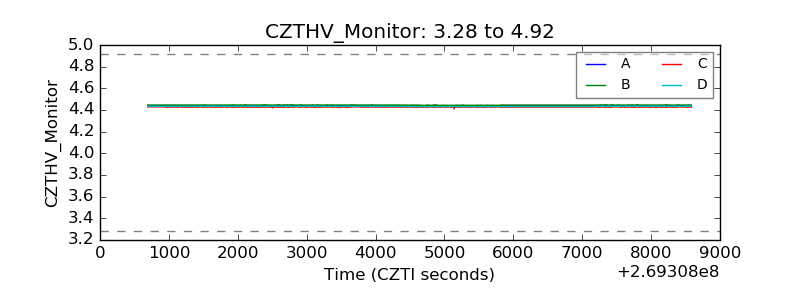 |
| D_VDD | 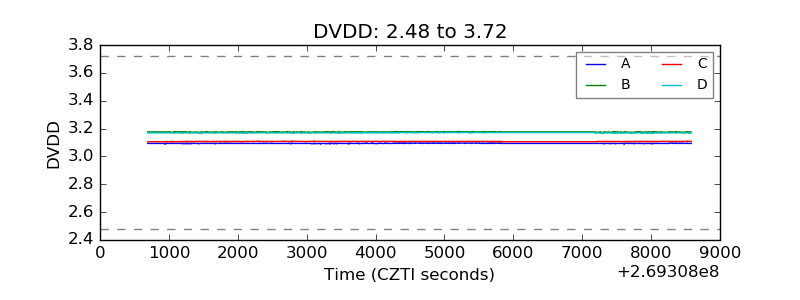 |
| Temperature 1 | 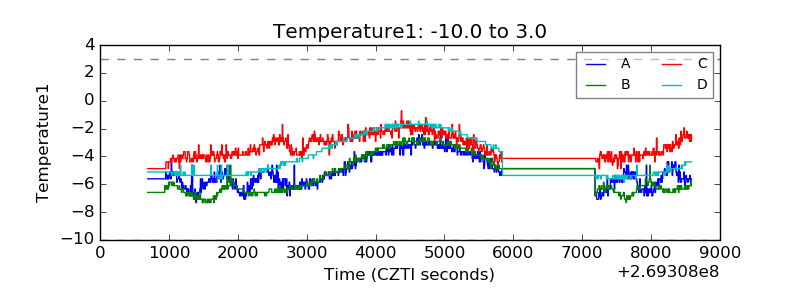 |
| Veto HV Monitor | 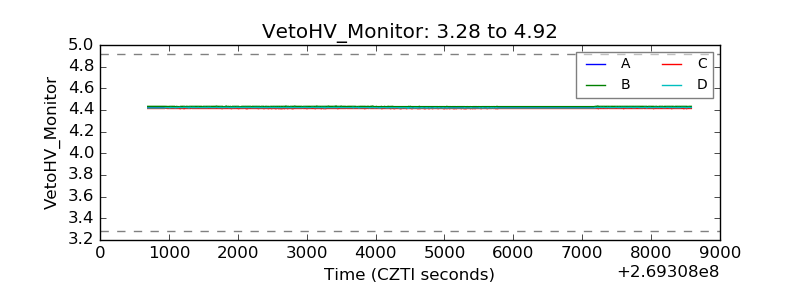 |
| Veto LLD | 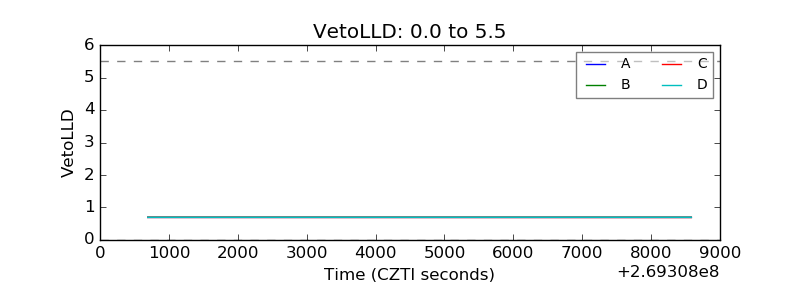 |
| Alpha Counter | 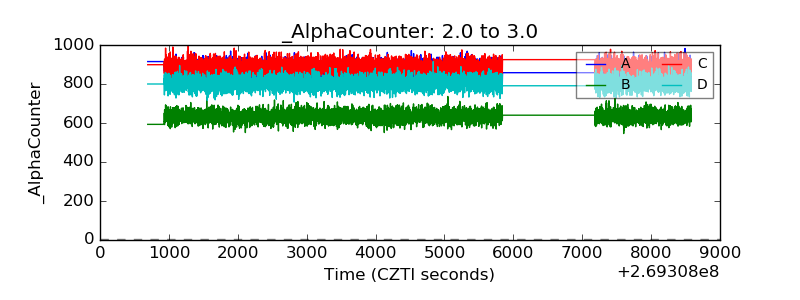 |
| _CPM_Rate | 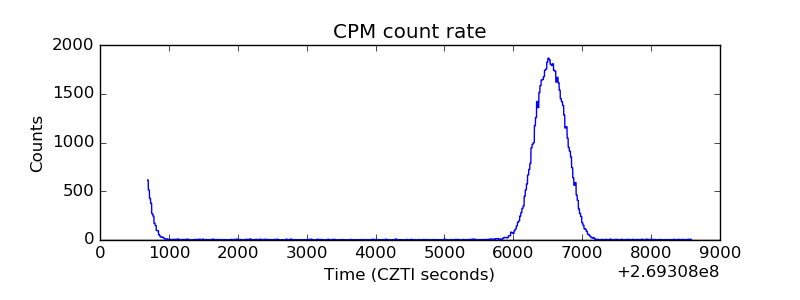 |
| CZT Counter | 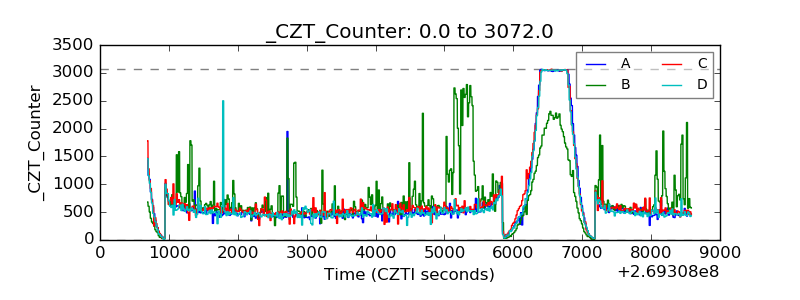 |
| +2.5 Volts monitor |  |
| +5 Volts monitor |  |
| _ROLL_ROT | 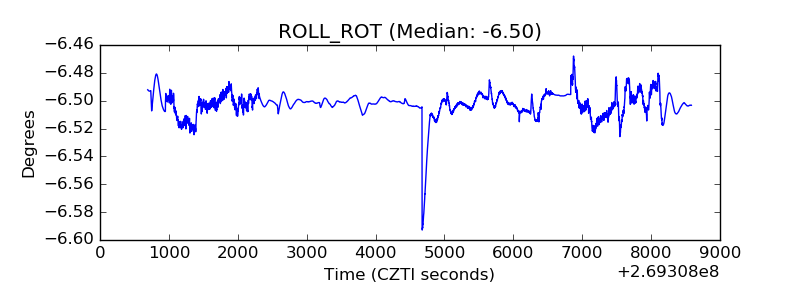 |
| _Roll_DEC | 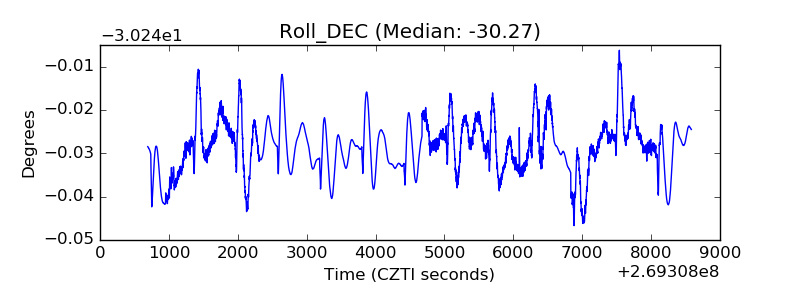 |
| _Roll_RA | 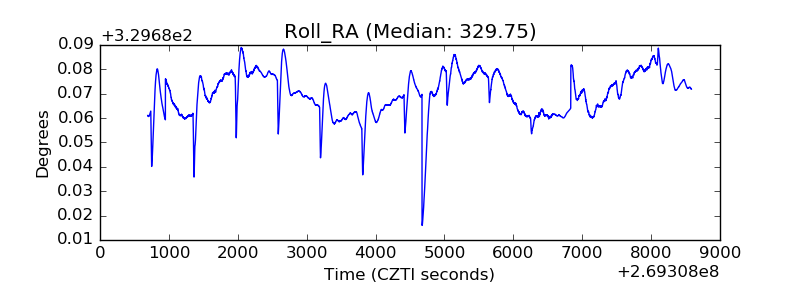 |
| Veto Counter | 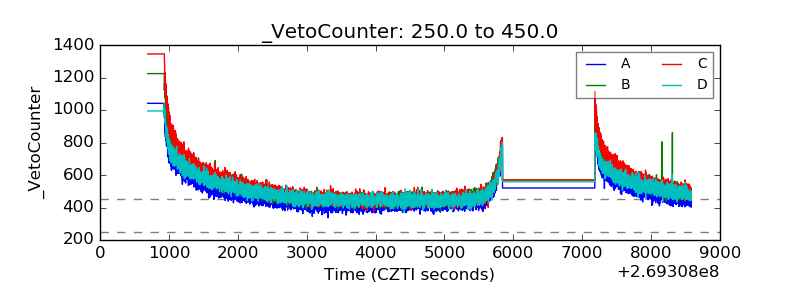 |