| Param | Original file | Final file |
|---|---|---|
| Filename | modeM0/AS1A04_130T03_9000002224_15112cztM0_level2.evt | modeM0/AS1A04_130T03_9000002224_15112cztM0_level2_quad_clean.evt |
| Size (bytes) | 494,801,280 | 94,723,200 |
| Size | 471.9 MB | 90.3 MB |
| Events in quadrant A | 3,198,187 | 614,615 |
| Events in quadrant B | 4,689,900 | 604,900 |
| Events in quadrant C | 3,415,011 | 617,508 |
| Events in quadrant D | 3,252,611 | 589,944 |
| Mode SS | |||
|---|---|---|---|
| Quadrant | BADHDUFLAG | Total packets | Discarded packets |
| A | 0 | 130 | 0 |
| B | 0 | 130 | 0 |
| C | 0 | 130 | 0 |
| D | 0 | 130 | 0 |
| Mode M9 | |||
|---|---|---|---|
| Quadrant | BADHDUFLAG | Total packets | Discarded packets |
| A | 0 | 26 | 0 |
| B | 0 | 26 | 0 |
| C | 0 | 26 | 0 |
| D | 0 | 26 | 0 |
| Mode M0 | |||
|---|---|---|---|
| Quadrant | BADHDUFLAG | Total packets | Discarded packets |
| A | 0 | 13302 | 3 |
| B | 0 | 18144 | 2 |
| C | 0 | 13673 | 2 |
| D | 0 | 13687 | 2 |
| Quadrant | Total seconds | Saturated seconds | Saturation percentage |
|---|---|---|---|
| A | 6329 | 46 | 0.726813% |
| B | 6329 | 369 | 5.830305% |
| C | 6329 | 43 | 0.679412% |
| D | 6329 | 34 | 0.537210% |
Noise dominated data is calculated using 1-second bins in cleaned event files. If a bin has >2000 counts, and if more than 50% of those come from <1% of pixels, then it is considered to be noise-dominated and hence unusable.
| Quadrant | # 1 sec bins | Bins with >0 counts | Bins with >2000 counts | High rate bins dominated by noise | Noise dominated (total time) | Noise dominated (detector-on time) | Marked lightcurve |
|---|---|---|---|---|---|---|---|
| A | 8950 | 6332 | 1 | 1 | 0.01% | 0.02% | 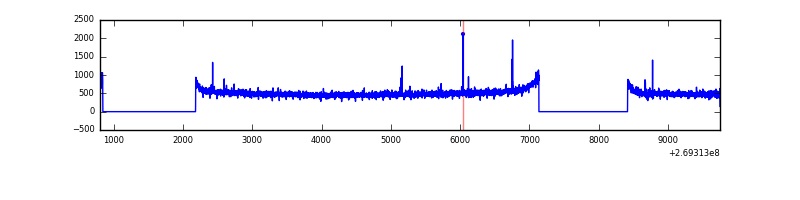 |
| B | 8950 | 6331 | 168 | 168 | 1.88% | 2.65% | 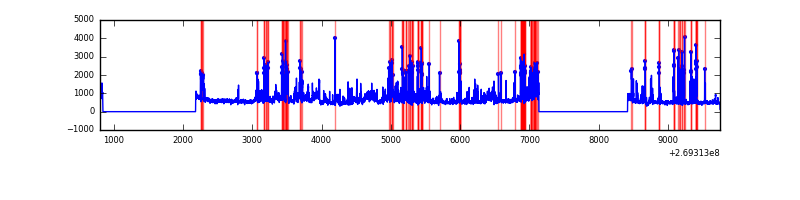 |
| C | 8950 | 6332 | 0 | 0 | 0.00% | 0.00% | 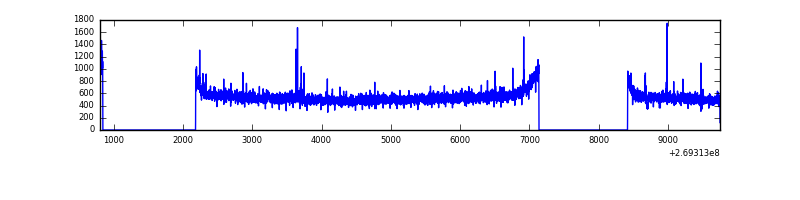 |
| D | 8950 | 6332 | 10 | 10 | 0.11% | 0.16% | 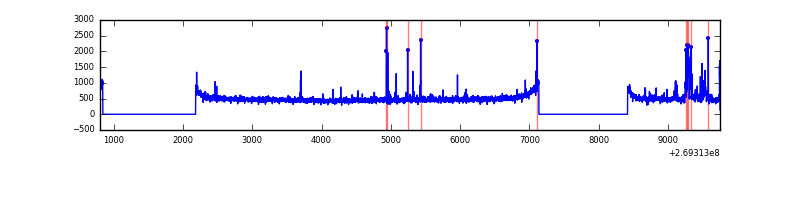 |
Top three noisy pixels from each quadrant. If the there are fewer than three noisy pixels in the level2.evt file, extra rows are filled as -1
| Pixel properties | Quadrant properties | ||||||
|---|---|---|---|---|---|---|---|
| Quadrant | DetID | PixID | Counts | Sigma | Mean | Median | Sigma |
| A | 9 | 143 | 15723 | 91.02 | 823 | 806 | 163.9 |
| A | 15 | 239 | 10247 | 57.61 | 823 | 806 | 163.9 |
| A | 12 | 189 | 8381 | 46.22 | 823 | 806 | 163.9 |
| B | 10 | 245 | 923742 | 6089.74 | 803 | 783 | 151.6 |
| B | 3 | 64 | 567058 | 3736.32 | 803 | 783 | 151.6 |
| B | 0 | 229 | 44649 | 289.43 | 803 | 783 | 151.6 |
| C | 3 | 233 | 220978 | 1184.37 | 810 | 817 | 185.9 |
| C | 4 | 254 | 31440 | 164.74 | 810 | 817 | 185.9 |
| C | 13 | 61 | 5620 | 25.84 | 810 | 817 | 185.9 |
| D | 2 | 14 | 132876 | 672.76 | 810 | 788 | 196.3 |
| D | 10 | 70 | 27160 | 134.32 | 810 | 788 | 196.3 |
| D | 2 | 234 | 23709 | 116.74 | 810 | 788 | 196.3 |
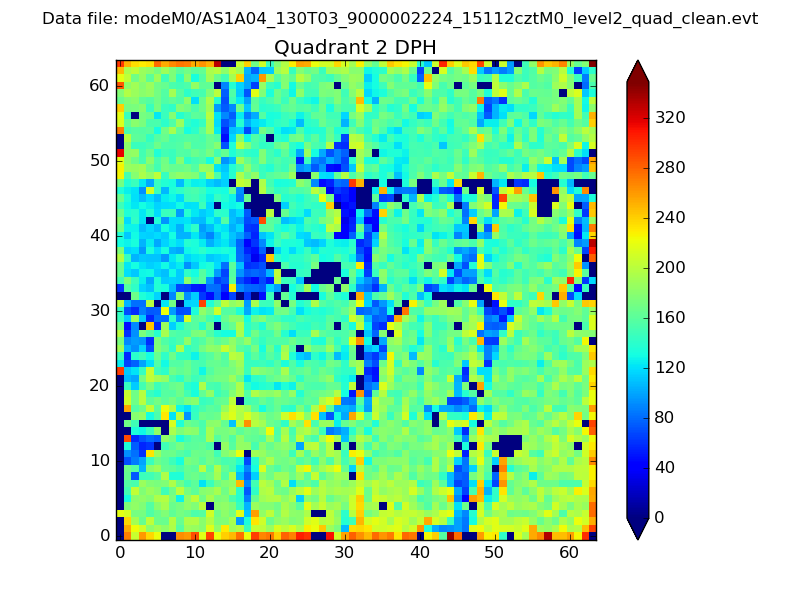
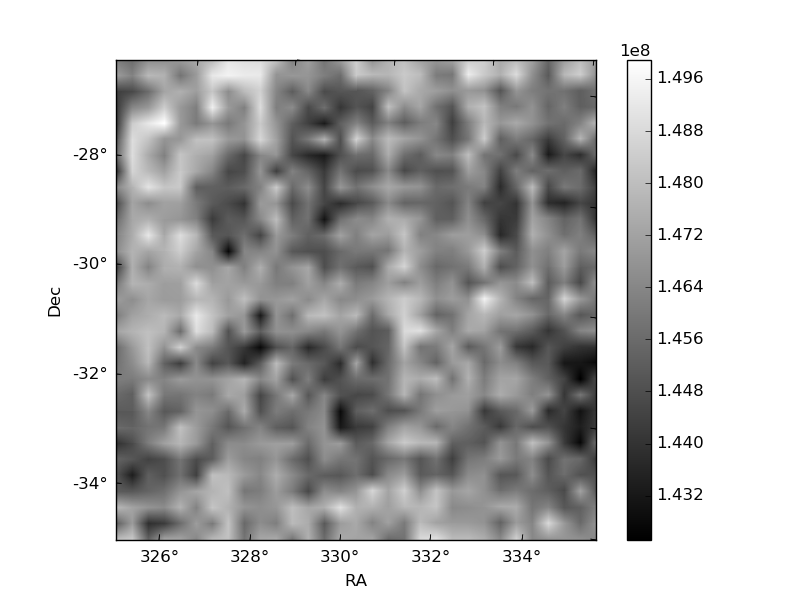
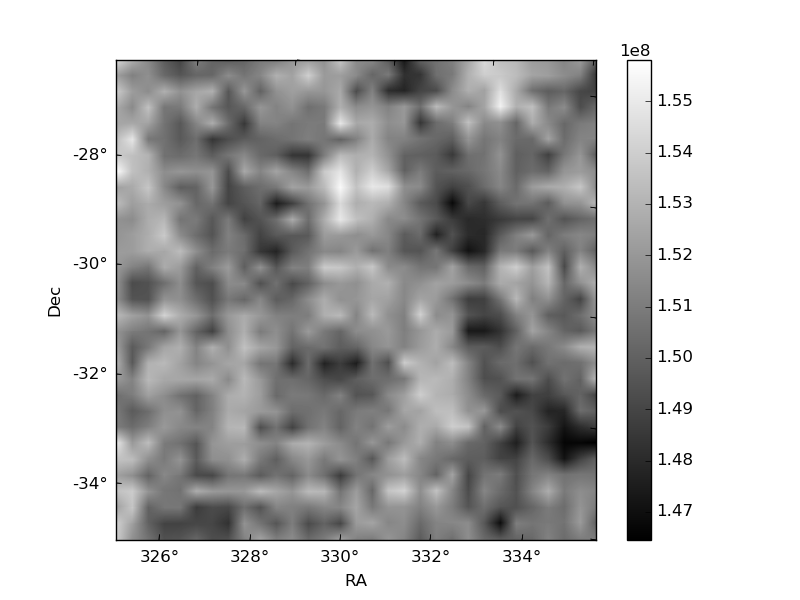
Histogram calculated using DETX and DETY for each event in the final _common_clean file
| Quadrant A | 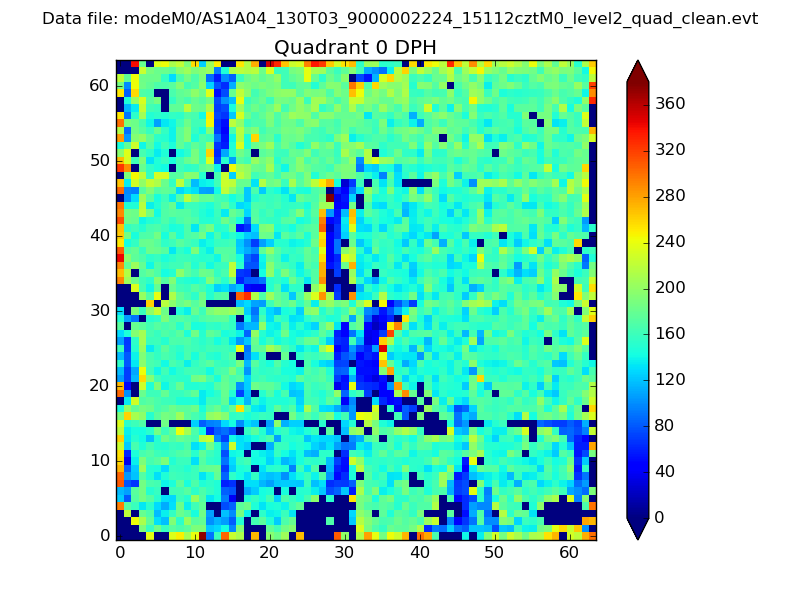 |
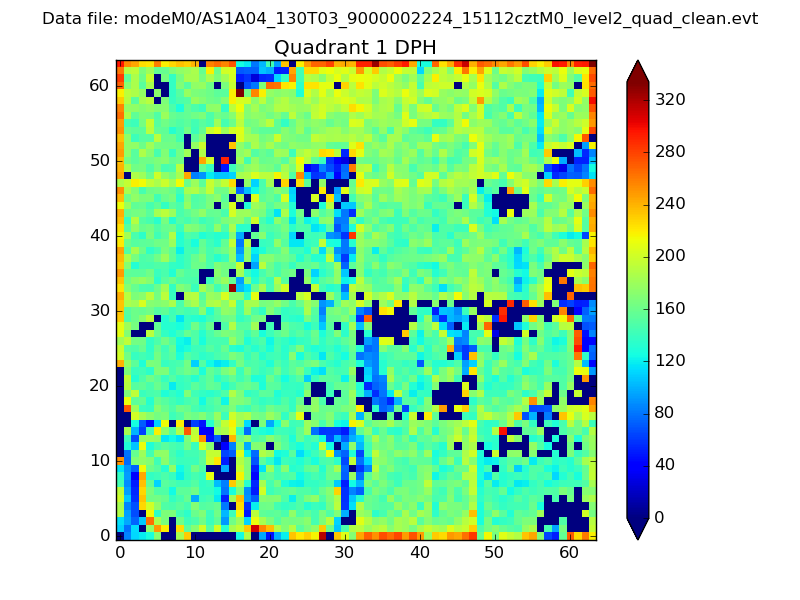 |
Quadrant B |
|---|---|---|---|
| Quadrant D | 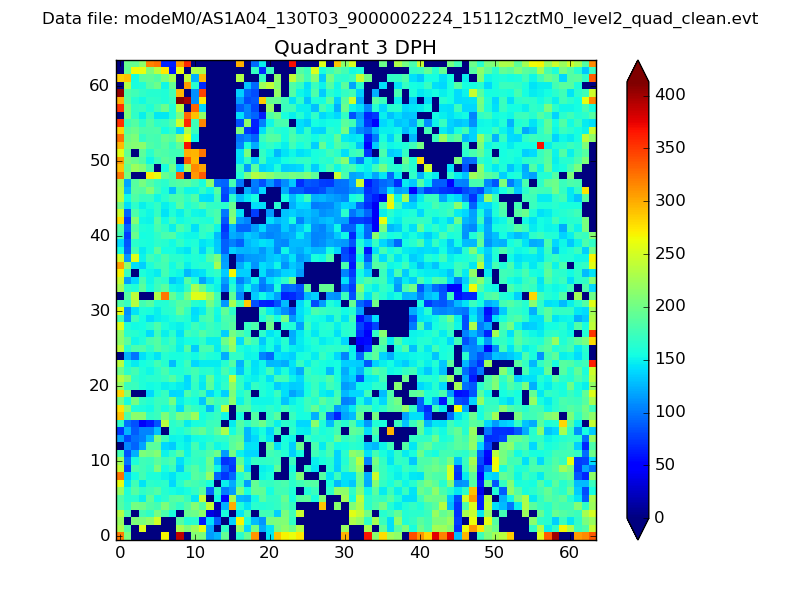 |
 |
Quadrant C |
| Plot type | Count rate plots | Images |
|---|---|---|
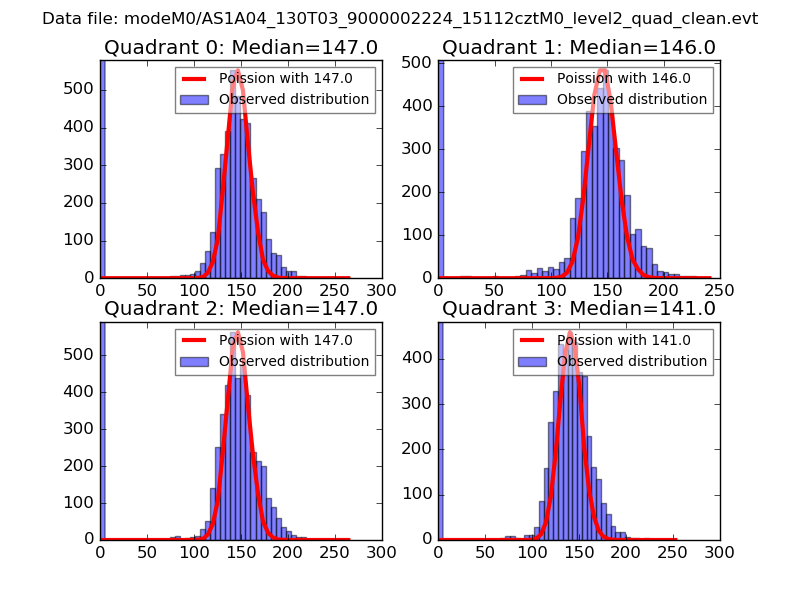
| Comparison with Poisson distribution Blue bars denote a histogram of data divided into 1 sec bins. Red curve is a Poisson curve with rate = median count rate of data. |
 |
 |
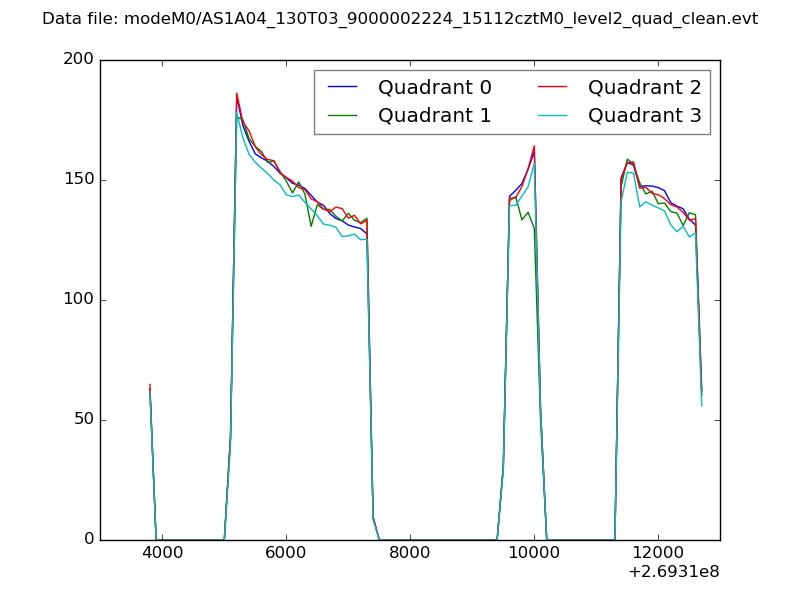
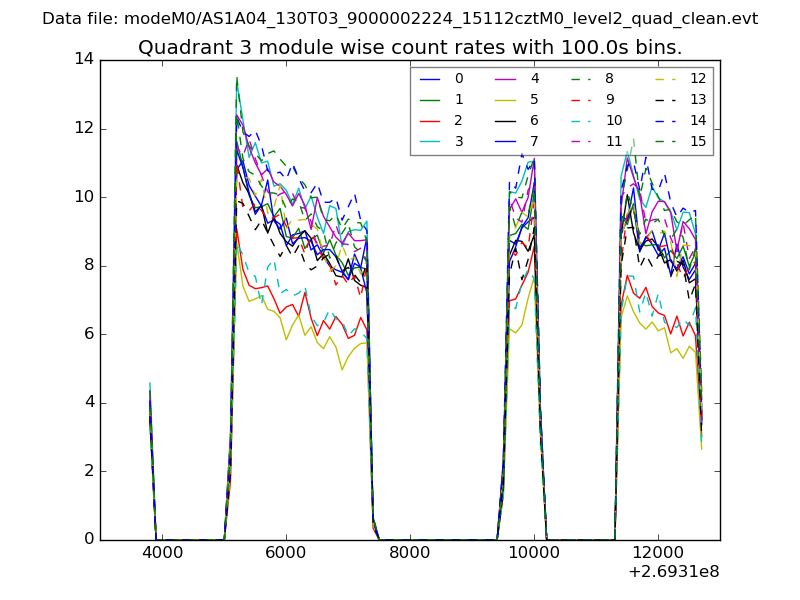
| Quadrant-wise count rates Data is divided into 100 sec bins |
 |
|
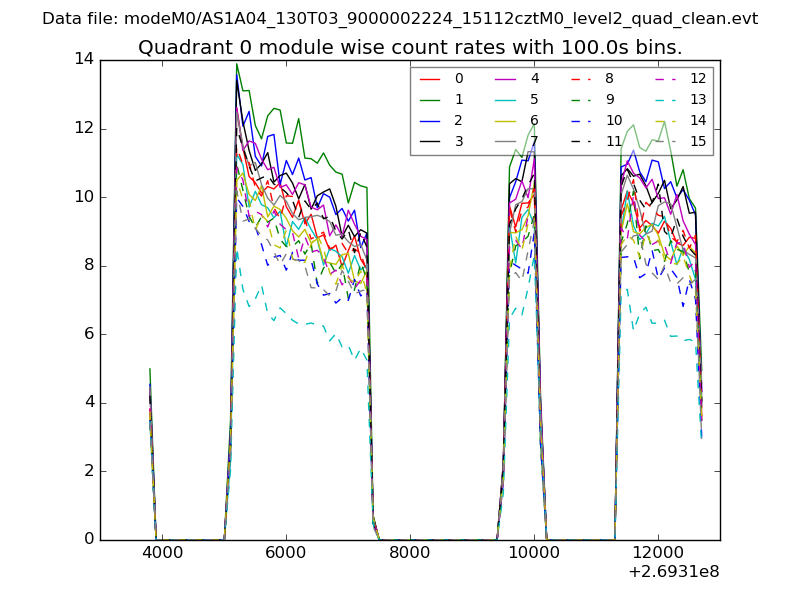
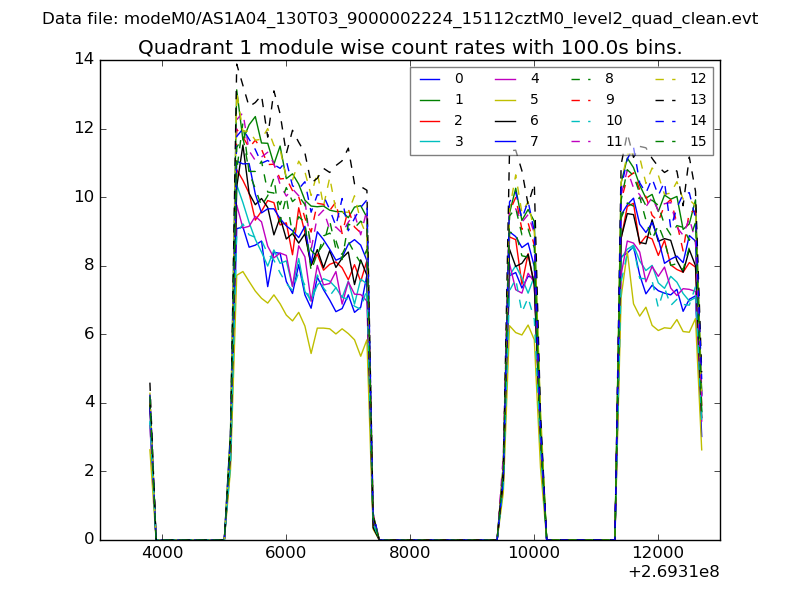
| Module-wise count rates for Quadrant A Data is divided into 100 sec bins |
 |
 |
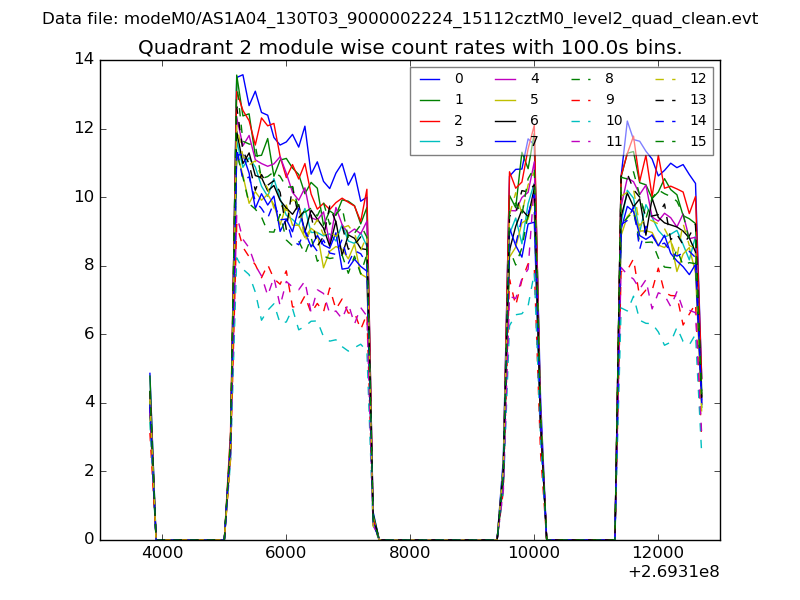
| Module-wise count rates for Quadrant B Data is divided into 100 sec bins |
 |
 |
| Module-wise count rates for Quadrant C Data is divided into 100 sec bins |
 |
 |
| Module-wise count rates for Quadrant D Data is divided into 100 sec bins |
 |
 |
| Parameter | Plot |
|---|---|
| CZT HV Monitor | 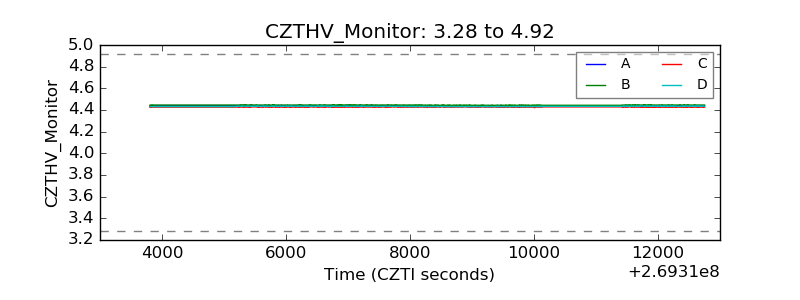 |
| D_VDD | 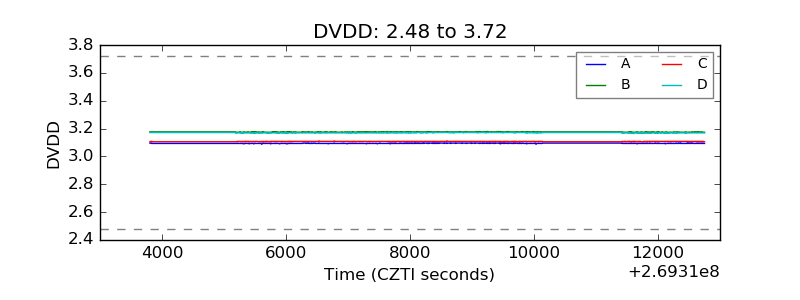 |
| Temperature 1 | 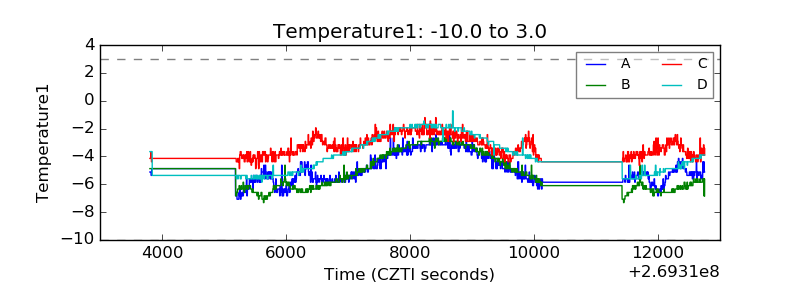 |
| Veto HV Monitor | 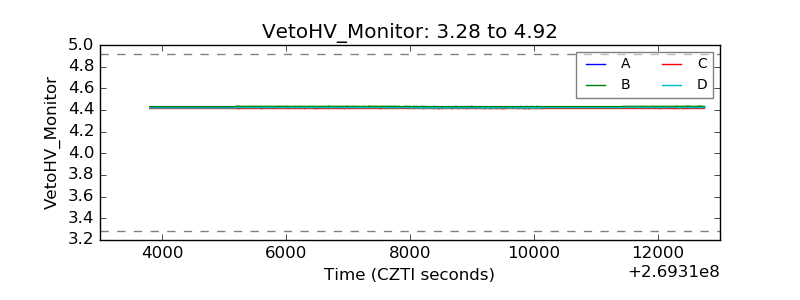 |
| Veto LLD | 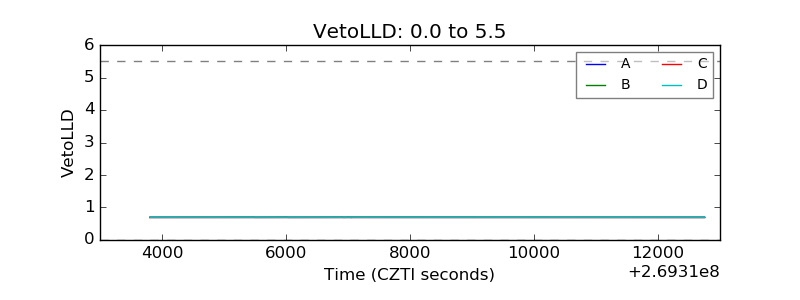 |
| Alpha Counter | 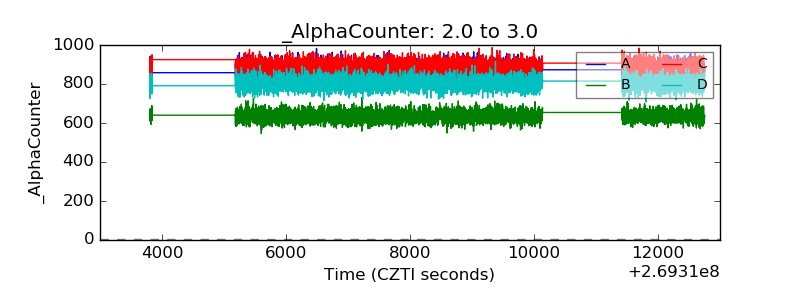 |
| _CPM_Rate | 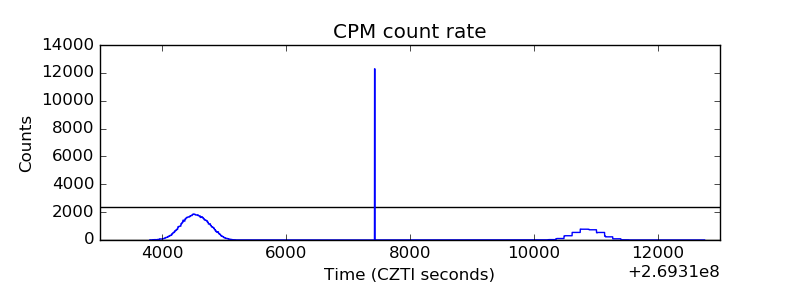 |
| CZT Counter | 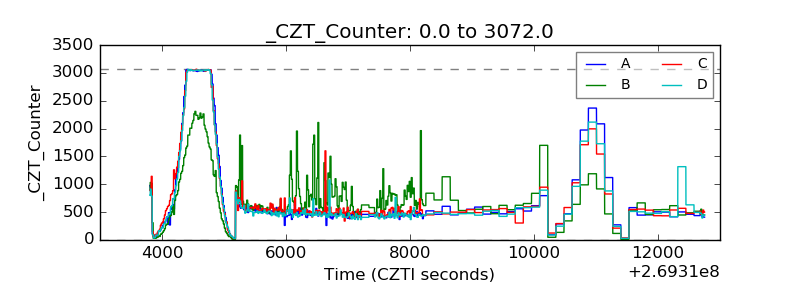 |
| +2.5 Volts monitor |  |
| +5 Volts monitor |  |
| _ROLL_ROT | 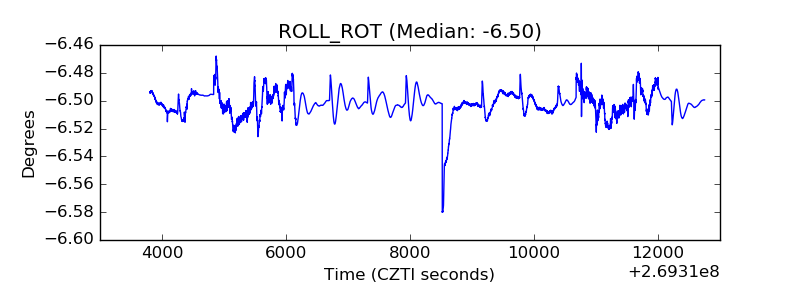 |
| _Roll_DEC | 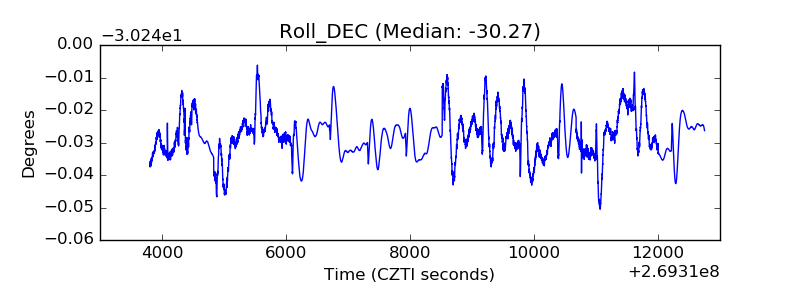 |
| _Roll_RA | 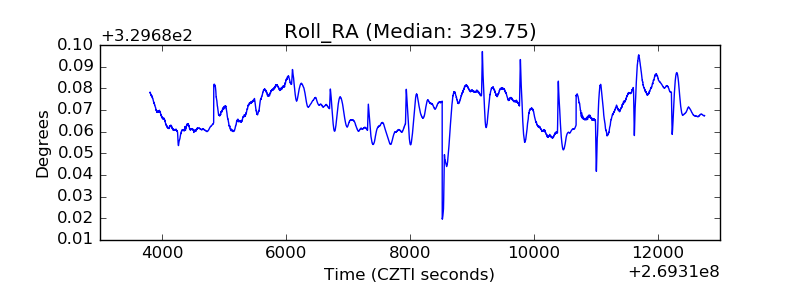 |
| Veto Counter | 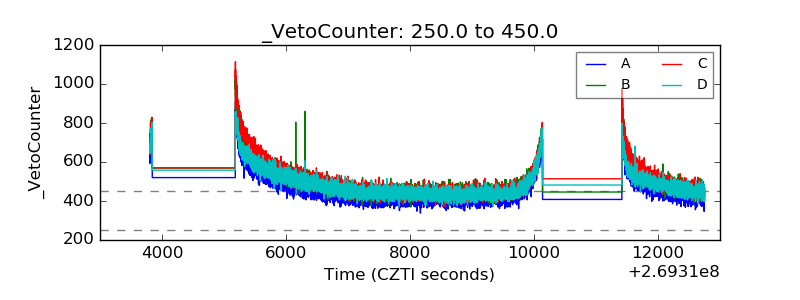 |