| Param | Original file | Final file |
|---|---|---|
| Filename | modeM0/AS1A04_130T03_9000002224_15115cztM0_level2.evt | modeM0/AS1A04_130T03_9000002224_15115cztM0_level2_quad_clean.evt |
| Size (bytes) | 660,216,960 | 102,263,040 |
| Size | 629.6 MB | 97.5 MB |
| Events in quadrant A | 4,190,466 | 633,270 |
| Events in quadrant B | 5,801,778 | 638,984 |
| Events in quadrant C | 5,297,096 | 634,502 |
| Events in quadrant D | 4,147,598 | 617,933 |
| Mode SS | |||
|---|---|---|---|
| Quadrant | BADHDUFLAG | Total packets | Discarded packets |
| A | 0 | 166 | 0 |
| B | 0 | 166 | 0 |
| C | 0 | 166 | 0 |
| D | 0 | 166 | 0 |
| Mode M9 | |||
|---|---|---|---|
| Quadrant | BADHDUFLAG | Total packets | Discarded packets |
| A | 0 | 6 | 0 |
| B | 0 | 6 | 0 |
| C | 0 | 6 | 0 |
| D | 0 | 6 | 0 |
| Mode M0 | |||
|---|---|---|---|
| Quadrant | BADHDUFLAG | Total packets | Discarded packets |
| A | 0 | 17830 | 3 |
| B | 0 | 22480 | 2 |
| C | 0 | 20736 | 2 |
| D | 0 | 18027 | 2 |
| Quadrant | Total seconds | Saturated seconds | Saturation percentage |
|---|---|---|---|
| A | 8226 | 485 | 5.895940% |
| B | 8226 | 992 | 12.059324% |
| C | 8226 | 519 | 6.309263% |
| D | 8226 | 401 | 4.874787% |
Noise dominated data is calculated using 1-second bins in cleaned event files. If a bin has >2000 counts, and if more than 50% of those come from <1% of pixels, then it is considered to be noise-dominated and hence unusable.
| Quadrant | # 1 sec bins | Bins with >0 counts | Bins with >2000 counts | High rate bins dominated by noise | Noise dominated (total time) | Noise dominated (detector-on time) | Marked lightcurve |
|---|---|---|---|---|---|---|---|
| A | 8832 | 8228 | 13 | 13 | 0.15% | 0.16% | 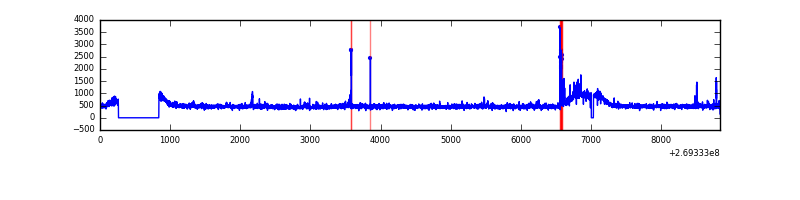 |
| B | 8832 | 8227 | 442 | 442 | 5.00% | 5.37% | 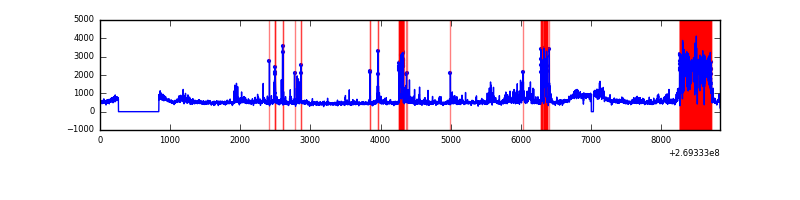 |
| C | 8832 | 8229 | 89 | 89 | 1.01% | 1.08% | 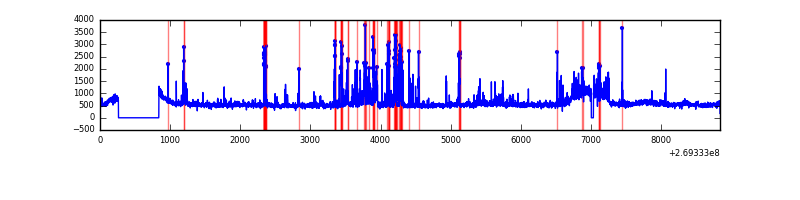 |
| D | 8832 | 8228 | 15 | 15 | 0.17% | 0.18% | 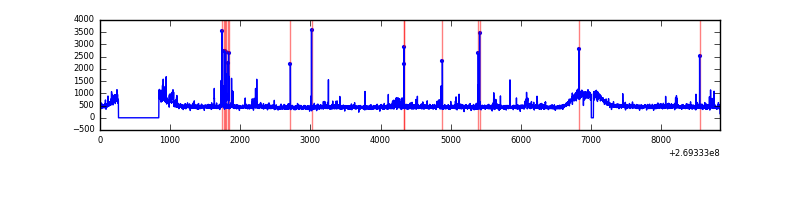 |
Top three noisy pixels from each quadrant. If the there are fewer than three noisy pixels in the level2.evt file, extra rows are filled as -1
| Pixel properties | Quadrant properties | ||||||
|---|---|---|---|---|---|---|---|
| Quadrant | DetID | PixID | Counts | Sigma | Mean | Median | Sigma |
| A | 12 | 189 | 82895 | 384.13 | 1036 | 1008 | 213.2 |
| A | 15 | 69 | 79230 | 366.94 | 1036 | 1008 | 213.2 |
| A | 13 | 248 | 26443 | 119.31 | 1036 | 1008 | 213.2 |
| B | 10 | 245 | 1433751 | 7295.35 | 1006 | 979 | 196.4 |
| B | 3 | 64 | 281237 | 1427.01 | 1006 | 979 | 196.4 |
| B | 0 | 229 | 55168 | 275.92 | 1006 | 979 | 196.4 |
| C | 4 | 254 | 751561 | 3191.69 | 1010 | 1012 | 235.2 |
| C | 3 | 233 | 583449 | 2476.8 | 1010 | 1012 | 235.2 |
| C | 7 | 247 | 9060 | 34.22 | 1010 | 1012 | 235.2 |
| D | 2 | 14 | 107545 | 423.25 | 1027 | 996 | 251.7 |
| D | 2 | 152 | 44065 | 171.09 | 1027 | 996 | 251.7 |
| D | 2 | 234 | 34028 | 131.21 | 1027 | 996 | 251.7 |
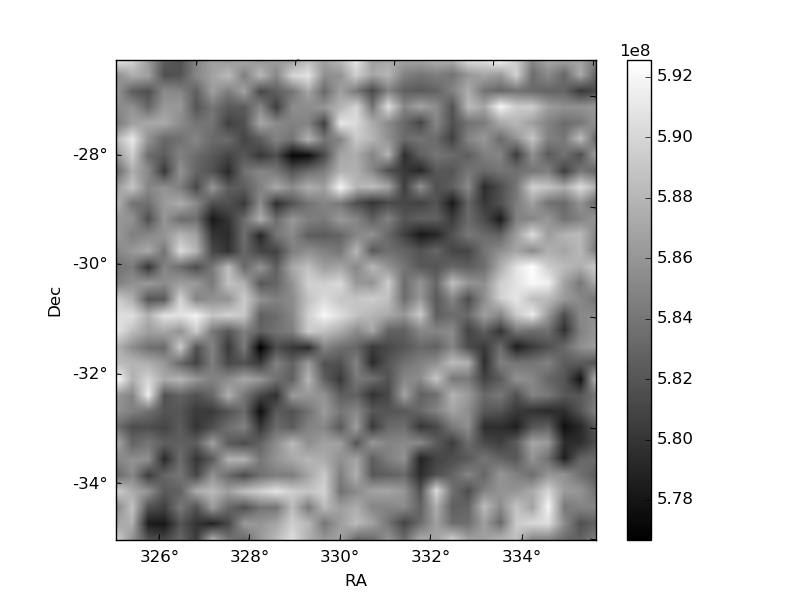
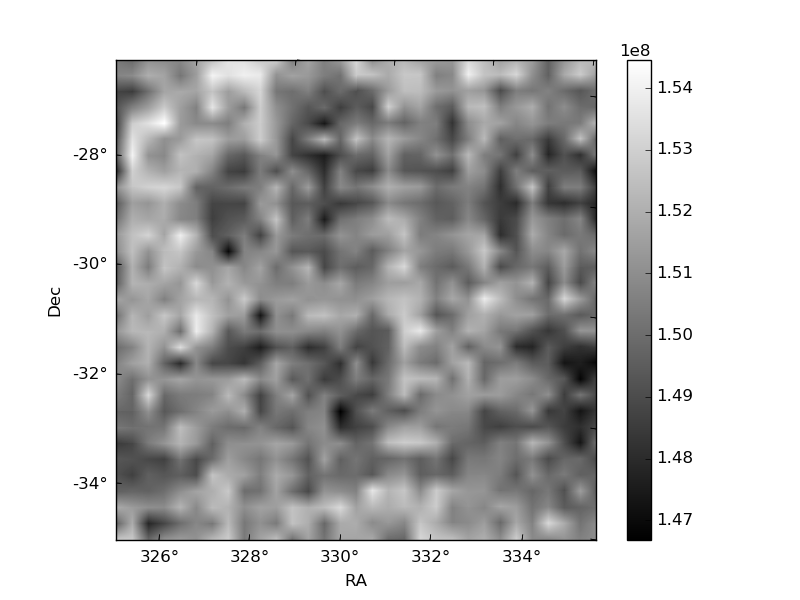
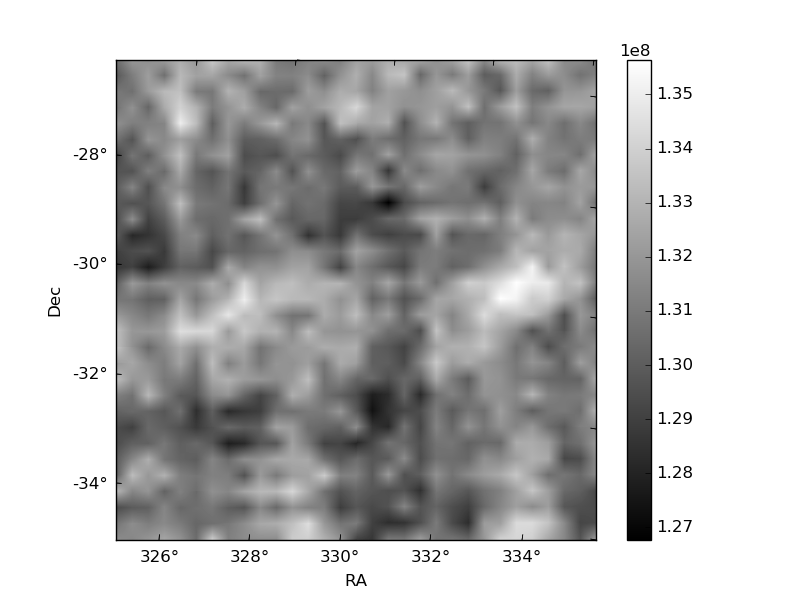
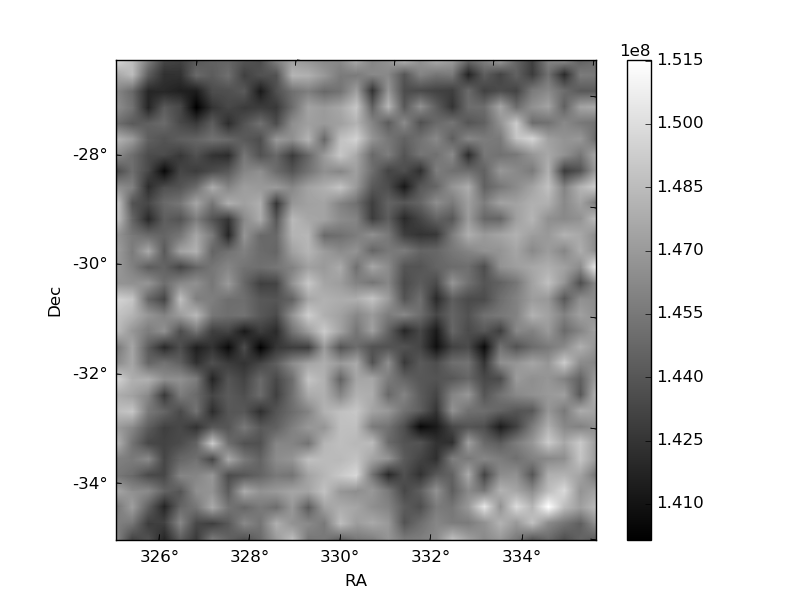
Histogram calculated using DETX and DETY for each event in the final _common_clean file
| Quadrant A | 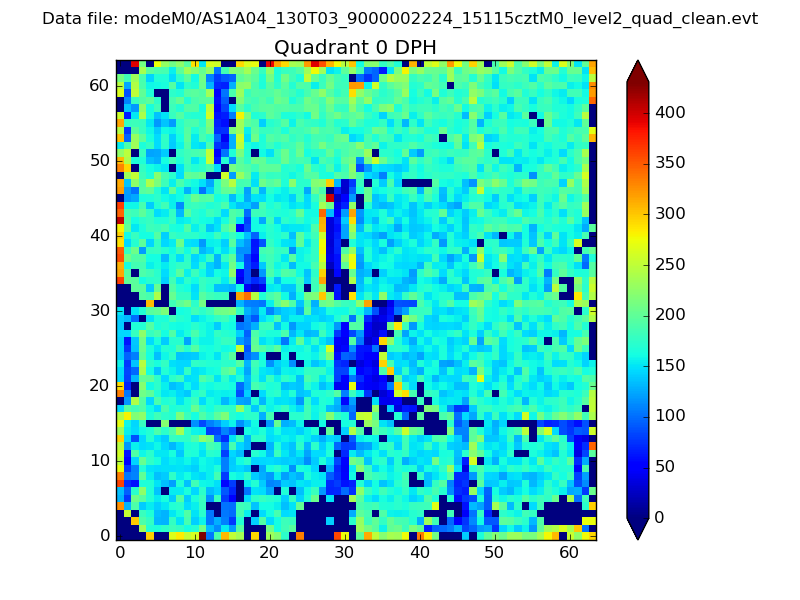 |
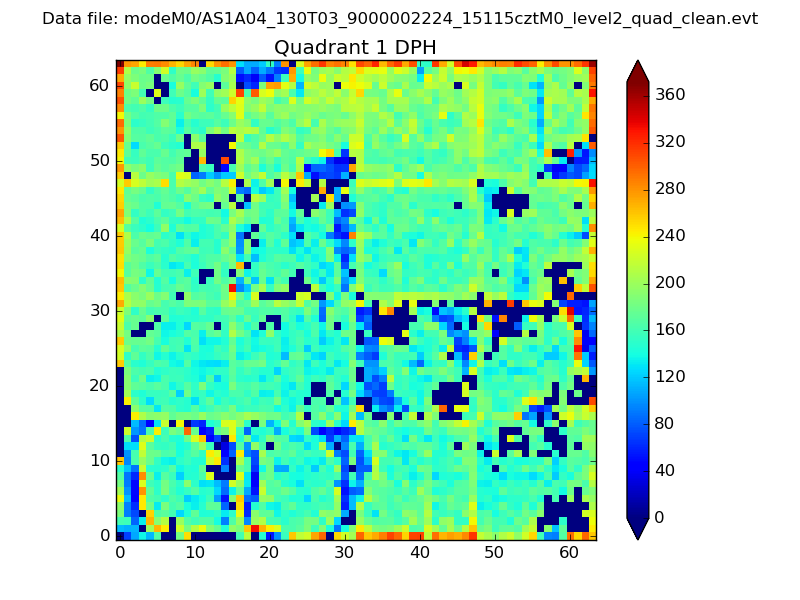 |
Quadrant B |
|---|---|---|---|
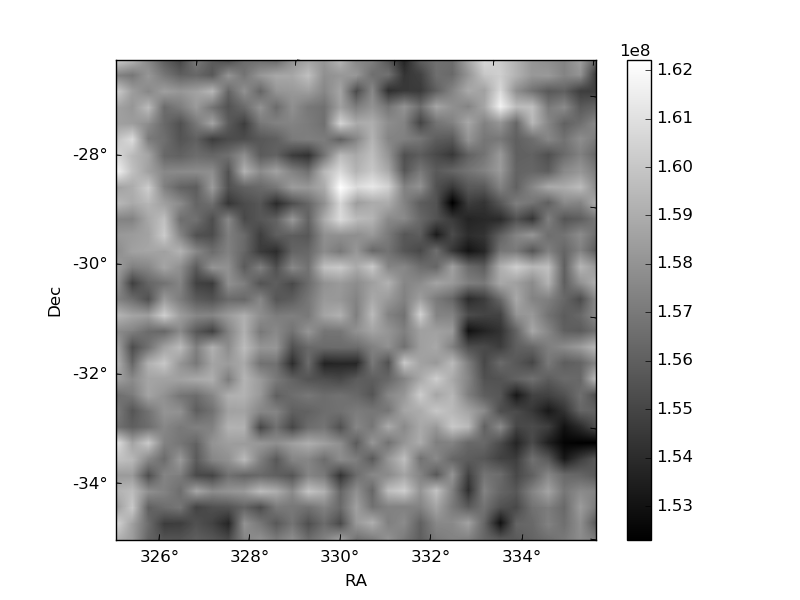
| Quadrant D | 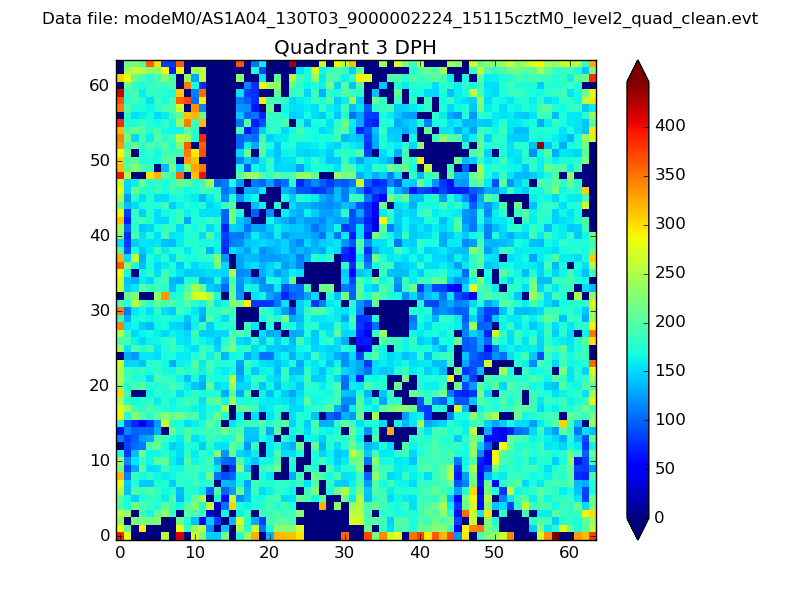 |
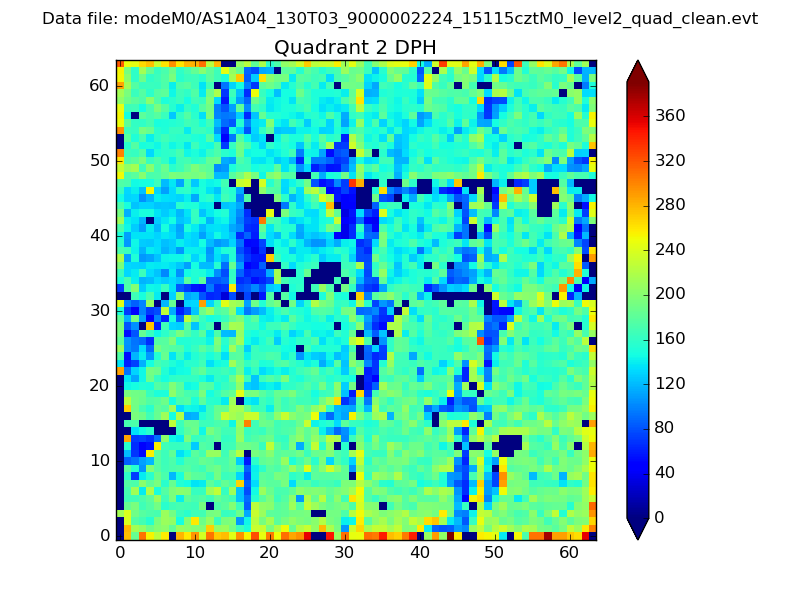 |
Quadrant C |
| Plot type | Count rate plots | Images |
|---|---|---|
| Comparison with Poisson distribution Blue bars denote a histogram of data divided into 1 sec bins. Red curve is a Poisson curve with rate = median count rate of data. |
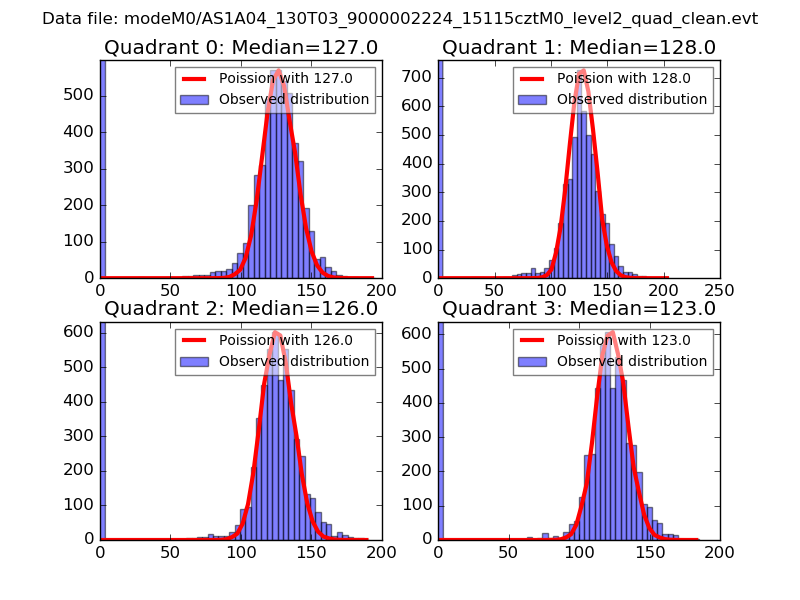 |
 |
| Quadrant-wise count rates Data is divided into 100 sec bins |
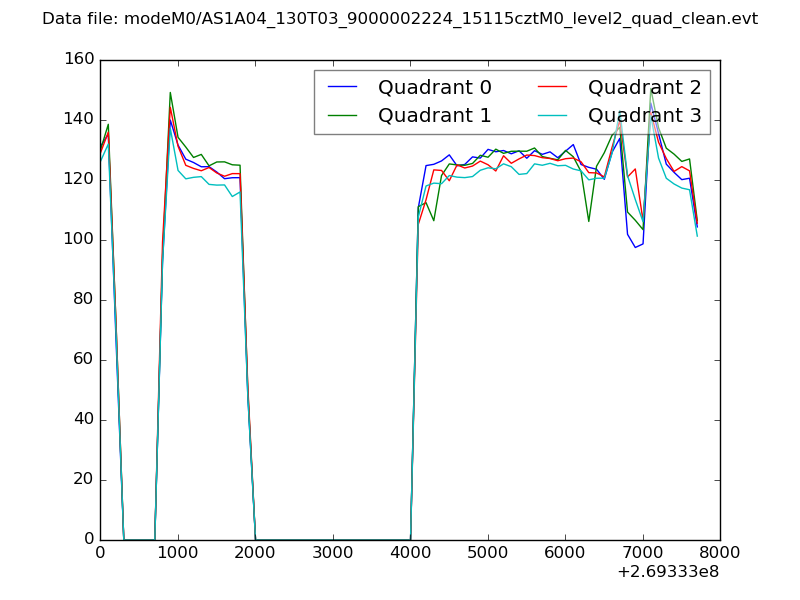 |
|
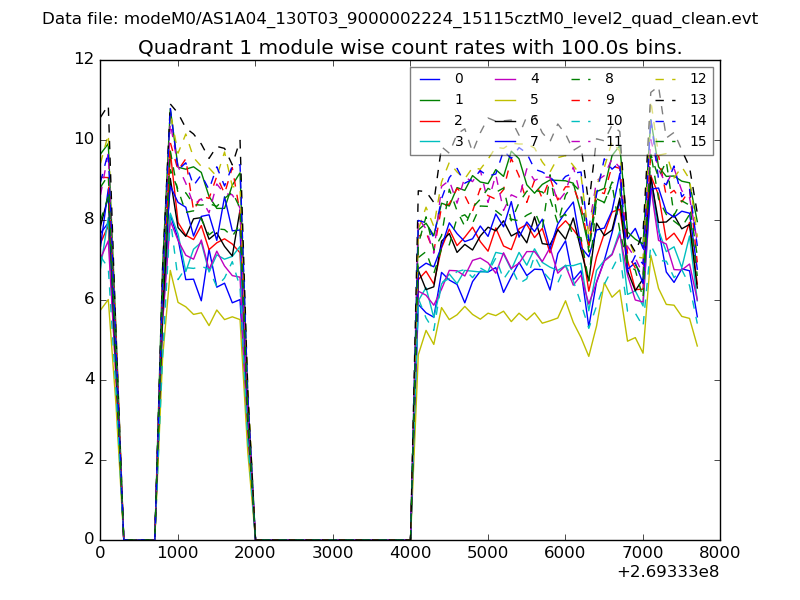
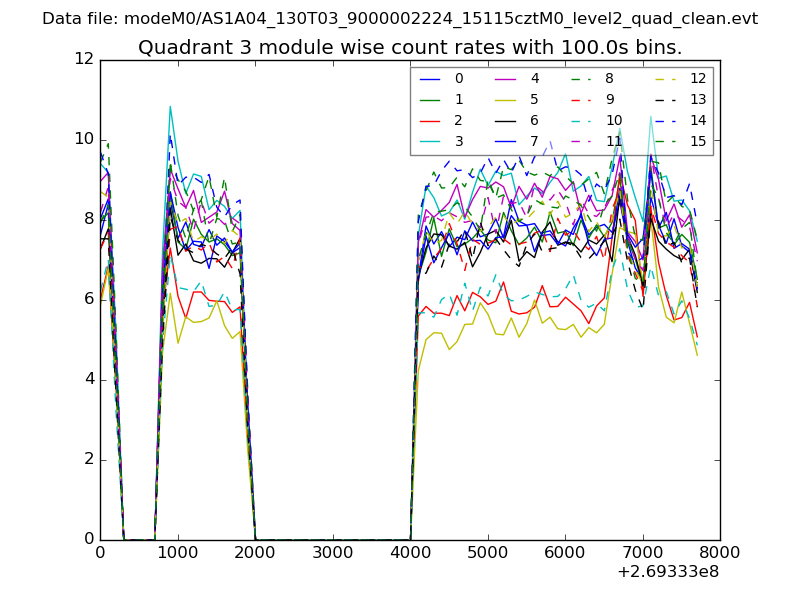
| Module-wise count rates for Quadrant A Data is divided into 100 sec bins |
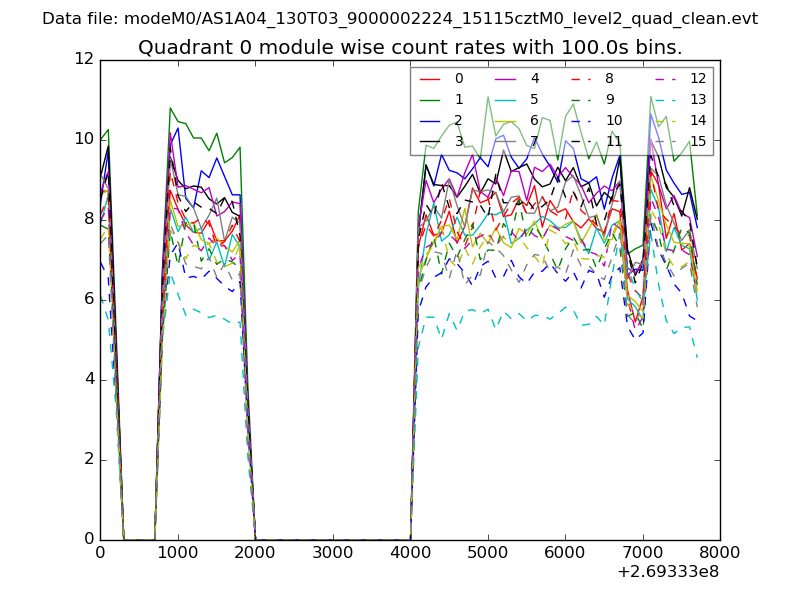 |
 |
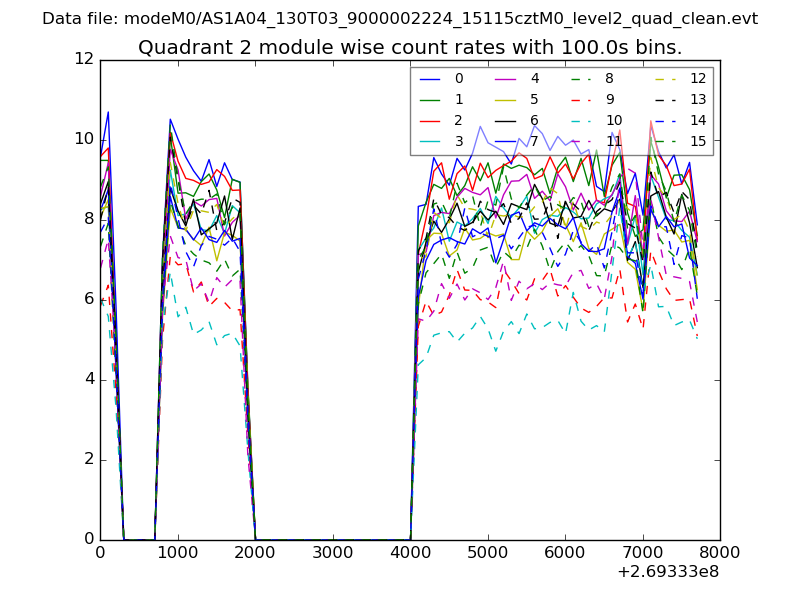
| Module-wise count rates for Quadrant B Data is divided into 100 sec bins |
 |
 |
| Module-wise count rates for Quadrant C Data is divided into 100 sec bins |
 |
 |
| Module-wise count rates for Quadrant D Data is divided into 100 sec bins |
 |
 |
| Parameter | Plot |
|---|---|
| CZT HV Monitor | 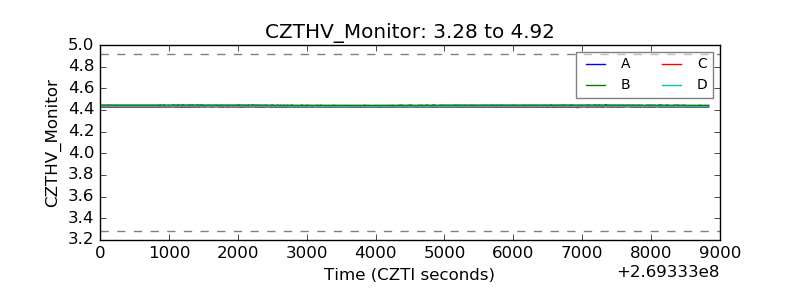 |
| D_VDD | 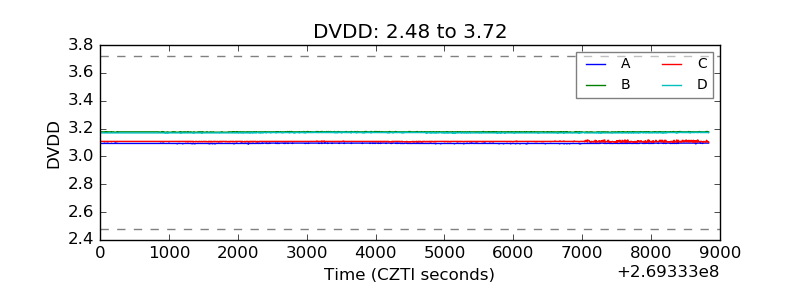 |
| Temperature 1 |  |
| Veto HV Monitor | 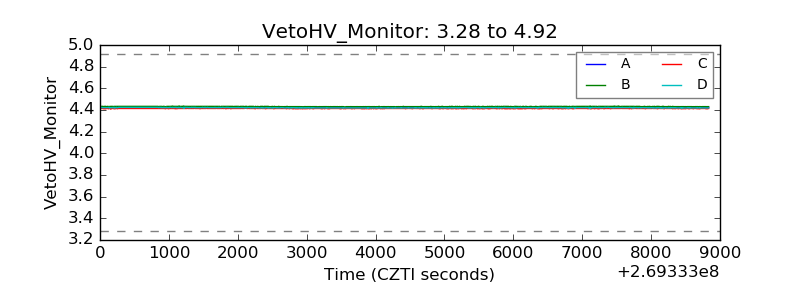 |
| Veto LLD | 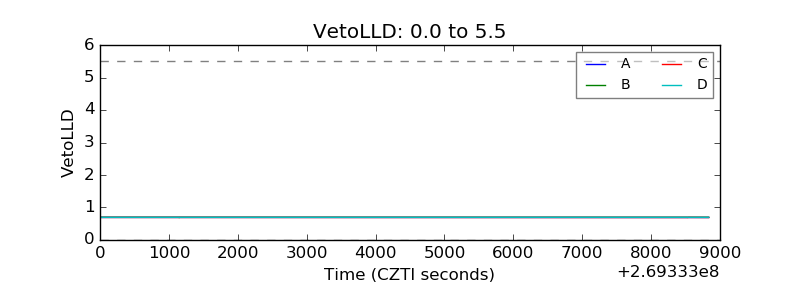 |
| Alpha Counter | 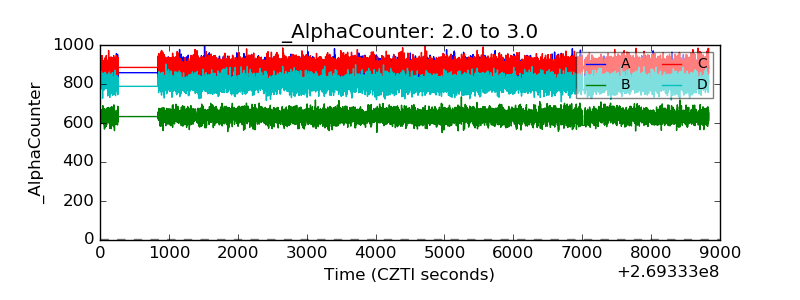 |
| _CPM_Rate | 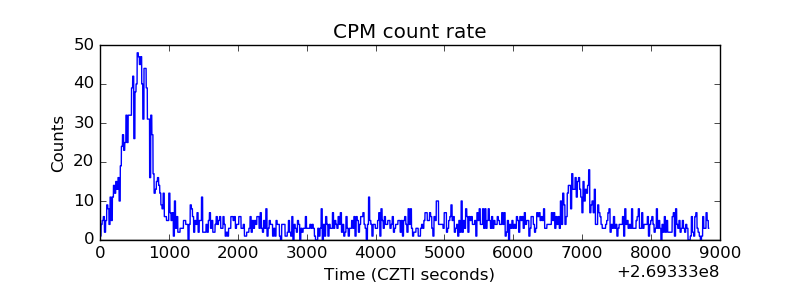 |
| CZT Counter | 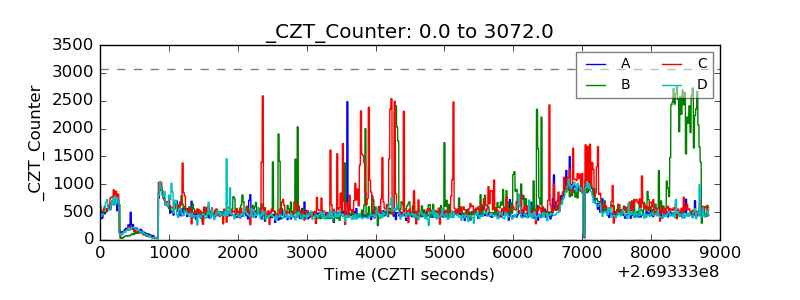 |
| +2.5 Volts monitor | 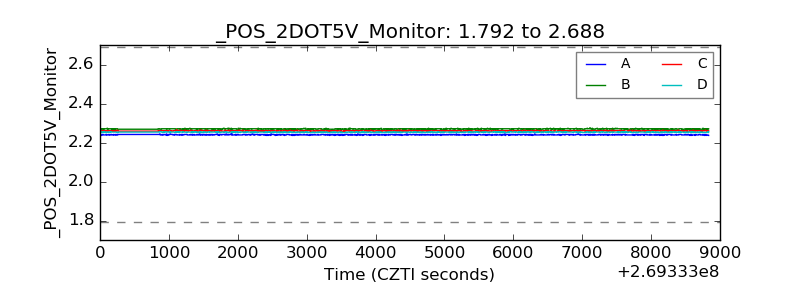 |
| +5 Volts monitor |  |
| _ROLL_ROT | 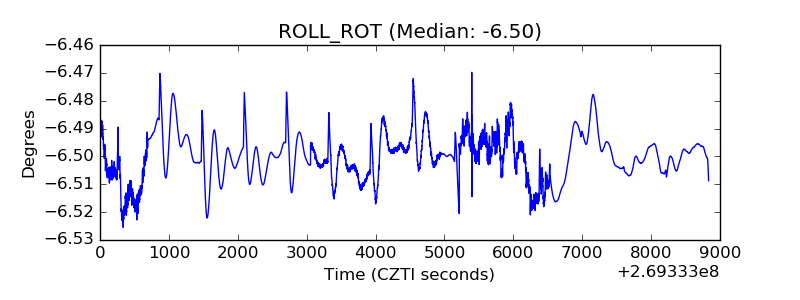 |
| _Roll_DEC |  |
| _Roll_RA | 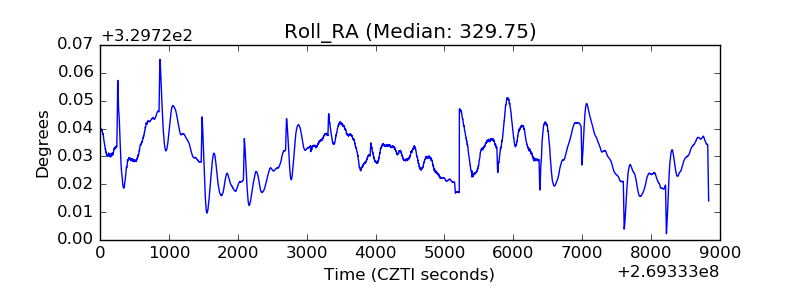 |
| Veto Counter | 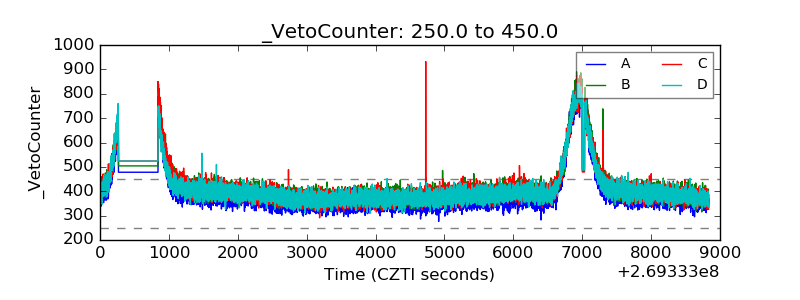 |