| Param | Original file | Final file |
|---|---|---|
| Filename | modeM0/AS1A04_130T03_9000002224_15116cztM0_level2.evt | modeM0/AS1A04_130T03_9000002224_15116cztM0_level2_quad_clean.evt |
| Size (bytes) | 318,787,200 | 38,027,520 |
| Size | 304.0 MB | 36.3 MB |
| Events in quadrant A | 1,935,536 | 219,789 |
| Events in quadrant B | 3,290,725 | 220,399 |
| Events in quadrant C | 2,297,091 | 219,965 |
| Events in quadrant D | 1,862,617 | 213,100 |
| Mode SS | |||
|---|---|---|---|
| Quadrant | BADHDUFLAG | Total packets | Discarded packets |
| A | 0 | 80 | 0 |
| B | 0 | 80 | 0 |
| C | 0 | 80 | 0 |
| D | 0 | 80 | 0 |
| Mode M0 | |||
|---|---|---|---|
| Quadrant | BADHDUFLAG | Total packets | Discarded packets |
| A | 0 | 8349 | 1 |
| B | 0 | 12369 | 1 |
| C | 0 | 9174 | 1 |
| D | 0 | 8274 | 1 |
| Quadrant | Total seconds | Saturated seconds | Saturation percentage |
|---|---|---|---|
| A | 3929 | 115 | 2.926953% |
| B | 3929 | 601 | 15.296513% |
| C | 3929 | 106 | 2.697888% |
| D | 3929 | 83 | 2.112497% |
Noise dominated data is calculated using 1-second bins in cleaned event files. If a bin has >2000 counts, and if more than 50% of those come from <1% of pixels, then it is considered to be noise-dominated and hence unusable.
| Quadrant | # 1 sec bins | Bins with >0 counts | Bins with >2000 counts | High rate bins dominated by noise | Noise dominated (total time) | Noise dominated (detector-on time) | Marked lightcurve |
|---|---|---|---|---|---|---|---|
| A | 3960 | 3931 | 6 | 6 | 0.15% | 0.15% | 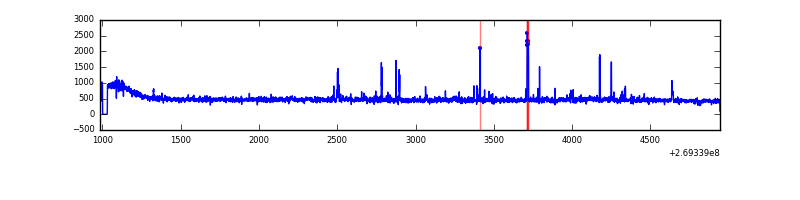 |
| B | 3960 | 3930 | 416 | 416 | 10.51% | 10.59% | 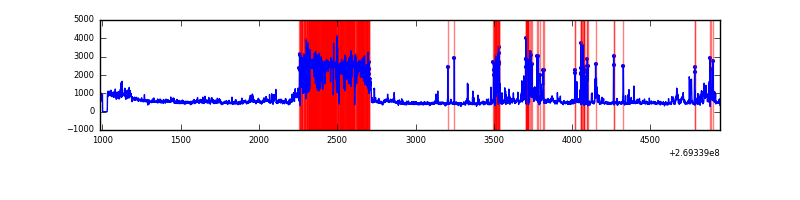 |
| C | 3960 | 3931 | 5 | 5 | 0.13% | 0.13% | 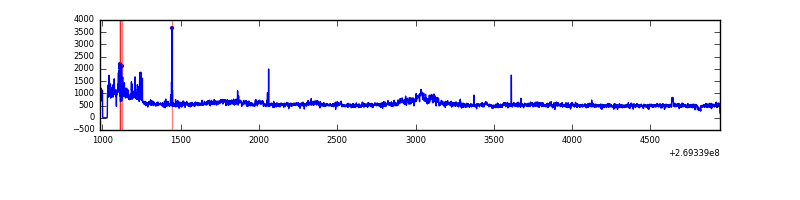 |
| D | 3960 | 3931 | 9 | 9 | 0.23% | 0.23% | 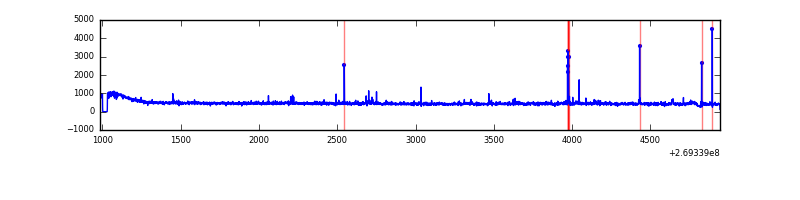 |
Top three noisy pixels from each quadrant. If the there are fewer than three noisy pixels in the level2.evt file, extra rows are filled as -1
| Pixel properties | Quadrant properties | ||||||
|---|---|---|---|---|---|---|---|
| Quadrant | DetID | PixID | Counts | Sigma | Mean | Median | Sigma |
| A | 13 | 248 | 47908 | 474.91 | 478 | 468 | 99.9 |
| A | 12 | 189 | 13617 | 131.63 | 478 | 468 | 99.9 |
| A | 9 | 143 | 11237 | 107.81 | 478 | 468 | 99.9 |
| B | 10 | 245 | 1326245 | 15091.38 | 448 | 436 | 87.9 |
| B | 3 | 64 | 93816 | 1062.92 | 448 | 436 | 87.9 |
| B | 0 | 229 | 58191 | 657.41 | 448 | 436 | 87.9 |
| C | 3 | 233 | 420254 | 3864.43 | 461 | 464 | 108.6 |
| C | 4 | 254 | 59151 | 540.25 | 461 | 464 | 108.6 |
| C | 8 | 128 | 7096 | 61.05 | 461 | 464 | 108.6 |
| D | 7 | 38 | 29242 | 250.39 | 468 | 454 | 115.0 |
| D | 2 | 152 | 17873 | 151.5 | 468 | 454 | 115.0 |
| D | 2 | 234 | 17687 | 149.89 | 468 | 454 | 115.0 |
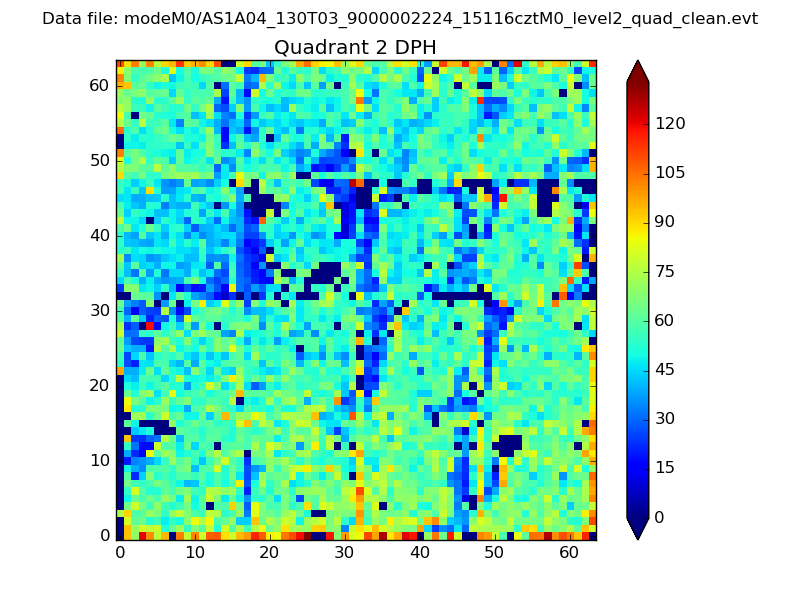
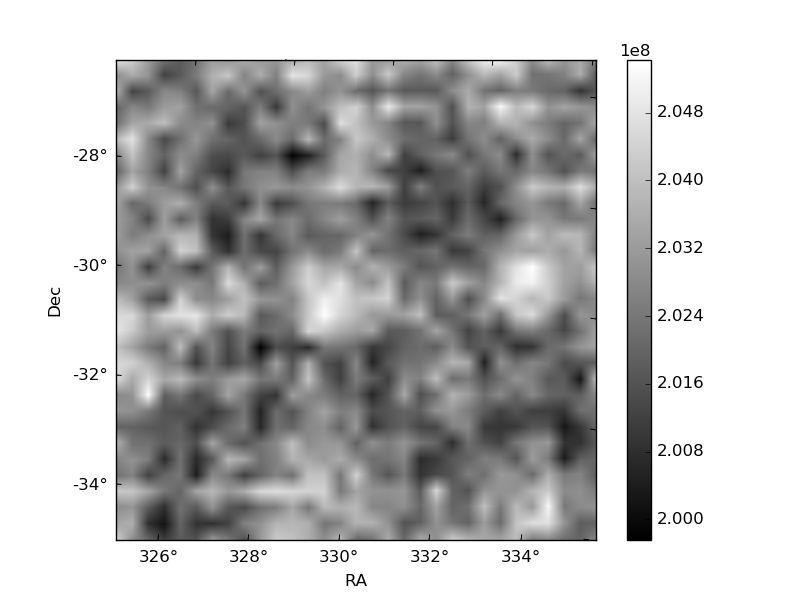
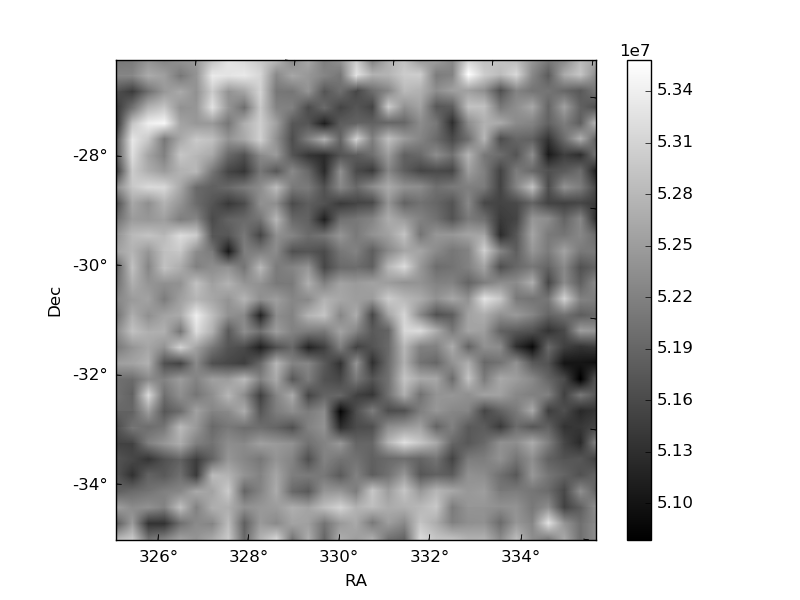
Histogram calculated using DETX and DETY for each event in the final _common_clean file
| Quadrant A | 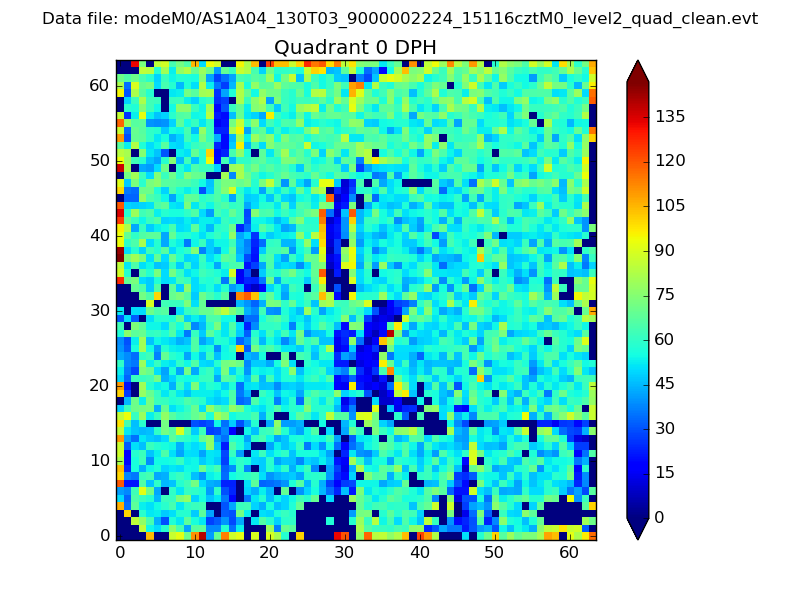 |
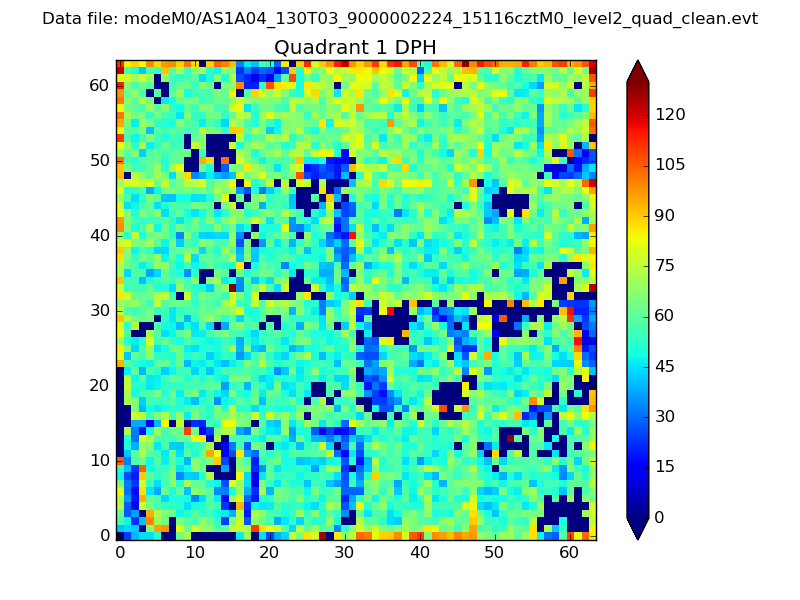 |
Quadrant B |
|---|---|---|---|
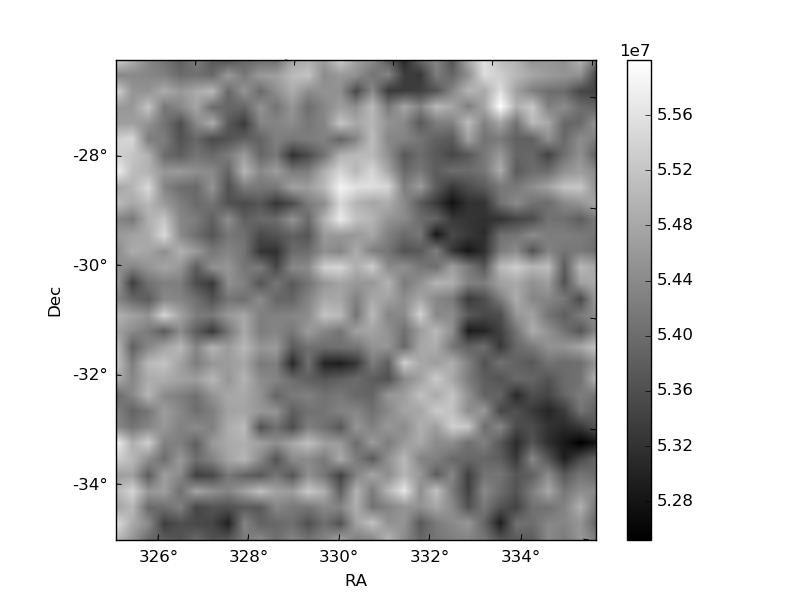
| Quadrant D | 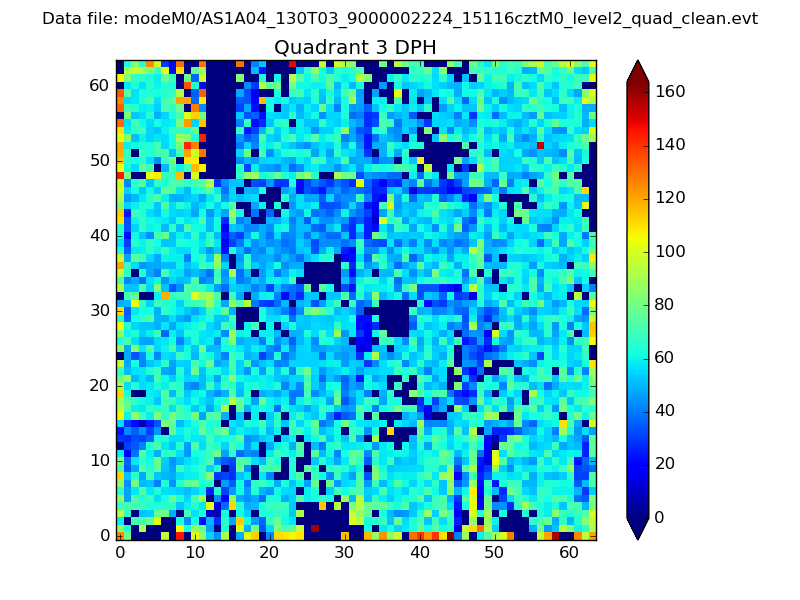 |
 |
Quadrant C |
| Plot type | Count rate plots | Images |
|---|---|---|
| Comparison with Poisson distribution Blue bars denote a histogram of data divided into 1 sec bins. Red curve is a Poisson curve with rate = median count rate of data. |
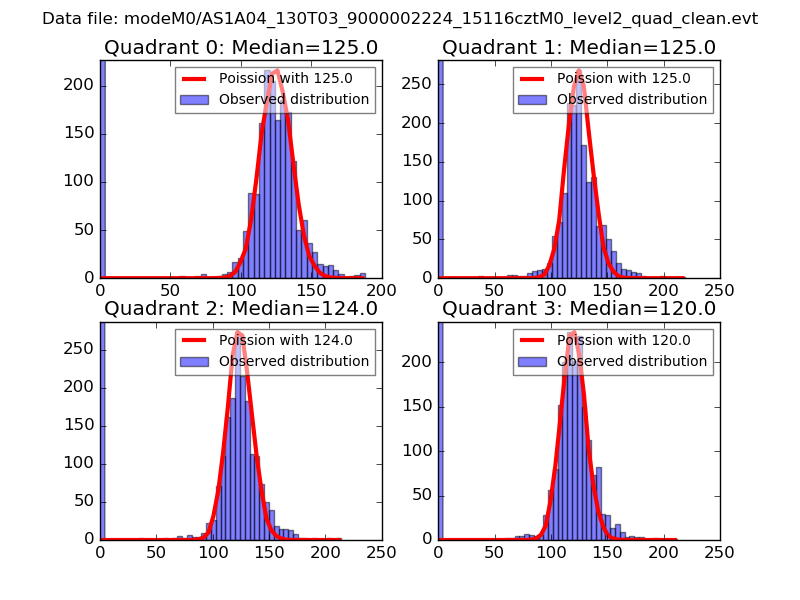 |
 |
| Quadrant-wise count rates Data is divided into 100 sec bins |
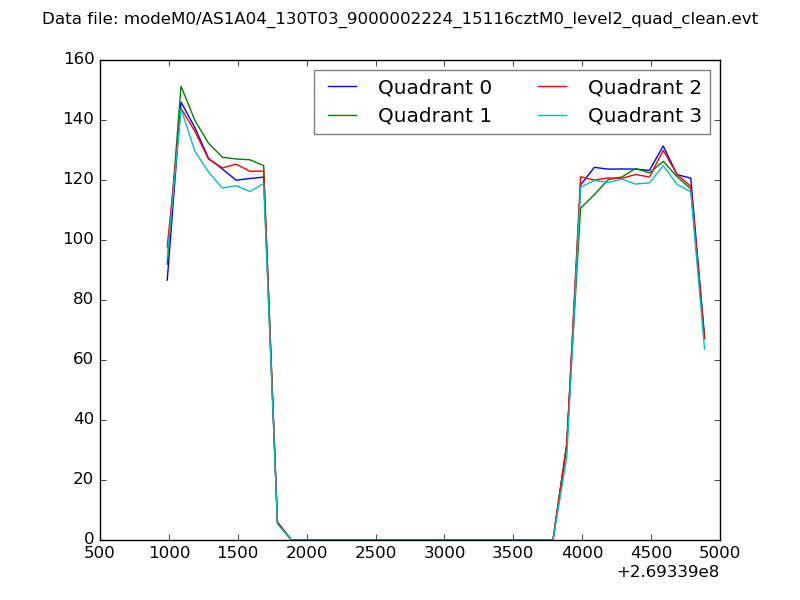 |
|
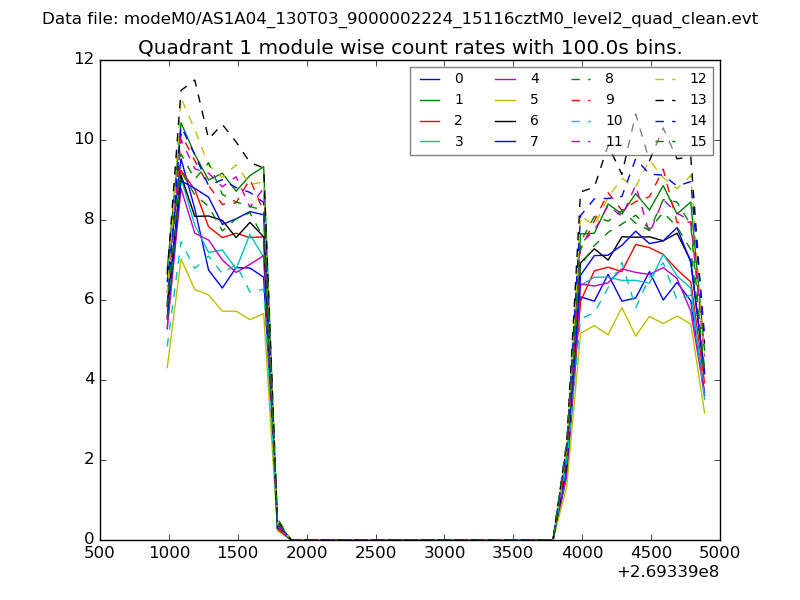
| Module-wise count rates for Quadrant A Data is divided into 100 sec bins |
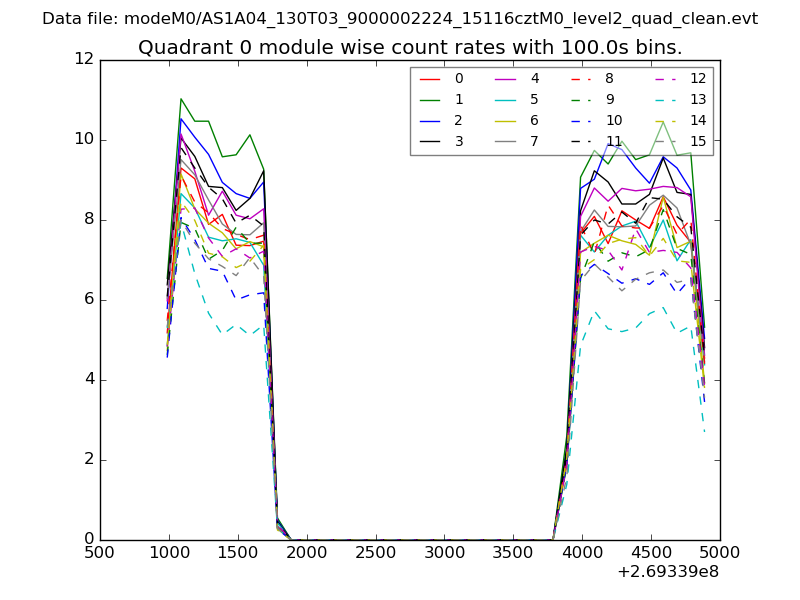 |
 |
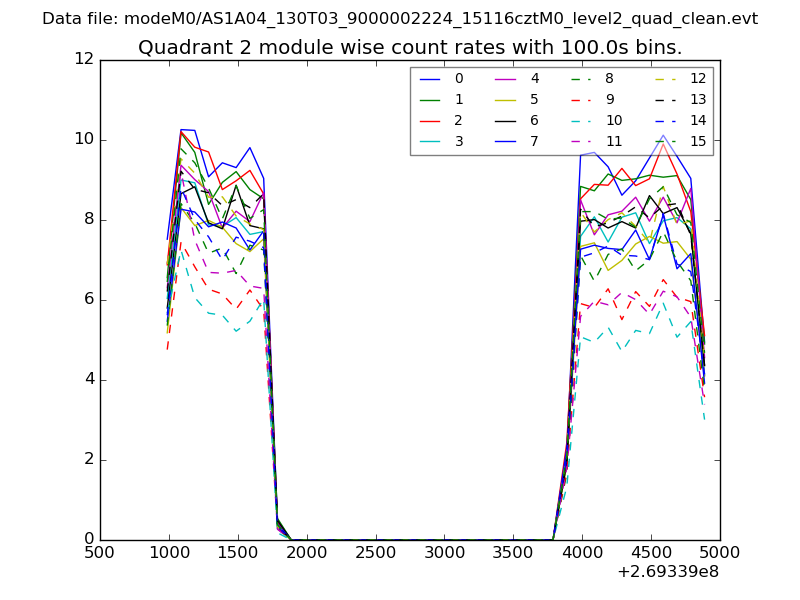
| Module-wise count rates for Quadrant B Data is divided into 100 sec bins |
 |
 |
| Module-wise count rates for Quadrant C Data is divided into 100 sec bins |
 |
 |
| Module-wise count rates for Quadrant D Data is divided into 100 sec bins |
 |
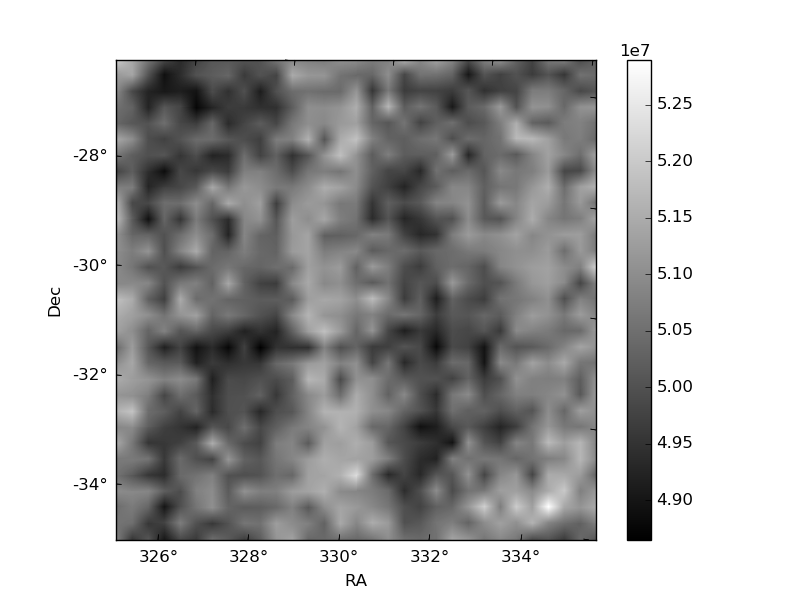 |
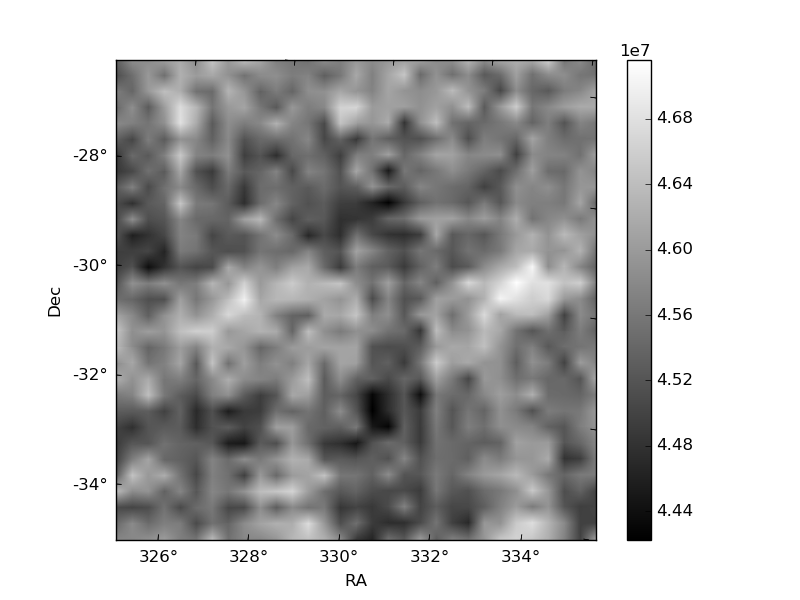
| Parameter | Plot |
|---|---|
| CZT HV Monitor |  |
| D_VDD | 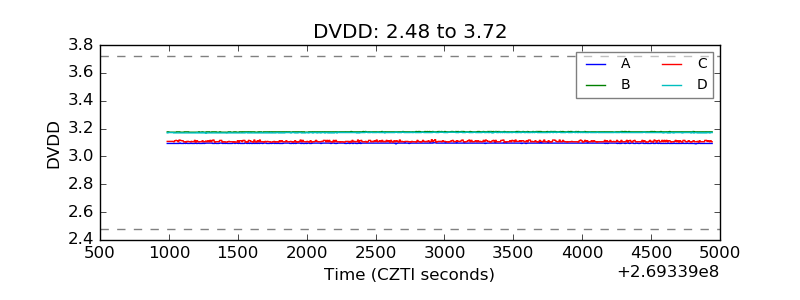 |
| Temperature 1 | 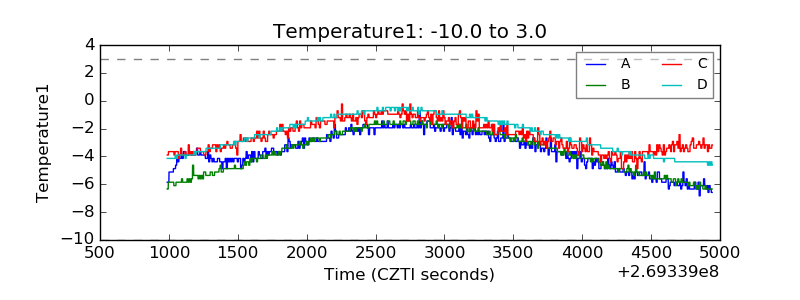 |
| Veto HV Monitor | 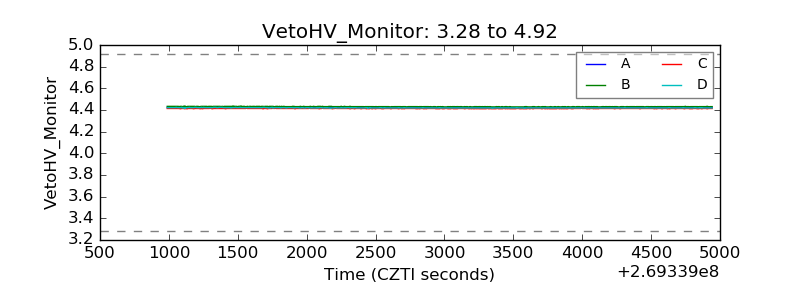 |
| Veto LLD | 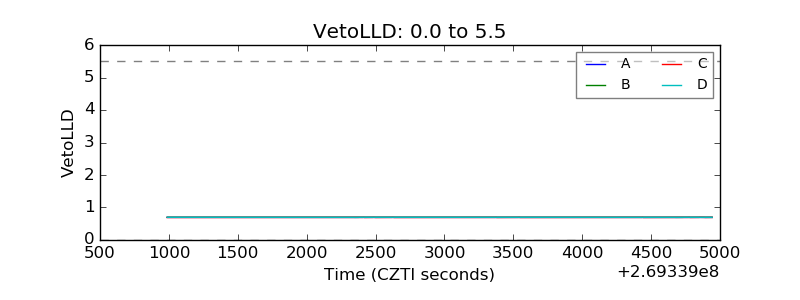 |
| Alpha Counter | 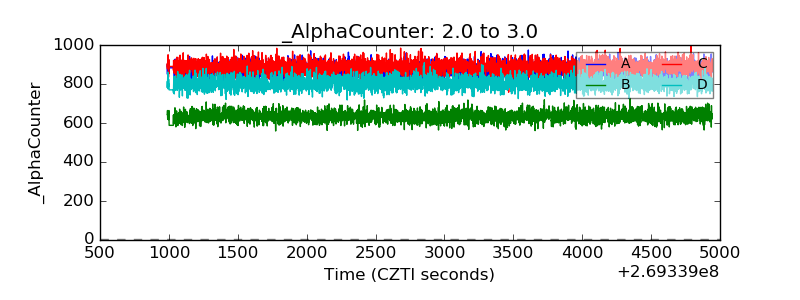 |
| _CPM_Rate | 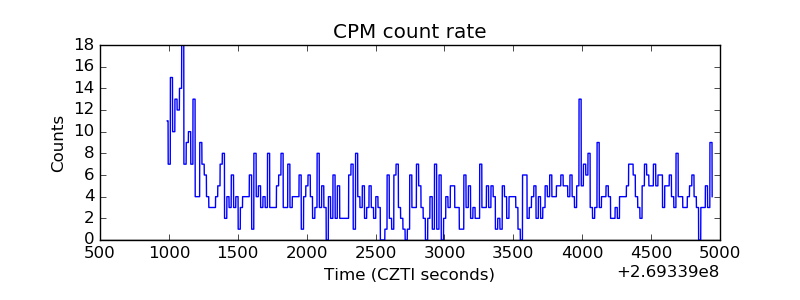 |
| CZT Counter | 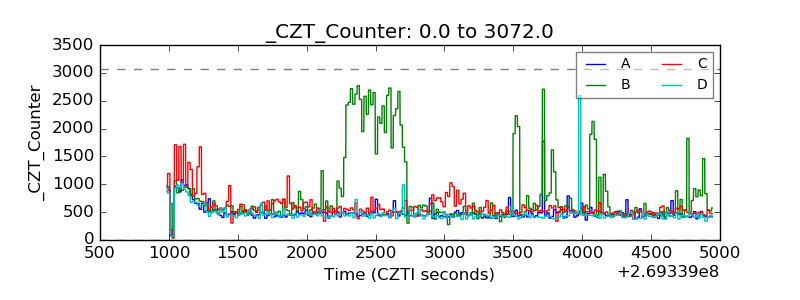 |
| +2.5 Volts monitor |  |
| +5 Volts monitor |  |
| _ROLL_ROT | 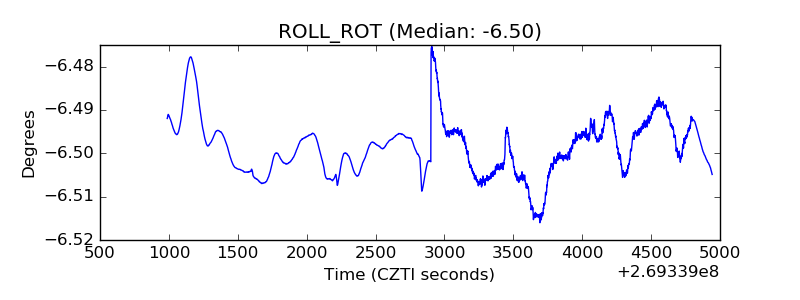 |
| _Roll_DEC | 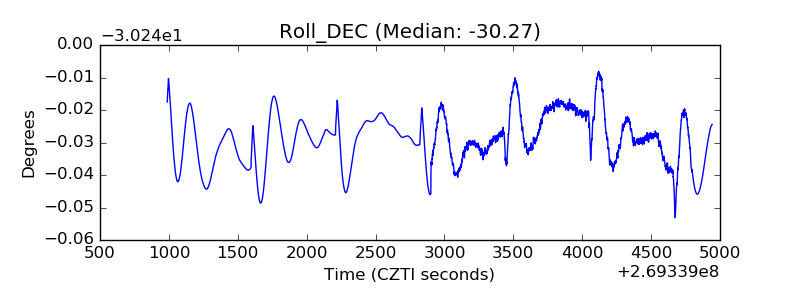 |
| _Roll_RA | 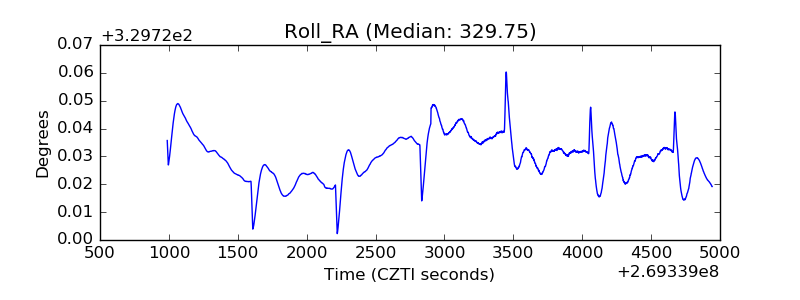 |
| Veto Counter | 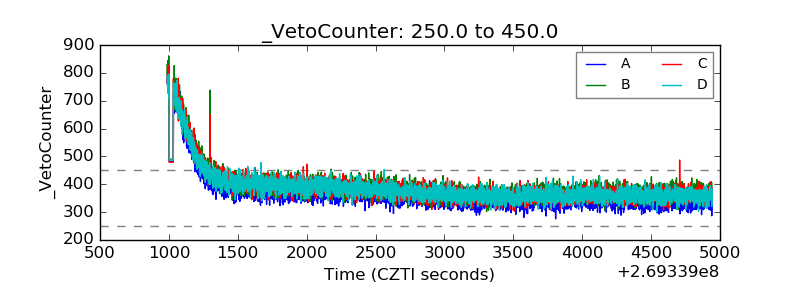 |