| Param | Original file | Final file |
|---|---|---|
| Filename | modeM0/AS1A04_148T03_9000002222_15106cztM0_level2.evt | modeM0/AS1A04_148T03_9000002222_15106cztM0_level2_quad_clean.evt |
| Size (bytes) | 373,017,600 | 78,082,560 |
| Size | 355.7 MB | 74.5 MB |
| Events in quadrant A | 2,389,377 | 502,904 |
| Events in quadrant B | 3,091,333 | 506,664 |
| Events in quadrant C | 3,079,957 | 500,249 |
| Events in quadrant D | 2,380,076 | 488,327 |
| Mode M9 | |||
|---|---|---|---|
| Quadrant | BADHDUFLAG | Total packets | Discarded packets |
| A | 0 | 11 | 0 |
| B | 0 | 11 | 0 |
| C | 0 | 11 | 0 |
| D | 0 | 11 | 0 |
| Mode SS | |||
|---|---|---|---|
| Quadrant | BADHDUFLAG | Total packets | Discarded packets |
| A | 0 | 106 | 0 |
| B | 0 | 106 | 0 |
| C | 0 | 106 | 0 |
| D | 0 | 106 | 0 |
| Mode M0 | |||
|---|---|---|---|
| Quadrant | BADHDUFLAG | Total packets | Discarded packets |
| A | 0 | 10848 | 2 |
| B | 0 | 12605 | 1 |
| C | 0 | 12528 | 1 |
| D | 0 | 10967 | 1 |
| Quadrant | Total seconds | Saturated seconds | Saturation percentage |
|---|---|---|---|
| A | 5231 | 38 | 0.726439% |
| B | 5231 | 134 | 2.561652% |
| C | 5231 | 135 | 2.580768% |
| D | 5231 | 40 | 0.764672% |
Noise dominated data is calculated using 1-second bins in cleaned event files. If a bin has >2000 counts, and if more than 50% of those come from <1% of pixels, then it is considered to be noise-dominated and hence unusable.
| Quadrant | # 1 sec bins | Bins with >0 counts | Bins with >2000 counts | High rate bins dominated by noise | Noise dominated (total time) | Noise dominated (detector-on time) | Marked lightcurve |
|---|---|---|---|---|---|---|---|
| A | 6277 | 5232 | 0 | 0 | 0.00% | 0.00% | 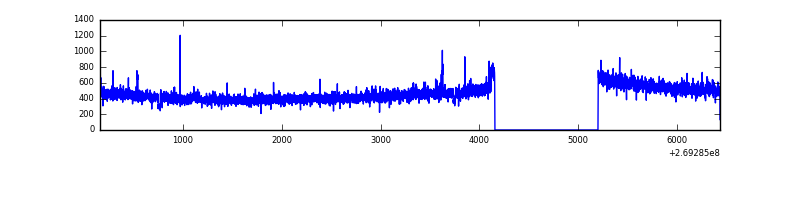 |
| B | 6277 | 5232 | 67 | 67 | 1.07% | 1.28% | 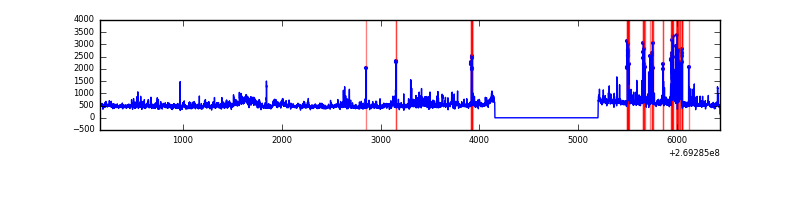 |
| C | 6277 | 5232 | 72 | 72 | 1.15% | 1.38% | 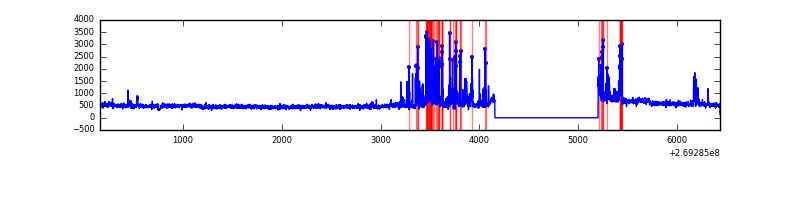 |
| D | 6277 | 5232 | 10 | 10 | 0.16% | 0.19% | 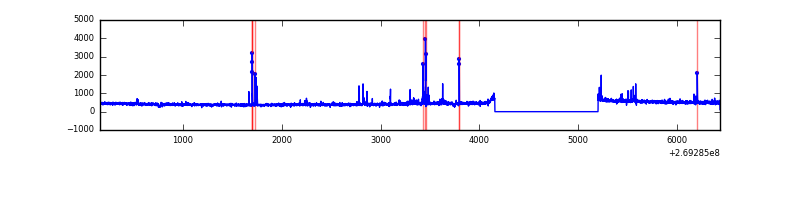 |
Top three noisy pixels from each quadrant. If the there are fewer than three noisy pixels in the level2.evt file, extra rows are filled as -1
| Pixel properties | Quadrant properties | ||||||
|---|---|---|---|---|---|---|---|
| Quadrant | DetID | PixID | Counts | Sigma | Mean | Median | Sigma |
| A | 12 | 189 | 23875 | 187.2 | 614 | 601 | 124.3 |
| A | 0 | 226 | 5419 | 38.75 | 614 | 601 | 124.3 |
| A | 12 | 194 | 4590 | 32.08 | 614 | 601 | 124.3 |
| B | 3 | 64 | 418214 | 3583.59 | 610 | 594 | 116.5 |
| B | 10 | 245 | 240701 | 2060.36 | 610 | 594 | 116.5 |
| B | 3 | 209 | 19714 | 164.07 | 610 | 594 | 116.5 |
| C | 4 | 254 | 446625 | 3221.36 | 597 | 599 | 138.5 |
| C | 3 | 233 | 305004 | 2198.52 | 597 | 599 | 138.5 |
| C | 13 | 61 | 4335 | 26.98 | 597 | 599 | 138.5 |
| D | 13 | 170 | 49073 | 327.65 | 600 | 582 | 148.0 |
| D | 10 | 70 | 25176 | 166.18 | 600 | 582 | 148.0 |
| D | 2 | 234 | 19947 | 130.85 | 600 | 582 | 148.0 |
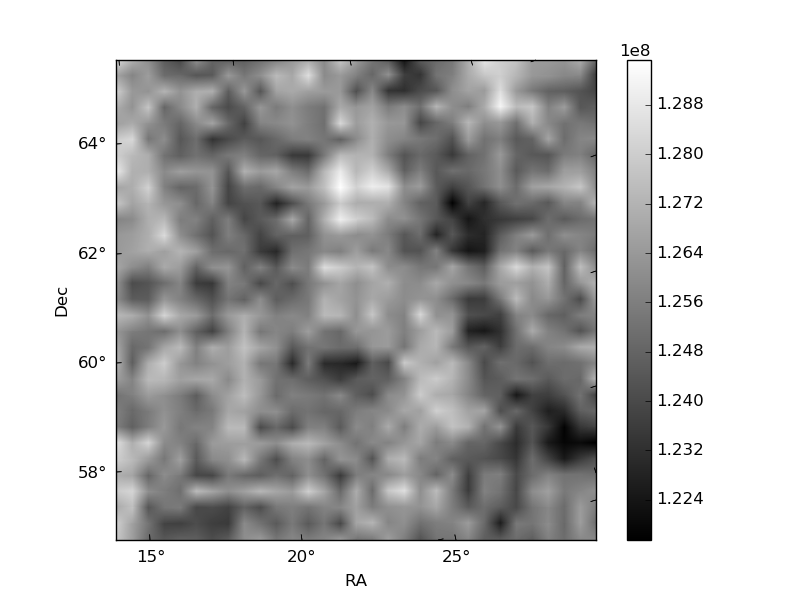
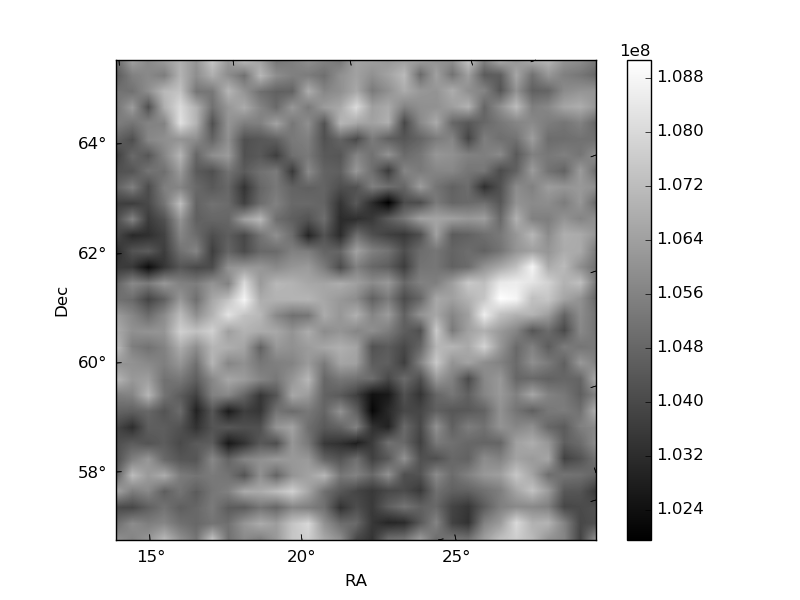
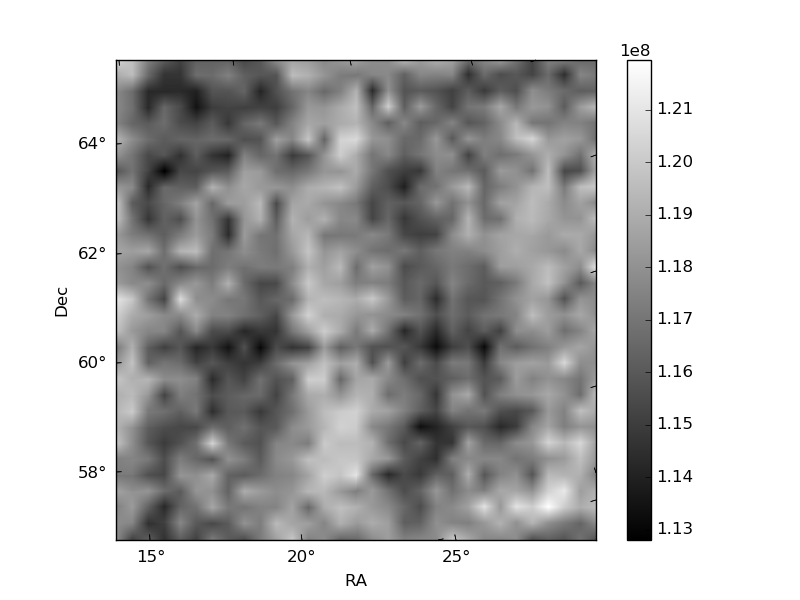
Histogram calculated using DETX and DETY for each event in the final _common_clean file
| Quadrant A | 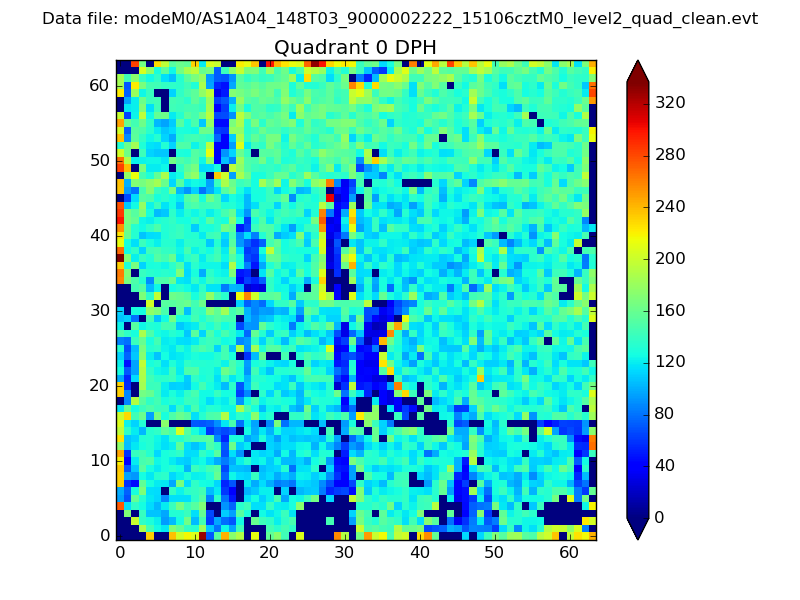 |
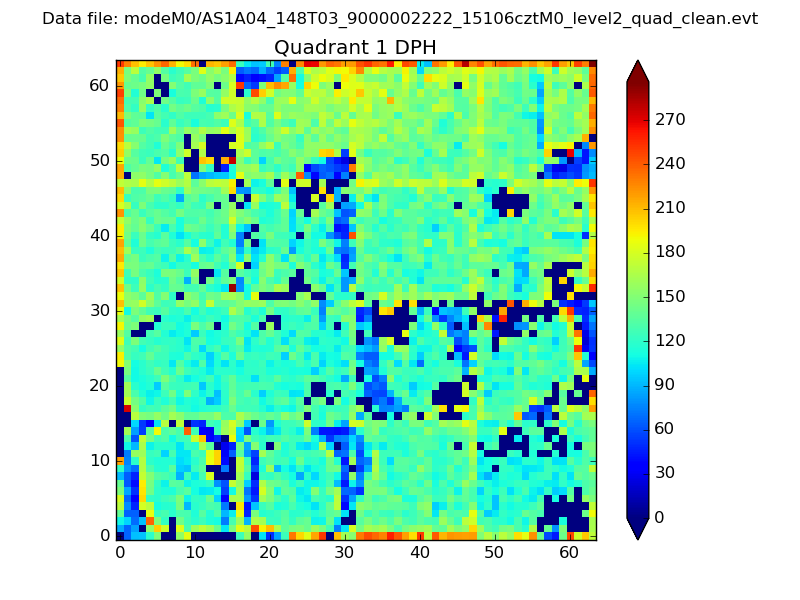 |
Quadrant B |
|---|---|---|---|
| Quadrant D | 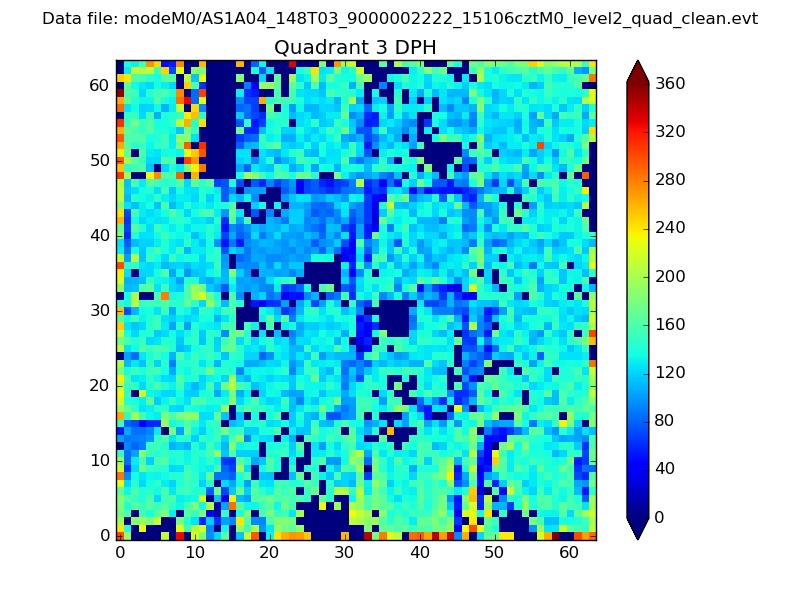 |
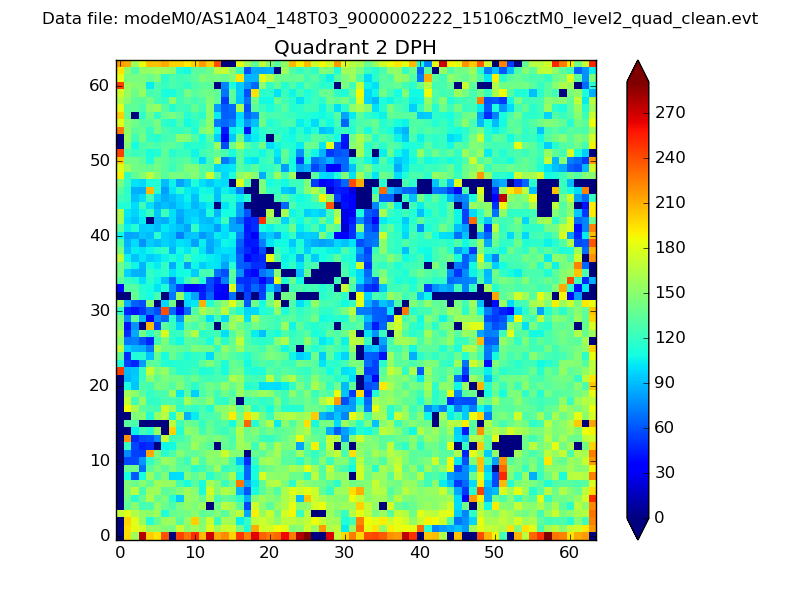 |
Quadrant C |
| Plot type | Count rate plots | Images |
|---|---|---|
| Comparison with Poisson distribution Blue bars denote a histogram of data divided into 1 sec bins. Red curve is a Poisson curve with rate = median count rate of data. |
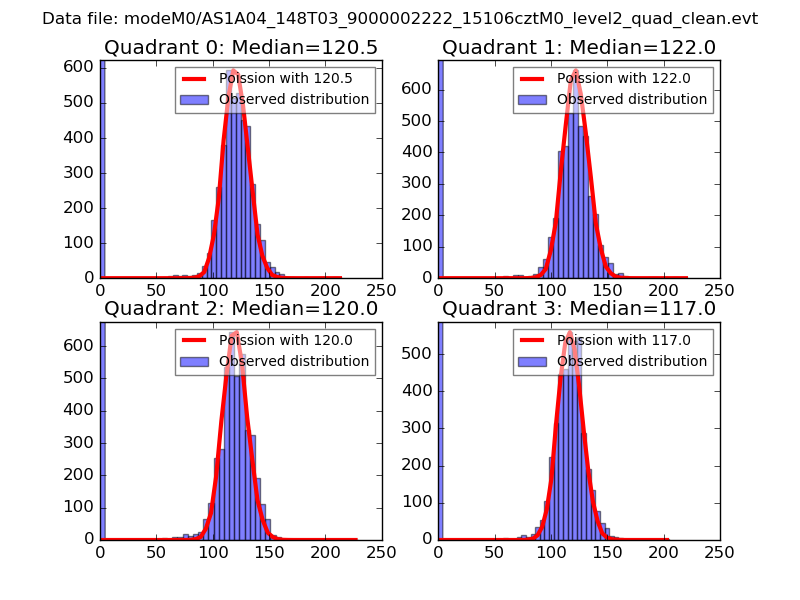 |
 |
| Quadrant-wise count rates Data is divided into 100 sec bins |
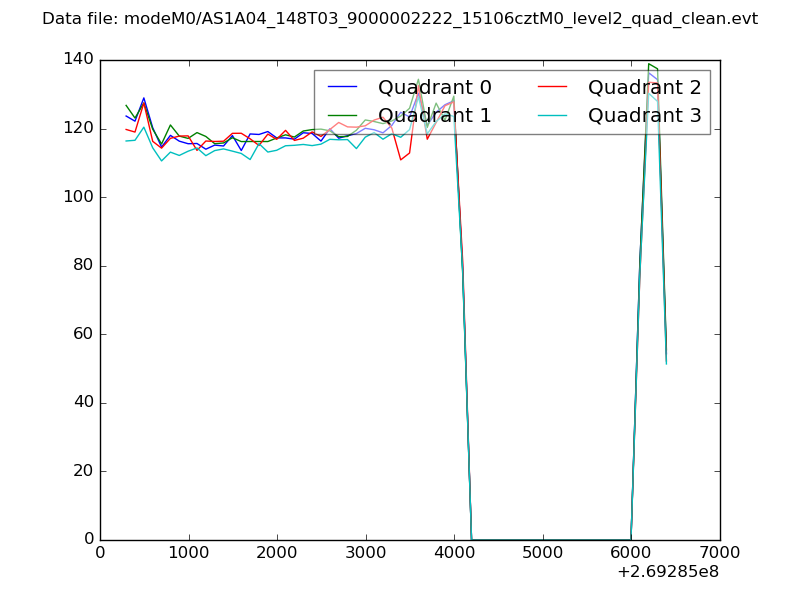 |
|
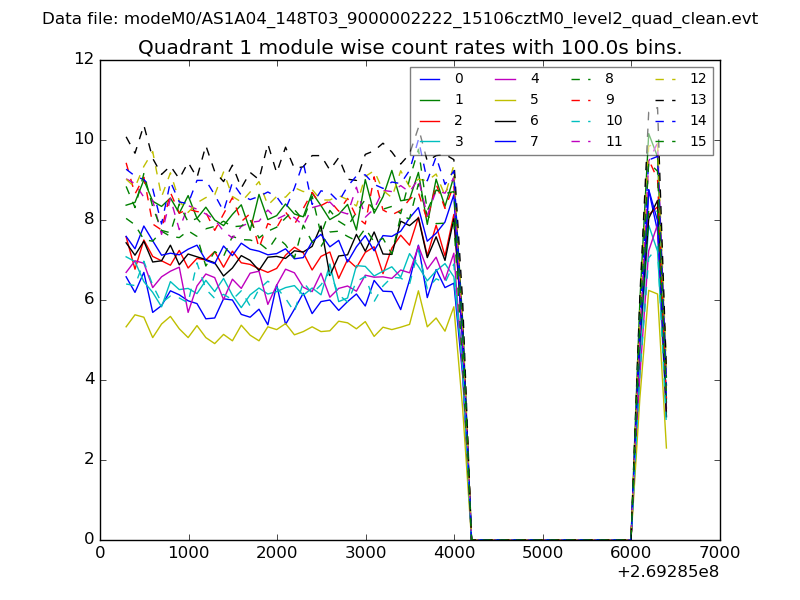
| Module-wise count rates for Quadrant A Data is divided into 100 sec bins |
 |
 |
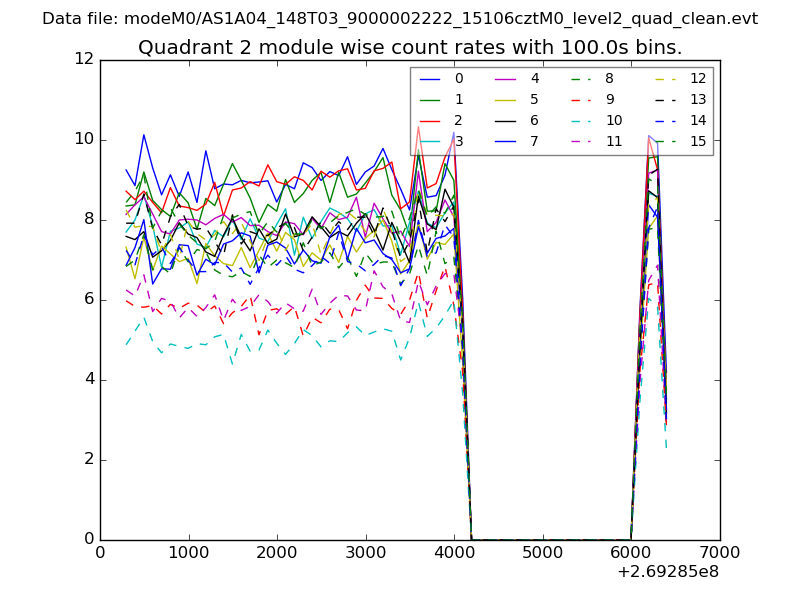
| Module-wise count rates for Quadrant B Data is divided into 100 sec bins |
 |
 |
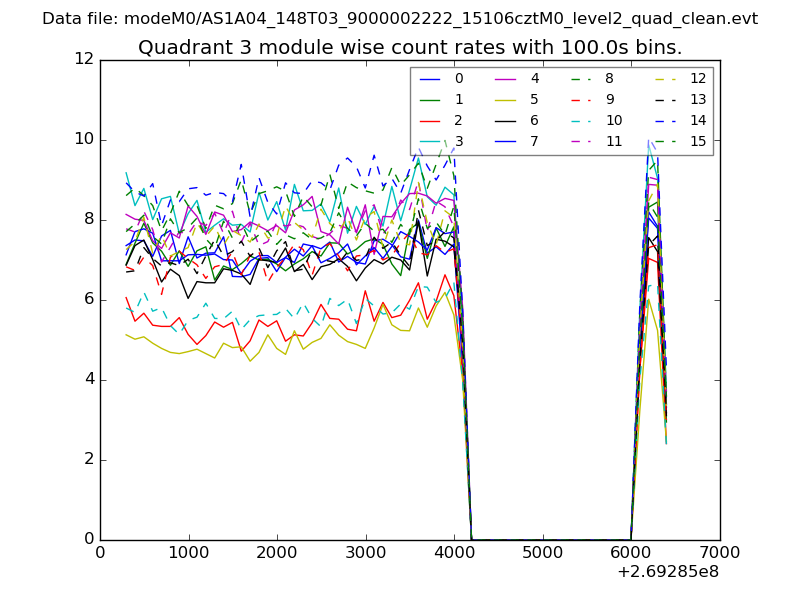
| Module-wise count rates for Quadrant C Data is divided into 100 sec bins |
 |
 |
| Module-wise count rates for Quadrant D Data is divided into 100 sec bins |
 |
 |
| Parameter | Plot |
|---|---|
| CZT HV Monitor | 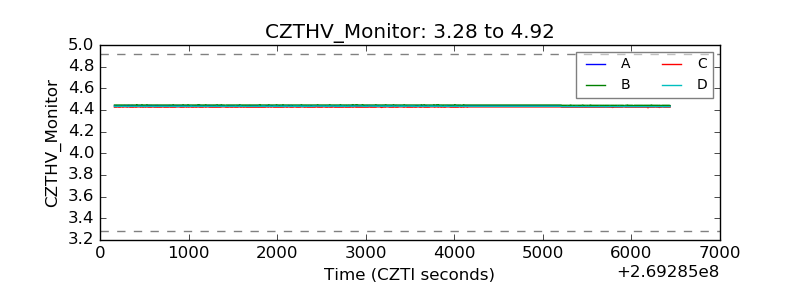 |
| D_VDD | 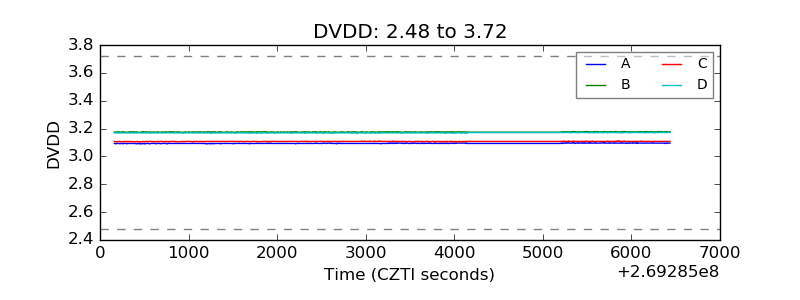 |
| Temperature 1 | 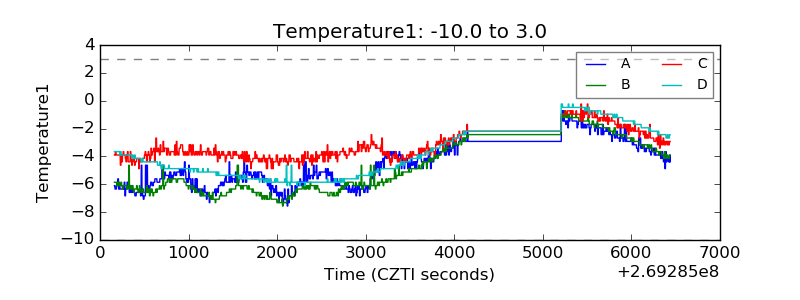 |
| Veto HV Monitor | 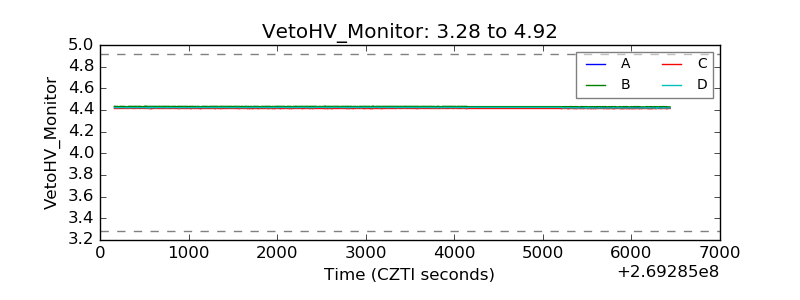 |
| Veto LLD |  |
| Alpha Counter | 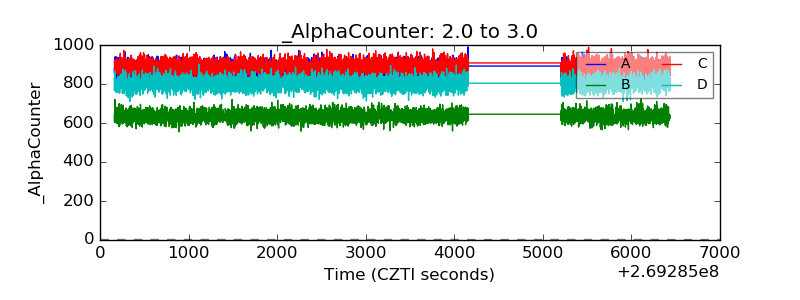 |
| _CPM_Rate | 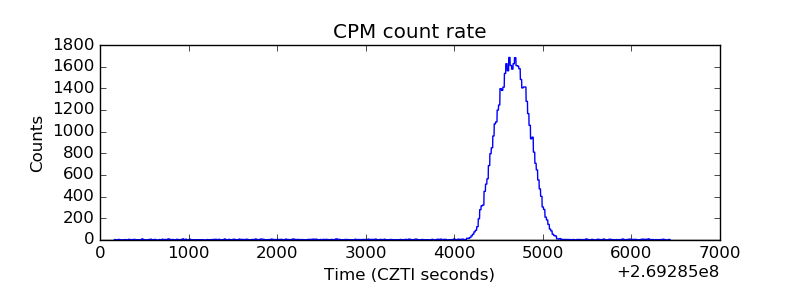 |
| CZT Counter | 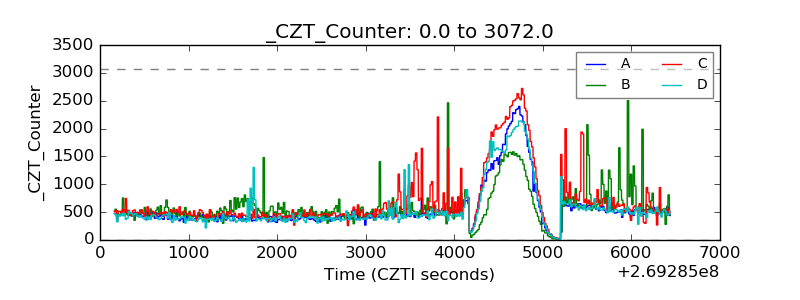 |
| +2.5 Volts monitor |  |
| +5 Volts monitor |  |
| _ROLL_ROT |  |
| _Roll_DEC | 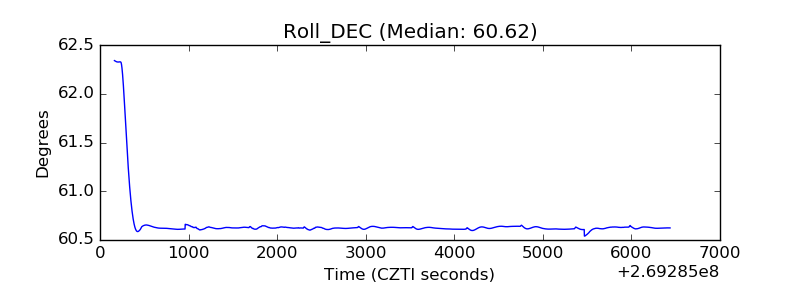 |
| _Roll_RA | 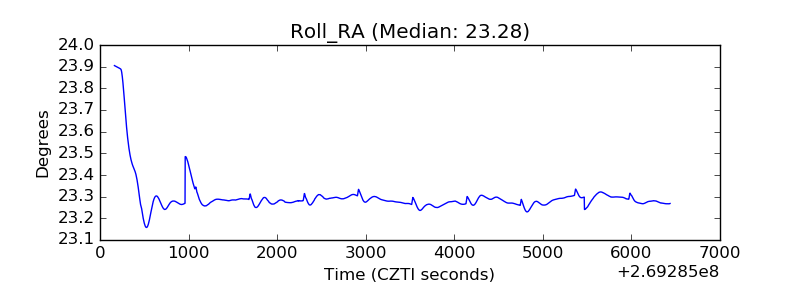 |
| Veto Counter |  |