| Param | Original file | Final file |
|---|---|---|
| Filename | modeM0/AS1A04_148T03_9000002222_15110cztM0_level2.evt | modeM0/AS1A04_148T03_9000002222_15110cztM0_level2_quad_clean.evt |
| Size (bytes) | 494,645,760 | 106,116,480 |
| Size | 471.7 MB | 101.2 MB |
| Events in quadrant A | 3,042,707 | 698,064 |
| Events in quadrant B | 4,835,256 | 696,070 |
| Events in quadrant C | 3,643,325 | 712,206 |
| Events in quadrant D | 3,042,472 | 678,714 |
| Mode M9 | |||
|---|---|---|---|
| Quadrant | BADHDUFLAG | Total packets | Discarded packets |
| A | 0 | 20 | 0 |
| B | 0 | 20 | 0 |
| C | 0 | 20 | 0 |
| D | 0 | 21 | 0 |
| Mode SS | |||
|---|---|---|---|
| Quadrant | BADHDUFLAG | Total packets | Discarded packets |
| A | 0 | 124 | 0 |
| B | 0 | 124 | 0 |
| C | 0 | 124 | 0 |
| D | 0 | 124 | 0 |
| Mode M0 | |||
|---|---|---|---|
| Quadrant | BADHDUFLAG | Total packets | Discarded packets |
| A | 0 | 13248 | 2 |
| B | 0 | 18603 | 2 |
| C | 0 | 15011 | 2 |
| D | 0 | 13395 | 2 |
| Quadrant | Total seconds | Saturated seconds | Saturation percentage |
|---|---|---|---|
| A | 6145 | 24 | 0.390561% |
| B | 6145 | 469 | 7.632221% |
| C | 6145 | 53 | 0.862490% |
| D | 6145 | 39 | 0.634662% |
Noise dominated data is calculated using 1-second bins in cleaned event files. If a bin has >2000 counts, and if more than 50% of those come from <1% of pixels, then it is considered to be noise-dominated and hence unusable.
| Quadrant | # 1 sec bins | Bins with >0 counts | Bins with >2000 counts | High rate bins dominated by noise | Noise dominated (total time) | Noise dominated (detector-on time) | Marked lightcurve |
|---|---|---|---|---|---|---|---|
| A | 7436 | 6147 | 2 | 2 | 0.03% | 0.03% | 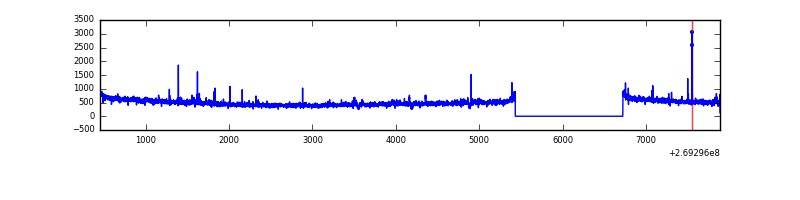 |
| B | 7436 | 6147 | 283 | 283 | 3.81% | 4.60% | 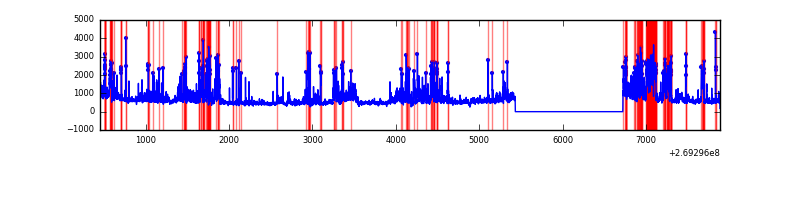 |
| C | 7436 | 6146 | 11 | 11 | 0.15% | 0.18% | 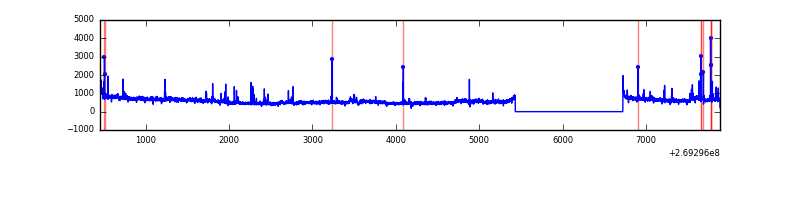 |
| D | 7436 | 6147 | 17 | 17 | 0.23% | 0.28% | 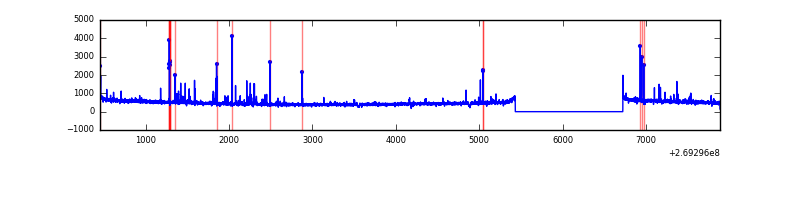 |
Top three noisy pixels from each quadrant. If the there are fewer than three noisy pixels in the level2.evt file, extra rows are filled as -1
| Pixel properties | Quadrant properties | ||||||
|---|---|---|---|---|---|---|---|
| Quadrant | DetID | PixID | Counts | Sigma | Mean | Median | Sigma |
| A | 12 | 189 | 39134 | 249.95 | 770 | 755 | 153.5 |
| A | 13 | 248 | 15398 | 95.37 | 770 | 755 | 153.5 |
| A | 9 | 143 | 12144 | 74.17 | 770 | 755 | 153.5 |
| B | 10 | 245 | 728325 | 5172.93 | 760 | 743 | 140.7 |
| B | 3 | 64 | 608299 | 4319.58 | 760 | 743 | 140.7 |
| B | 0 | 229 | 372729 | 2644.73 | 760 | 743 | 140.7 |
| C | 3 | 233 | 548311 | 3150.56 | 763 | 769 | 173.8 |
| C | 4 | 254 | 117421 | 671.22 | 763 | 769 | 173.8 |
| C | 13 | 61 | 5536 | 27.43 | 763 | 769 | 173.8 |
| D | 9 | 1 | 45481 | 245.52 | 756 | 734 | 182.3 |
| D | 2 | 120 | 31134 | 166.8 | 756 | 734 | 182.3 |
| D | 13 | 172 | 26035 | 138.82 | 756 | 734 | 182.3 |
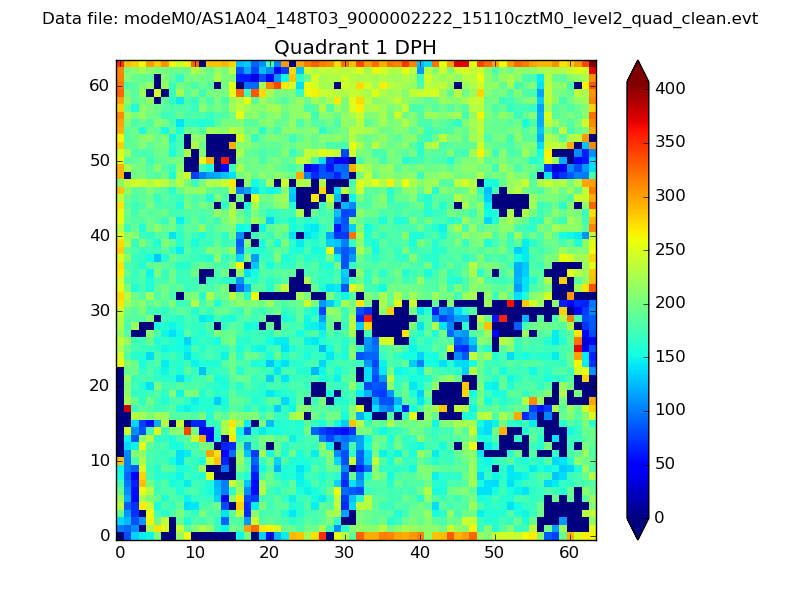
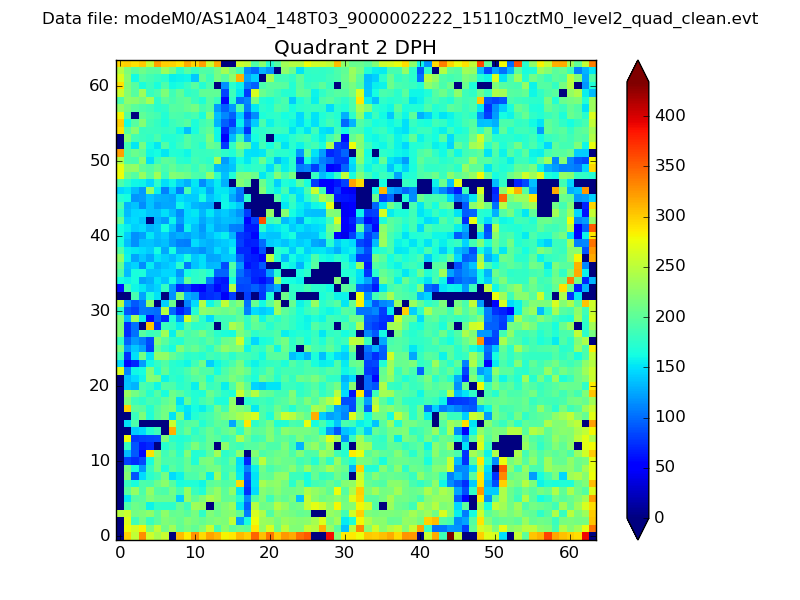
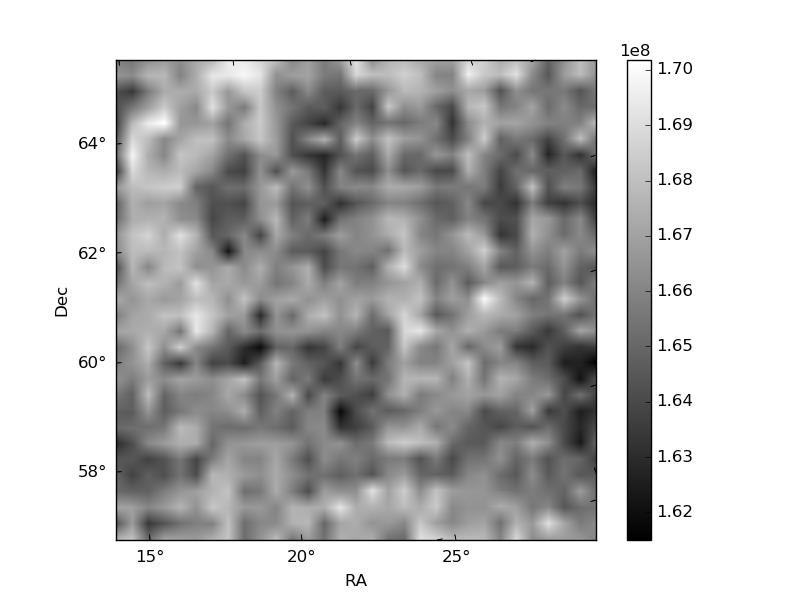
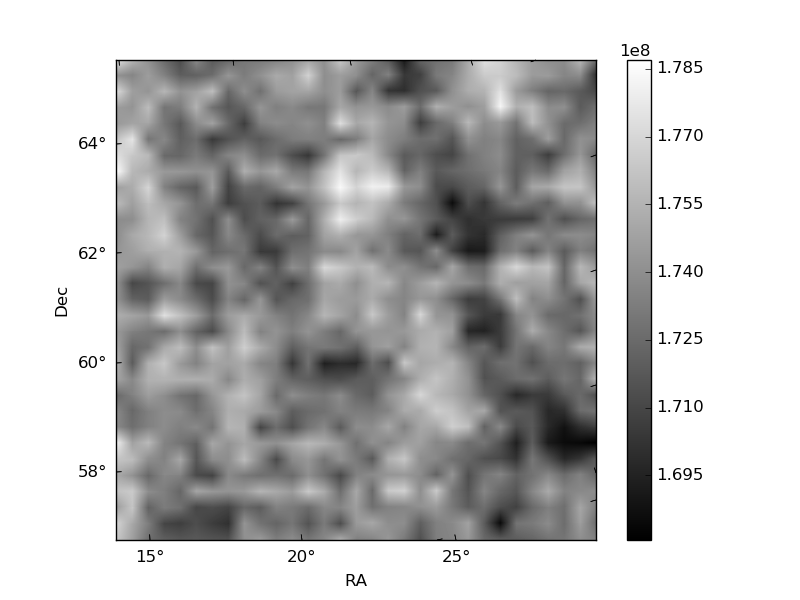
Histogram calculated using DETX and DETY for each event in the final _common_clean file
| Quadrant A |  |
 |
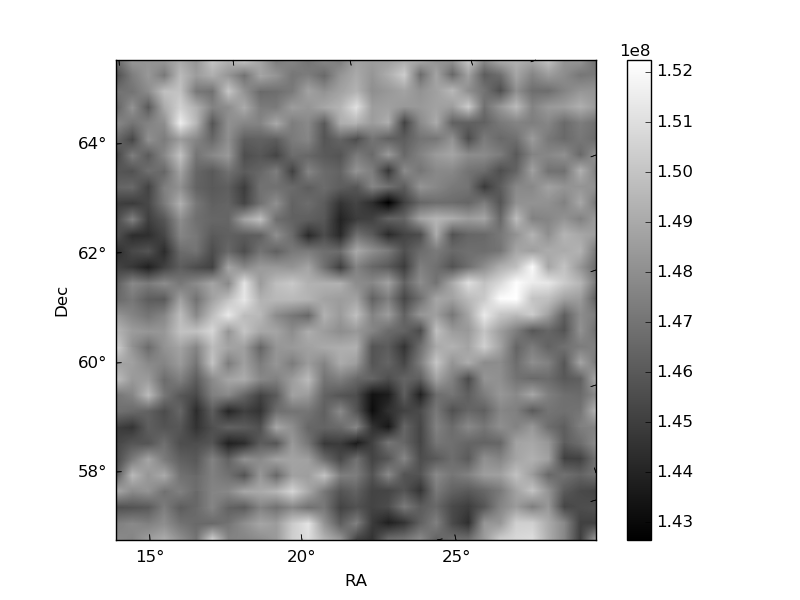
Quadrant B |
|---|---|---|---|
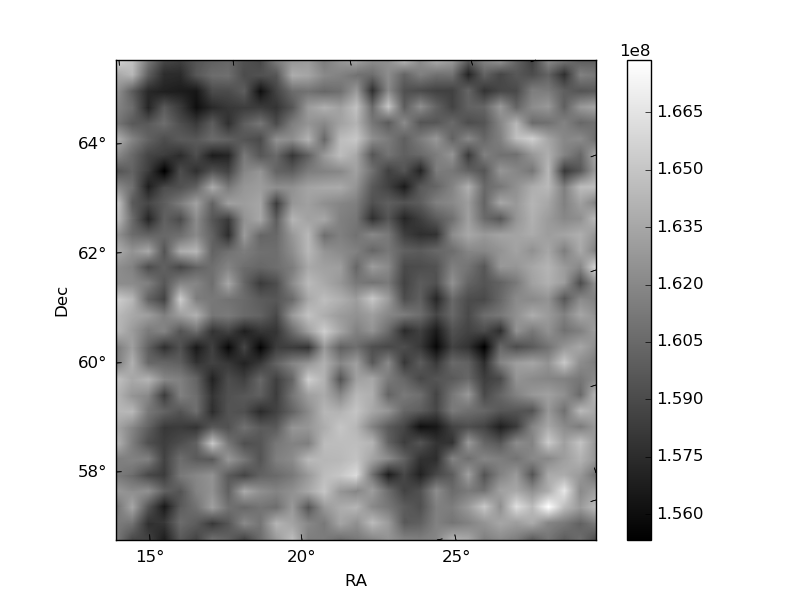
| Quadrant D |  |
 |
Quadrant C |
| Plot type | Count rate plots | Images |
|---|---|---|
| Comparison with Poisson distribution Blue bars denote a histogram of data divided into 1 sec bins. Red curve is a Poisson curve with rate = median count rate of data. |
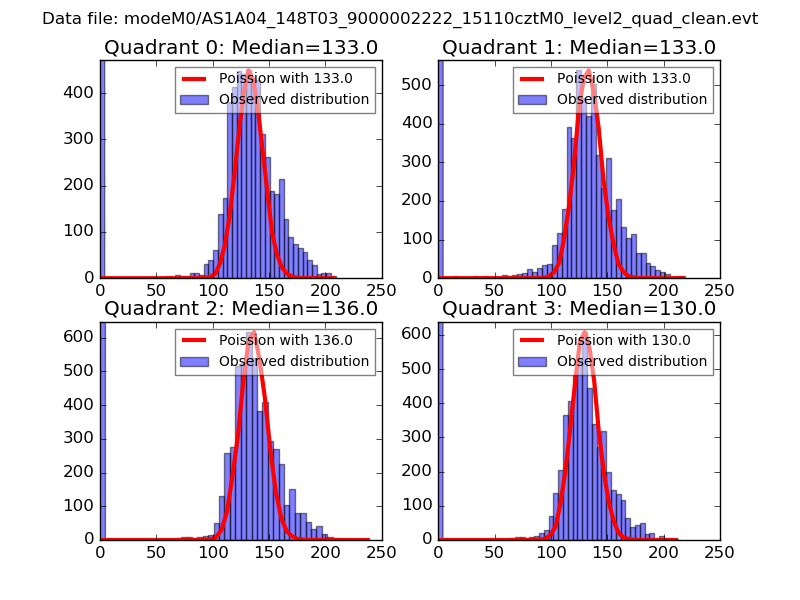 |
 |
| Quadrant-wise count rates Data is divided into 100 sec bins |
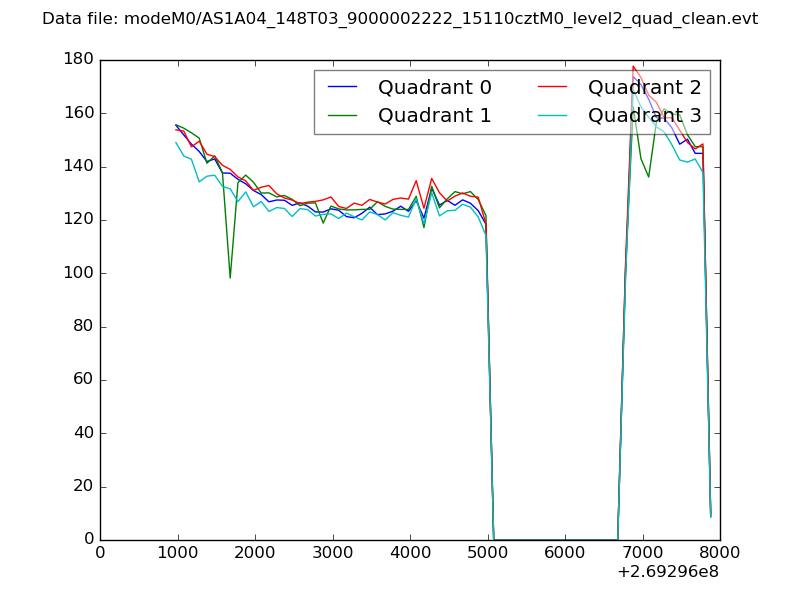 |
|
| Module-wise count rates for Quadrant A Data is divided into 100 sec bins |
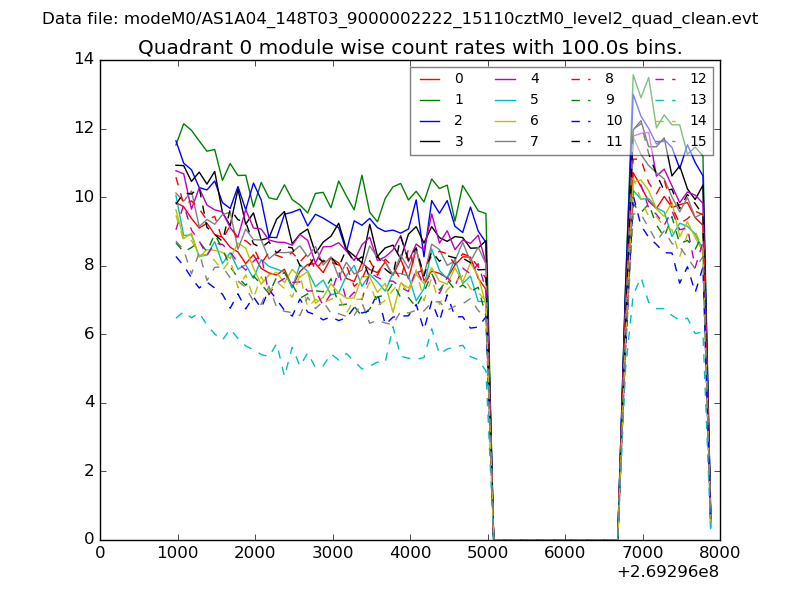 |
 |
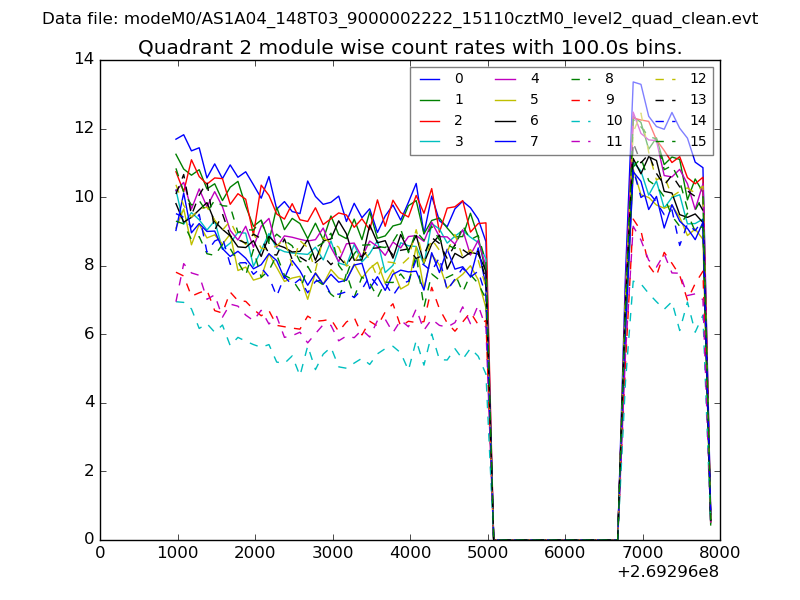
| Module-wise count rates for Quadrant B Data is divided into 100 sec bins |
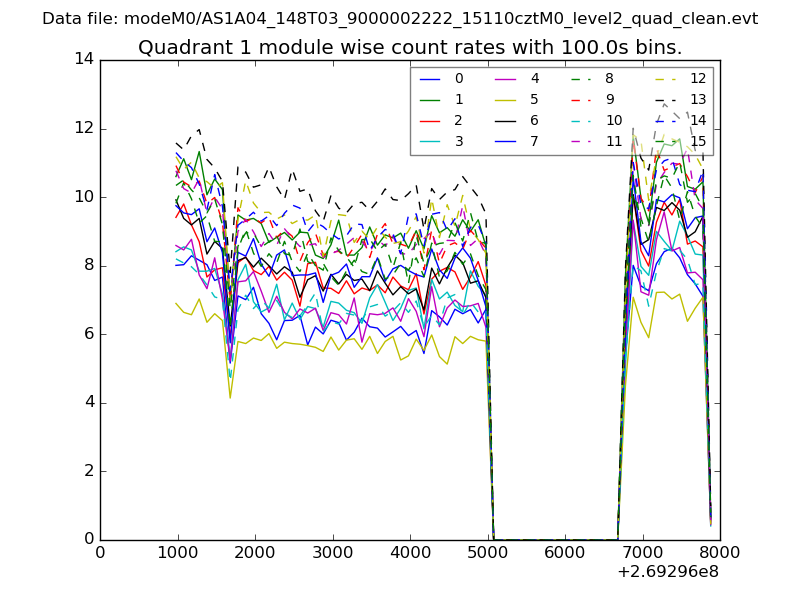 |
 |
| Module-wise count rates for Quadrant C Data is divided into 100 sec bins |
 |
 |
| Module-wise count rates for Quadrant D Data is divided into 100 sec bins |
 |
 |
| Parameter | Plot |
|---|---|
| CZT HV Monitor | 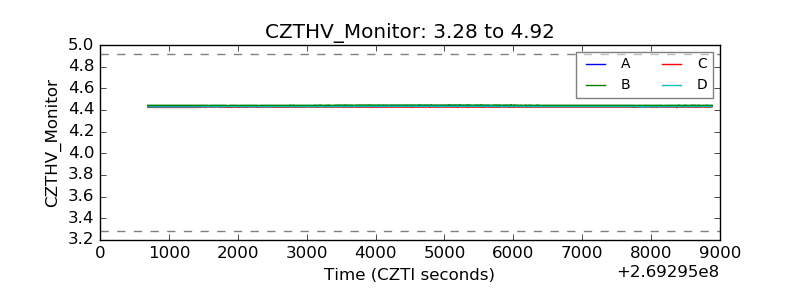 |
| D_VDD | 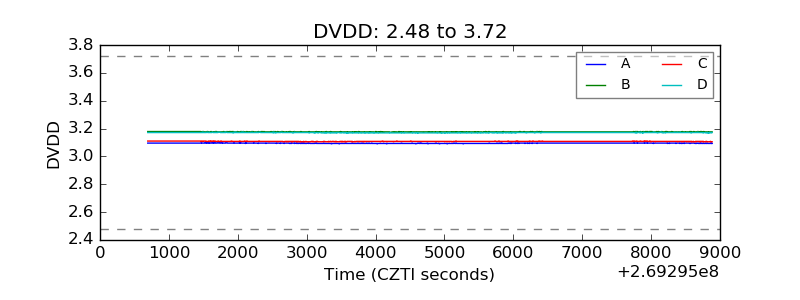 |
| Temperature 1 | 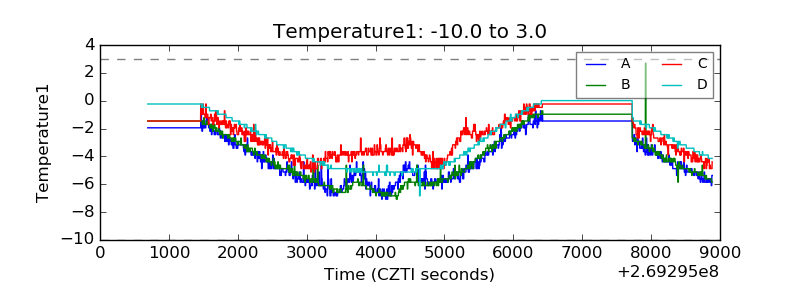 |
| Veto HV Monitor | 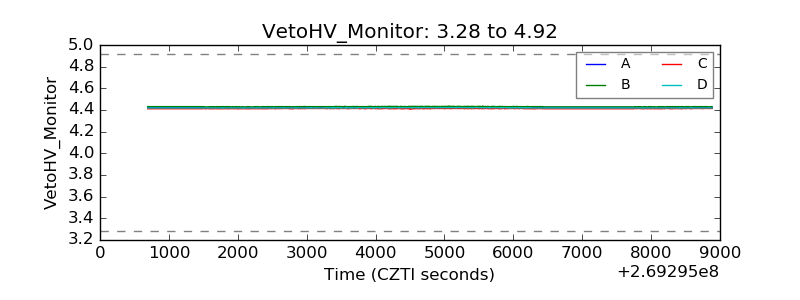 |
| Veto LLD | 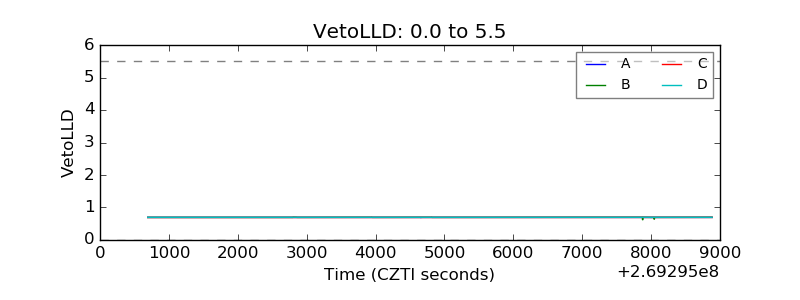 |
| Alpha Counter | 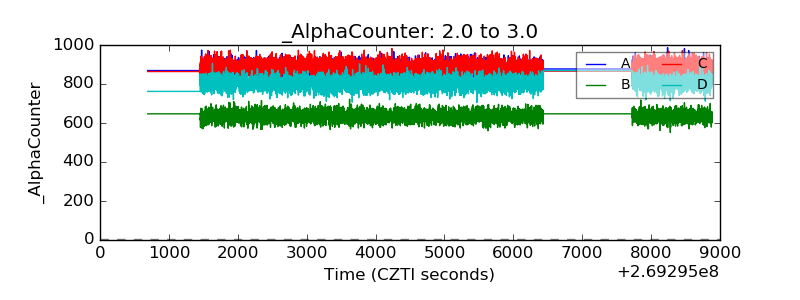 |
| _CPM_Rate | 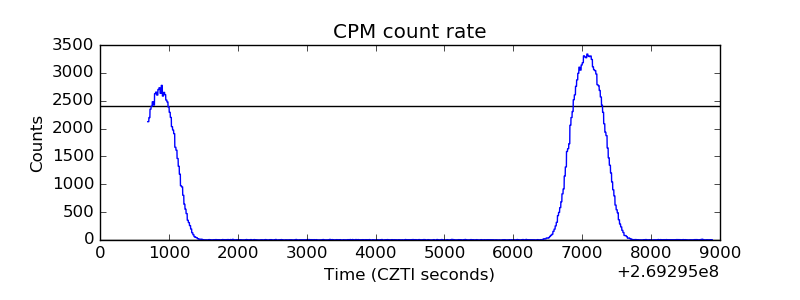 |
| CZT Counter | 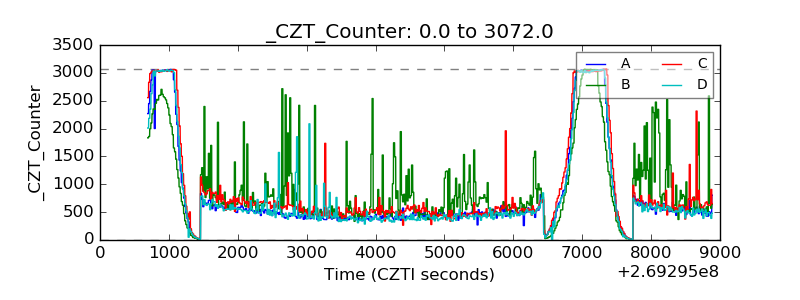 |
| +2.5 Volts monitor |  |
| +5 Volts monitor |  |
| _ROLL_ROT | 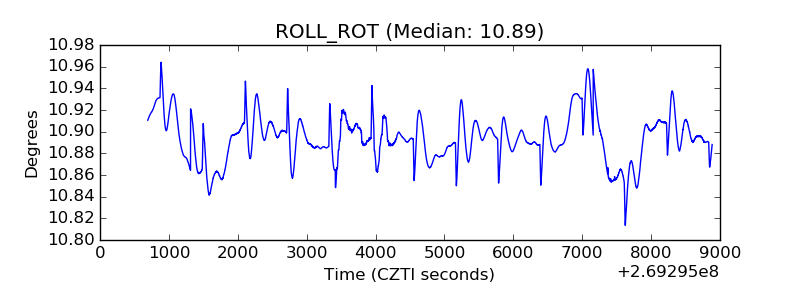 |
| _Roll_DEC | 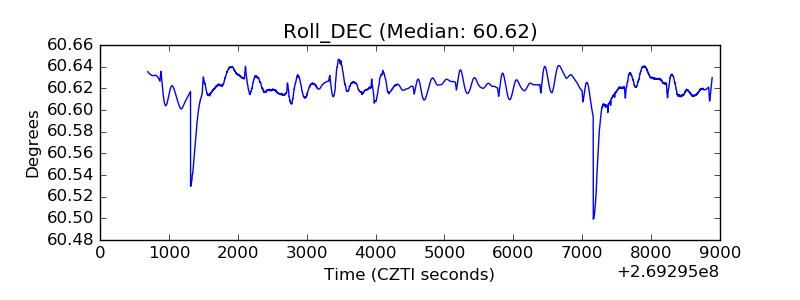 |
| _Roll_RA | 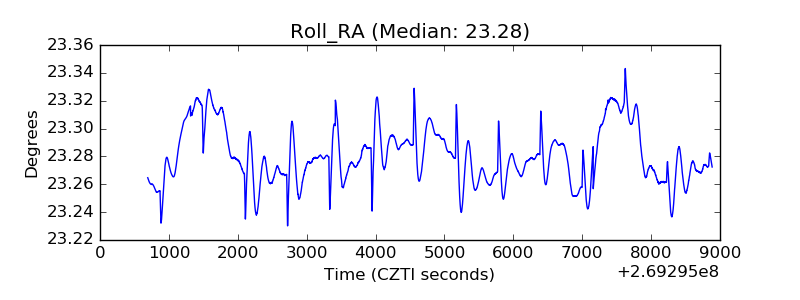 |
| Veto Counter |  |