| Param | Original file | Final file |
|---|---|---|
| Filename | modeM0/AS1G08_046T09_9000002226cztM0_level2.fits | modeM0/AS1G08_046T09_9000002226cztM0_level2_quad_clean.evt |
| Size (bytes) | 632,111,040 | 548,884,800 |
| Size | 602.8 MB | 523.5 MB |
| Events in quadrant A | 3,880,928 | 3,209,606 |
| Events in quadrant B | 3,676,600 | 3,094,867 |
| Events in quadrant C | 3,736,054 | 2,955,453 |
| Events in quadrant D | 3,262,532 | 2,775,951 |
| Mode M0 | |||
|---|---|---|---|
| Quadrant | BADHDUFLAG | Total packets | Discarded packets |
| A | 0 | 138809 | 0 |
| B | 0 | 163221 | 0 |
| C | 0 | 164928 | 0 |
| D | 0 | 146110 | 0 |
| Mode M9 | |||
|---|---|---|---|
| Quadrant | BADHDUFLAG | Total packets | Discarded packets |
| A | 0 | 116 | 0 |
| B | 0 | 116 | 0 |
| C | 0 | 116 | 0 |
| D | 0 | 116 | 0 |
| Mode SS | |||
|---|---|---|---|
| Quadrant | BADHDUFLAG | Total packets | Discarded packets |
| A | 0 | 1364 | 0 |
| B | 0 | 1364 | 0 |
| C | 0 | 1364 | 0 |
| D | 0 | 1364 | 0 |
| Quadrant | Total seconds | Saturated seconds | Saturation percentage |
|---|---|---|---|
| A | 66859 | 690 | 1.032023% |
| B | 66859 | 2974 | 4.448167% |
| C | 66859 | 1757 | 2.627918% |
| D | 66859 | 1381 | 2.065541% |
Noise dominated data is calculated using 1-second bins in cleaned event files. If a bin has >2000 counts, and if more than 50% of those come from <1% of pixels, then it is considered to be noise-dominated and hence unusable.
| Quadrant | # 1 sec bins | Bins with >0 counts | Bins with >2000 counts | High rate bins dominated by noise | Noise dominated (total time) | Noise dominated (detector-on time) | Marked lightcurve |
|---|---|---|---|---|---|---|---|
| A | 78539 | 66855 | 0 | 0 | 0.00% | 0.00% | 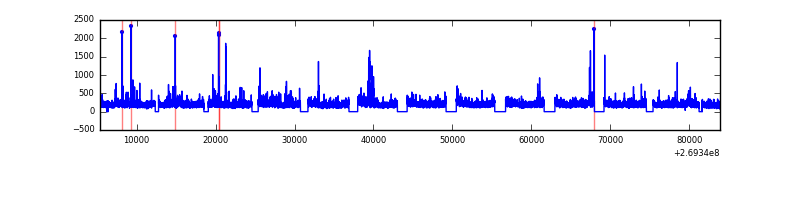 |
| B | 78539 | 66817 | 0 | 0 | 0.00% | 0.00% |  |
| C | 78539 | 66834 | 0 | 0 | 0.00% | 0.00% |  |
| D | 78539 | 66799 | 0 | 0 | 0.00% | 0.00% | 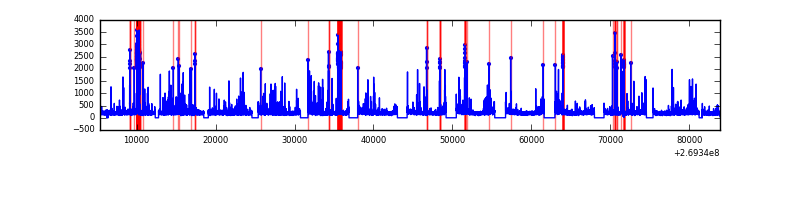 |
Top three noisy pixels from each quadrant. If the there are fewer than three noisy pixels in the level2.evt file, extra rows are filled as -1
| Pixel properties | Quadrant properties | ||||||
|---|---|---|---|---|---|---|---|
| Quadrant | DetID | PixID | Counts | Sigma | Mean | Median | Sigma |
| A | 0 | 29 | 3875 | 11.71 | 1009 | 943 | 250.4 |
| A | 7 | 110 | 3138 | 8.77 | 1009 | 943 | 250.4 |
| A | 0 | 30 | 2978 | 8.13 | 1009 | 943 | 250.4 |
| B | 2 | 9 | 3014 | 11.08 | 971 | 929 | 188.2 |
| B | 3 | 17 | 2540 | 8.56 | 971 | 929 | 188.2 |
| B | 14 | 254 | 2377 | 7.69 | 971 | 929 | 188.2 |
| C | 12 | 241 | 2722 | 7.04 | 989 | 922 | 255.6 |
| C | 3 | 126 | 2527 | 6.28 | 989 | 922 | 255.6 |
| C | 2 | 191 | 2470 | 6.06 | 989 | 922 | 255.6 |
| D | 3 | 14 | 2392 | 6.18 | 932 | 846 | 250.2 |
| D | 6 | 231 | 2375 | 6.11 | 932 | 846 | 250.2 |
| D | 10 | 189 | 2302 | 5.82 | 932 | 846 | 250.2 |
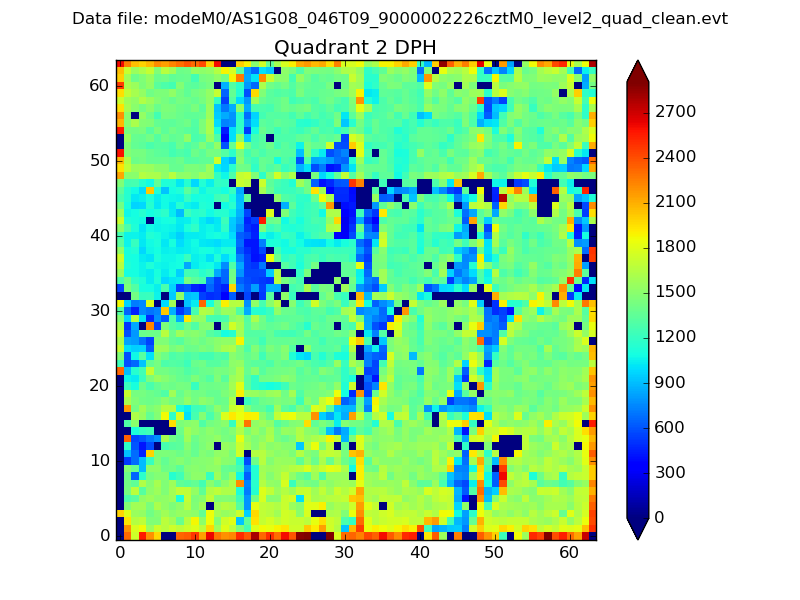
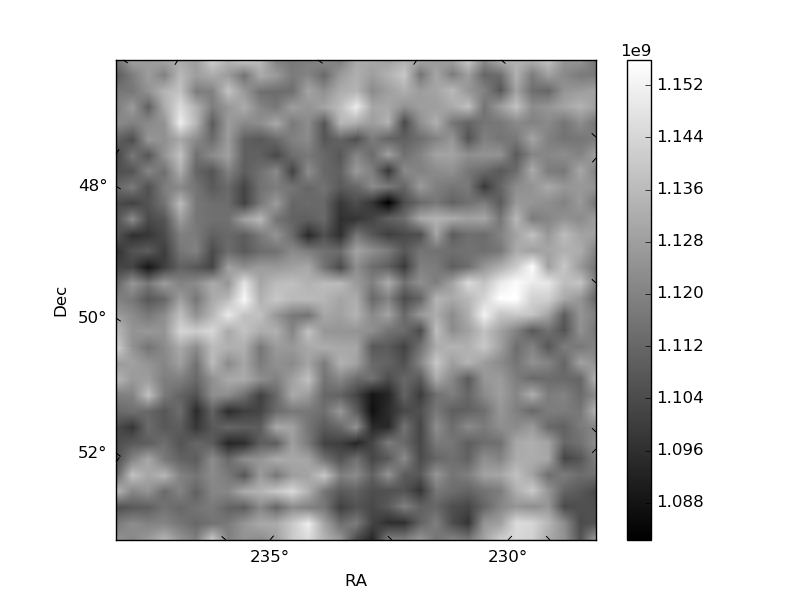
Histogram calculated using DETX and DETY for each event in the final _common_clean file
| Quadrant A | 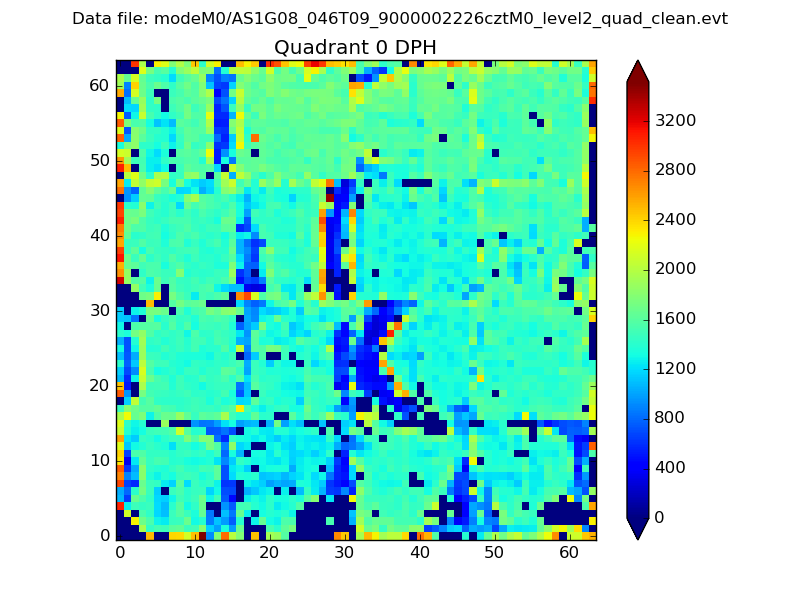 |
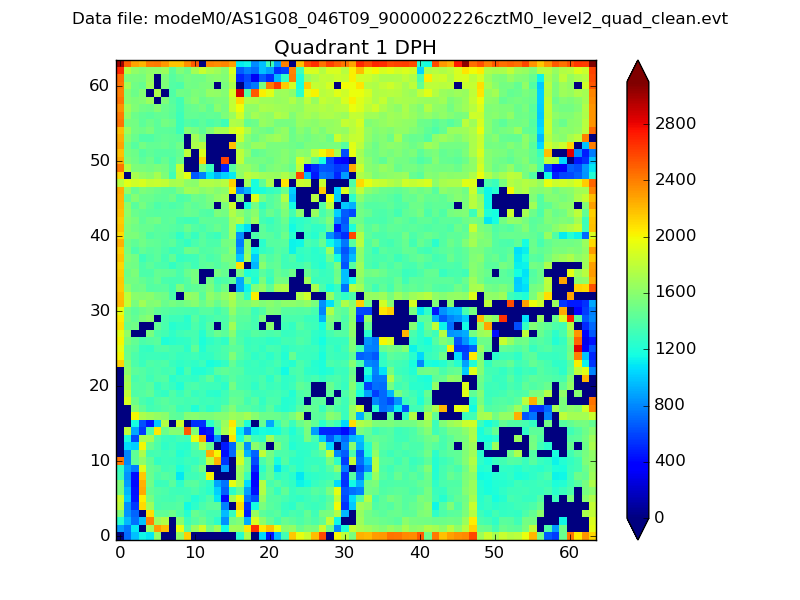 |
Quadrant B |
|---|---|---|---|
| Quadrant D |  |
 |
Quadrant C |
| Plot type | Count rate plots | Images |
|---|---|---|
| Comparison with Poisson distribution Blue bars denote a histogram of data divided into 1 sec bins. Red curve is a Poisson curve with rate = median count rate of data. |
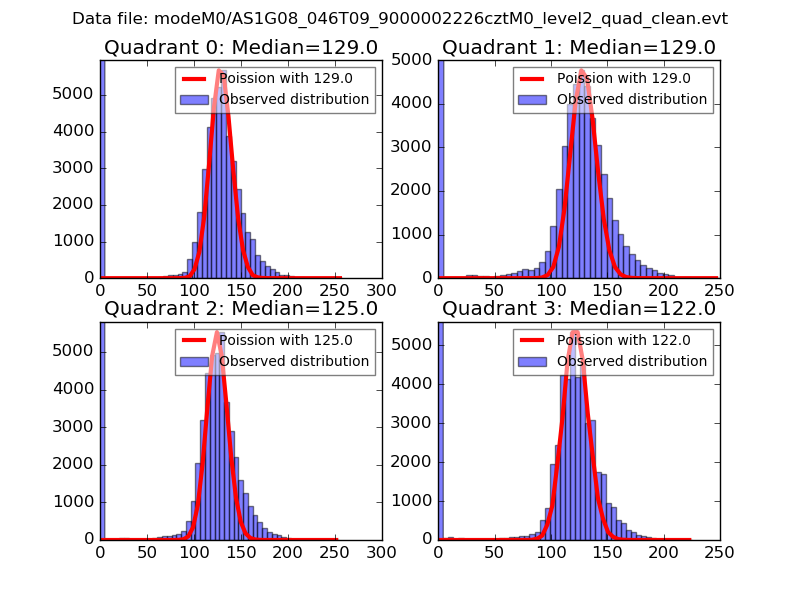 |
 |
| Quadrant-wise count rates Data is divided into 100 sec bins |
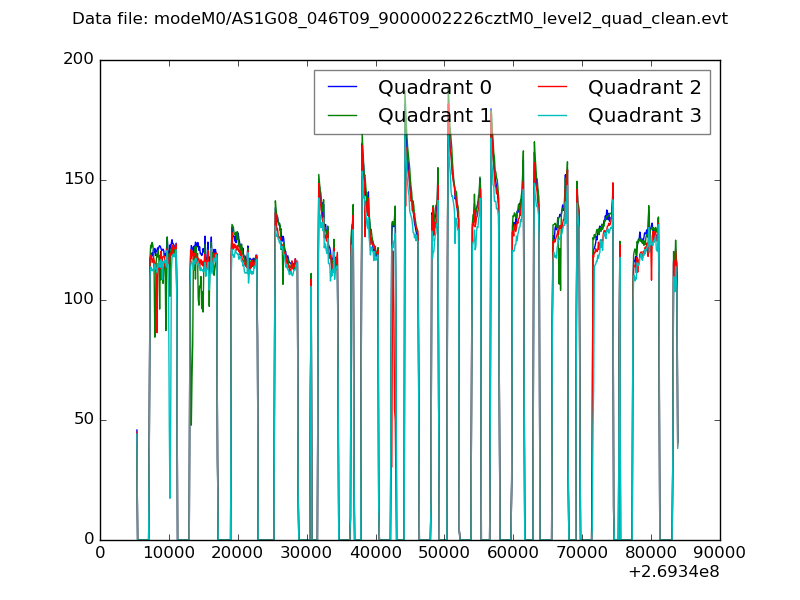 |
|
| Module-wise count rates for Quadrant A Data is divided into 100 sec bins |
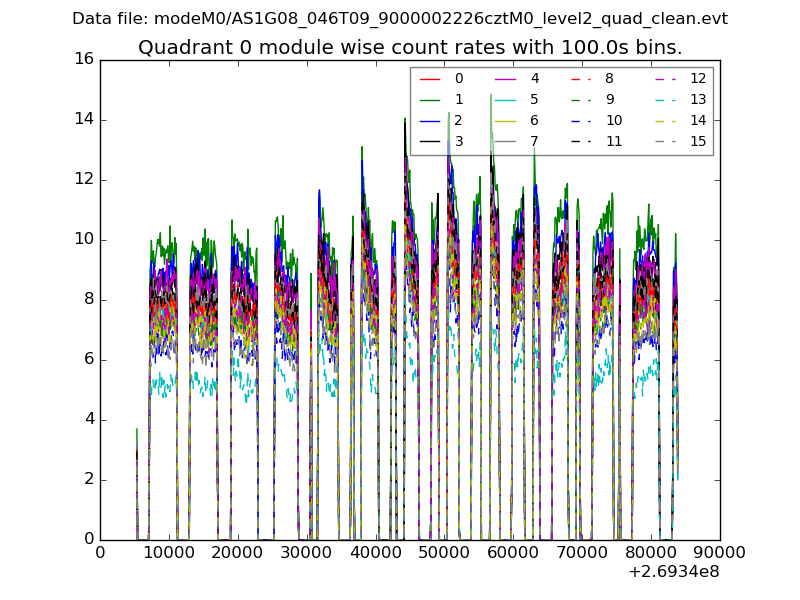 |
 |
| Module-wise count rates for Quadrant B Data is divided into 100 sec bins |
 |
 |
| Module-wise count rates for Quadrant C Data is divided into 100 sec bins |
 |
 |
| Module-wise count rates for Quadrant D Data is divided into 100 sec bins |
 |
 |
| Parameter | Plot |
|---|---|
| CZT HV Monitor | 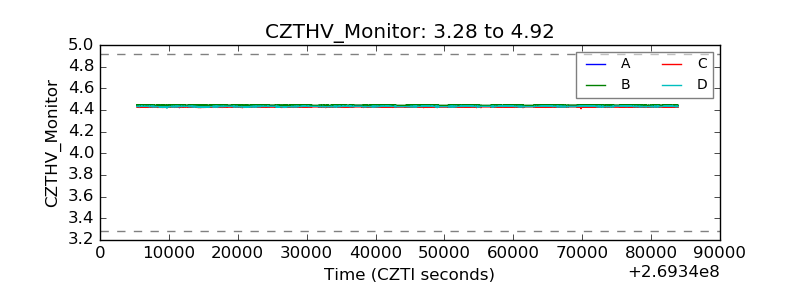 |
| D_VDD |  |
| Temperature 1 |  |
| Veto HV Monitor |  |
| Veto LLD |  |
| Alpha Counter |  |
| _CPM_Rate |  |
| CZT Counter |  |
| +2.5 Volts monitor |  |
| +5 Volts monitor |  |
| _ROLL_ROT | 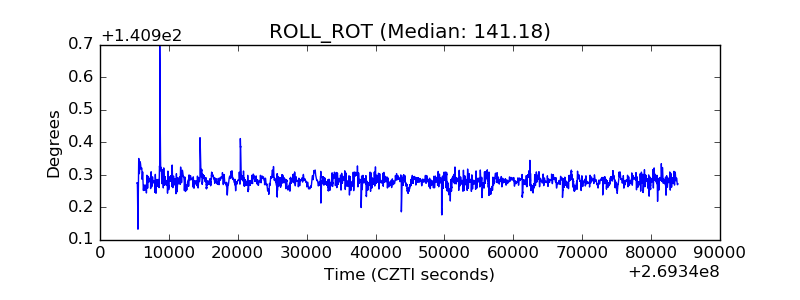 |
| _Roll_DEC |  |
| _Roll_RA |  |
| Veto Counter |  |