| Param | Original file | Final file |
|---|---|---|
| Filename | modeM0/AS1G08_046T09_9000002226_15116cztM0_level2.evt | modeM0/AS1G08_046T09_9000002226_15116cztM0_level2_quad_clean.evt |
| Size (bytes) | 242,213,760 | 20,047,680 |
| Size | 231.0 MB | 19.1 MB |
| Events in quadrant A | 1,320,506 | 107,509 |
| Events in quadrant B | 2,802,324 | 103,265 |
| Events in quadrant C | 1,788,838 | 105,229 |
| Events in quadrant D | 1,243,443 | 102,323 |
| Mode M0 | |||
|---|---|---|---|
| Quadrant | BADHDUFLAG | Total packets | Discarded packets |
| A | 0 | 5603 | 3 |
| B | 0 | 10023 | 2 |
| C | 0 | 7061 | 2 |
| D | 0 | 5545 | 2 |
| Mode SS | |||
|---|---|---|---|
| Quadrant | BADHDUFLAG | Total packets | Discarded packets |
| A | 0 | 54 | 0 |
| B | 0 | 54 | 0 |
| C | 0 | 54 | 0 |
| D | 0 | 54 | 0 |
| Quadrant | Total seconds | Saturated seconds | Saturation percentage |
|---|---|---|---|
| A | 2616 | 189 | 7.224771% |
| B | 2616 | 854 | 32.645260% |
| C | 2616 | 187 | 7.148318% |
| D | 2616 | 144 | 5.504587% |
Noise dominated data is calculated using 1-second bins in cleaned event files. If a bin has >2000 counts, and if more than 50% of those come from <1% of pixels, then it is considered to be noise-dominated and hence unusable.
| Quadrant | # 1 sec bins | Bins with >0 counts | Bins with >2000 counts | High rate bins dominated by noise | Noise dominated (total time) | Noise dominated (detector-on time) | Marked lightcurve |
|---|---|---|---|---|---|---|---|
| A | 2727 | 2619 | 0 | 0 | 0.00% | 0.00% | 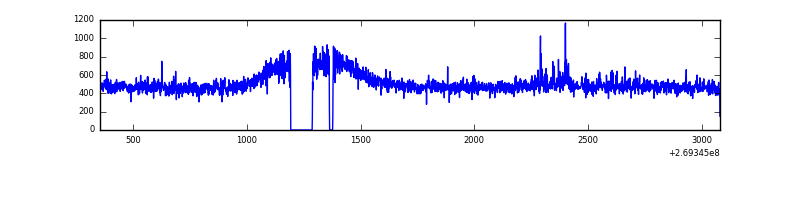 |
| B | 2726 | 2617 | 378 | 378 | 13.87% | 14.44% | 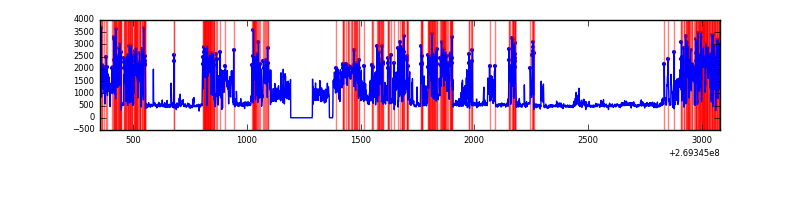 |
| C | 2727 | 2619 | 18 | 18 | 0.66% | 0.69% | 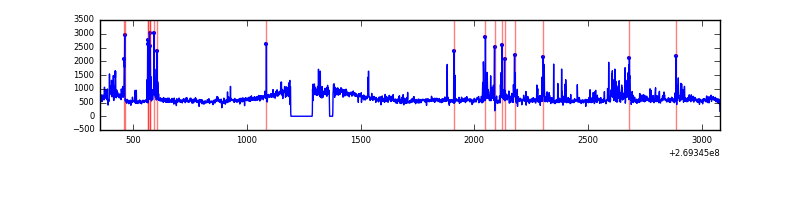 |
| D | 2727 | 2619 | 0 | 0 | 0.00% | 0.00% | 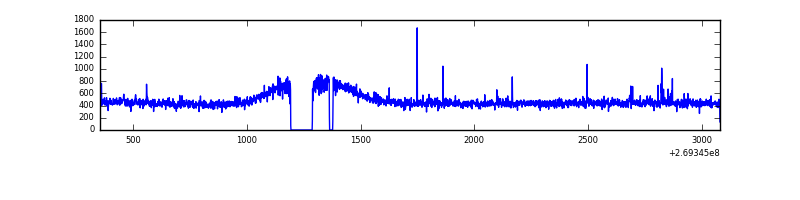 |
Top three noisy pixels from each quadrant. If the there are fewer than three noisy pixels in the level2.evt file, extra rows are filled as -1
| Pixel properties | Quadrant properties | ||||||
|---|---|---|---|---|---|---|---|
| Quadrant | DetID | PixID | Counts | Sigma | Mean | Median | Sigma |
| A | 15 | 69 | 20200 | 283.11 | 336 | 327 | 70.2 |
| A | 12 | 189 | 7387 | 100.58 | 336 | 327 | 70.2 |
| A | 0 | 226 | 3012 | 38.25 | 336 | 327 | 70.2 |
| B | 10 | 245 | 1552440 | 25982.45 | 299 | 290 | 59.7 |
| B | 3 | 64 | 45008 | 748.56 | 299 | 290 | 59.7 |
| B | 4 | 48 | 11912 | 194.55 | 299 | 290 | 59.7 |
| C | 3 | 233 | 287730 | 3772.24 | 322 | 322 | 76.2 |
| C | 4 | 254 | 235283 | 3083.88 | 322 | 322 | 76.2 |
| C | 3 | 234 | 2485 | 28.39 | 322 | 322 | 76.2 |
| D | 2 | 234 | 9653 | 114.99 | 325 | 313 | 81.2 |
| D | 13 | 104 | 4054 | 46.06 | 325 | 313 | 81.2 |
| D | 13 | 249 | 3420 | 38.25 | 325 | 313 | 81.2 |
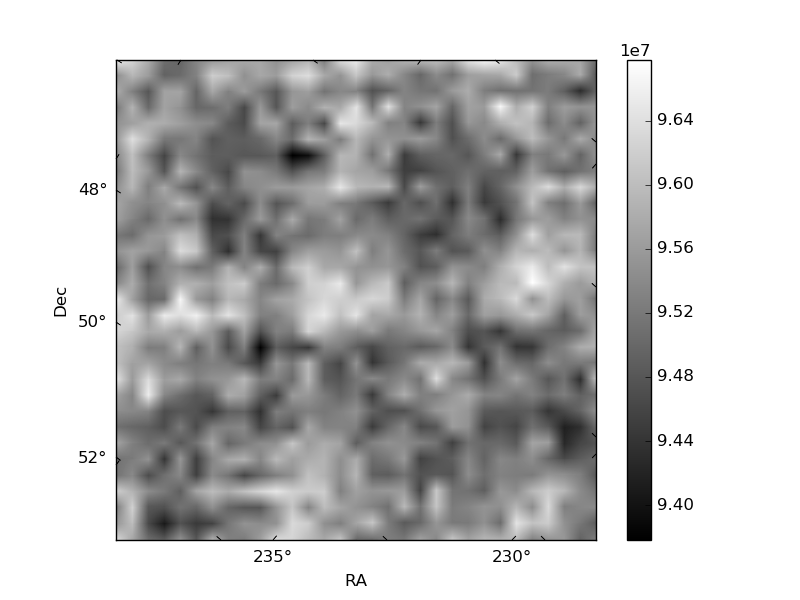
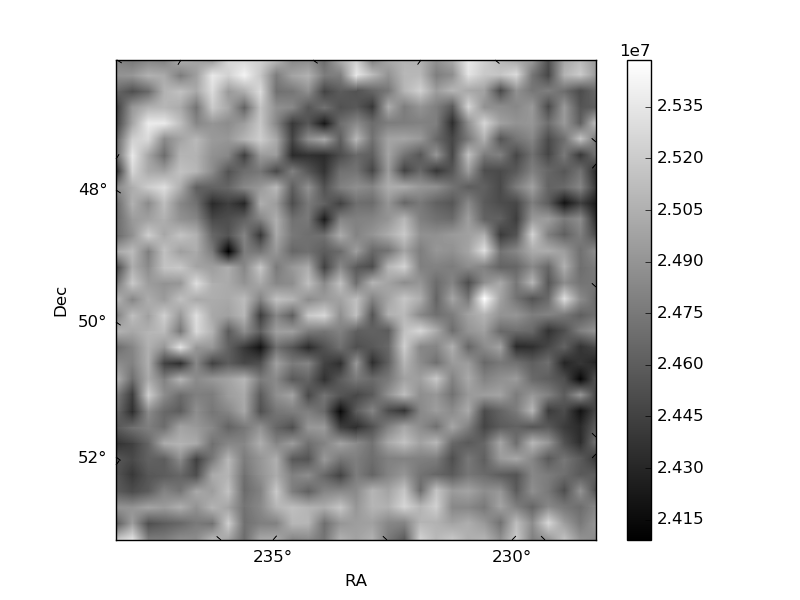
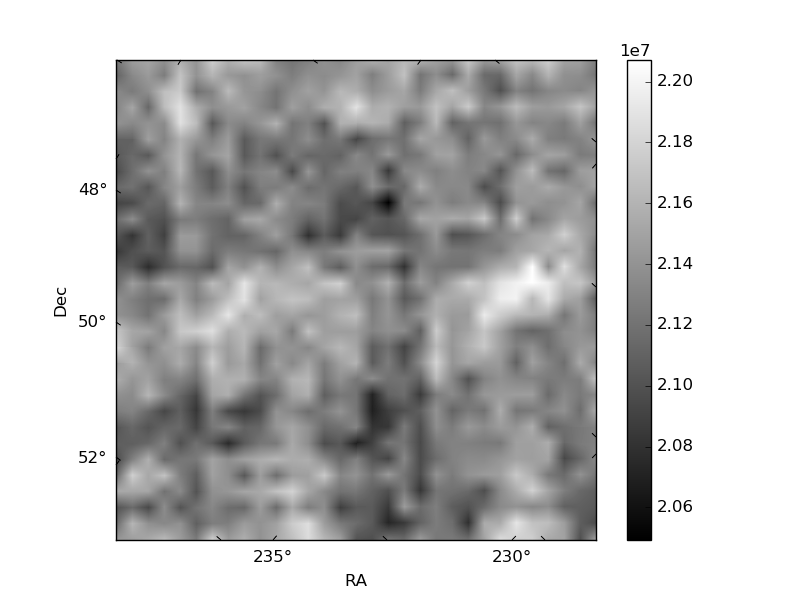
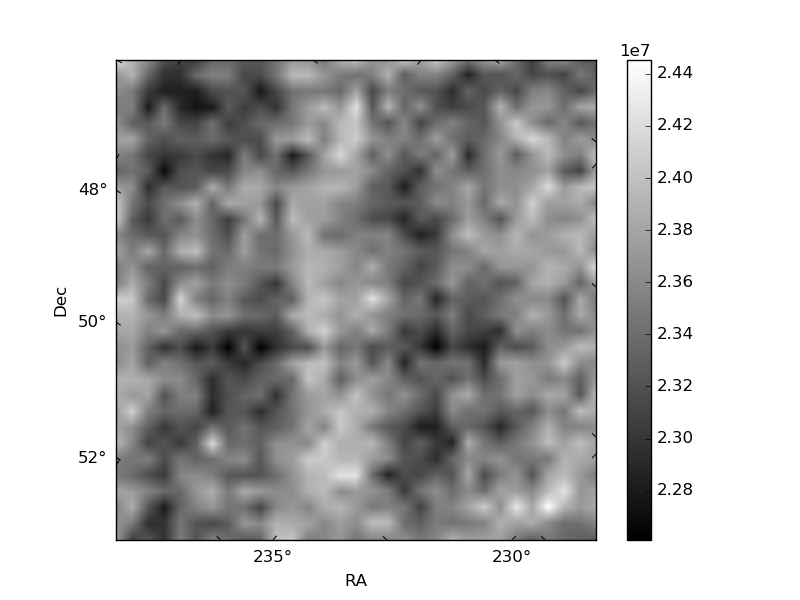
Histogram calculated using DETX and DETY for each event in the final _common_clean file
| Quadrant A | 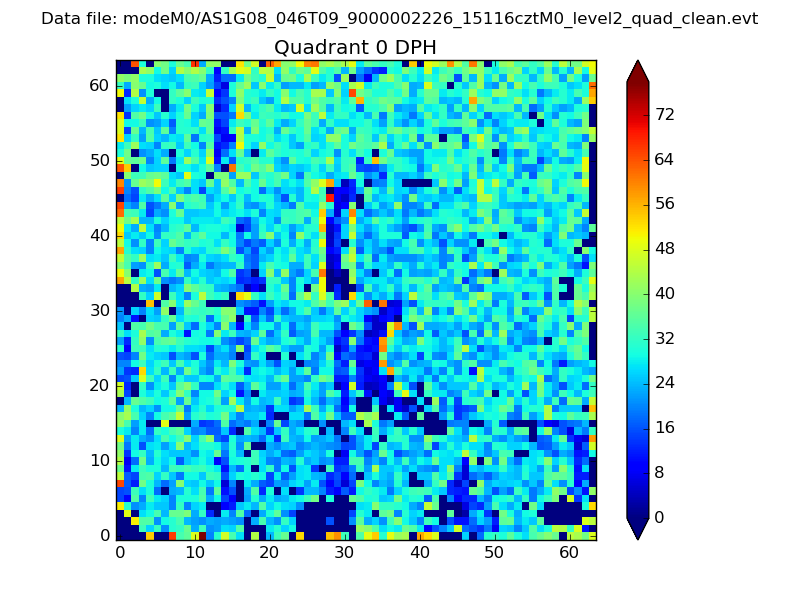 |
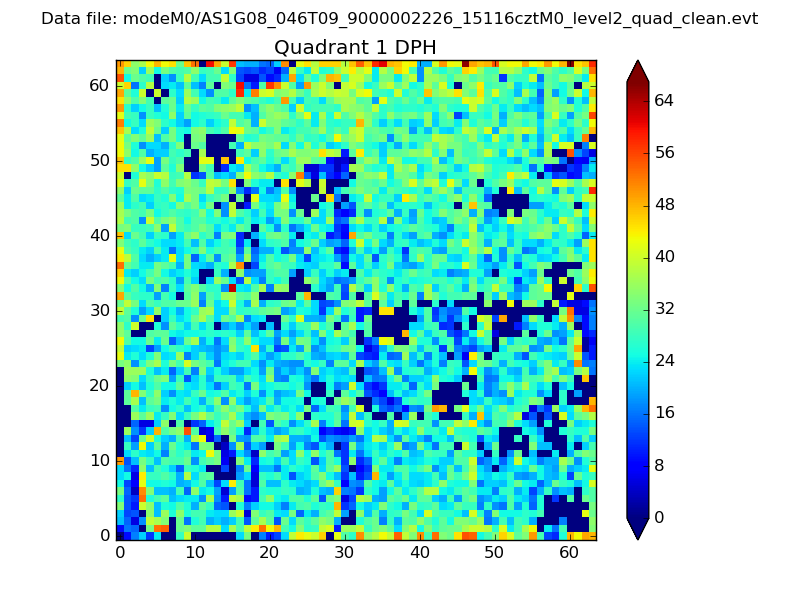 |
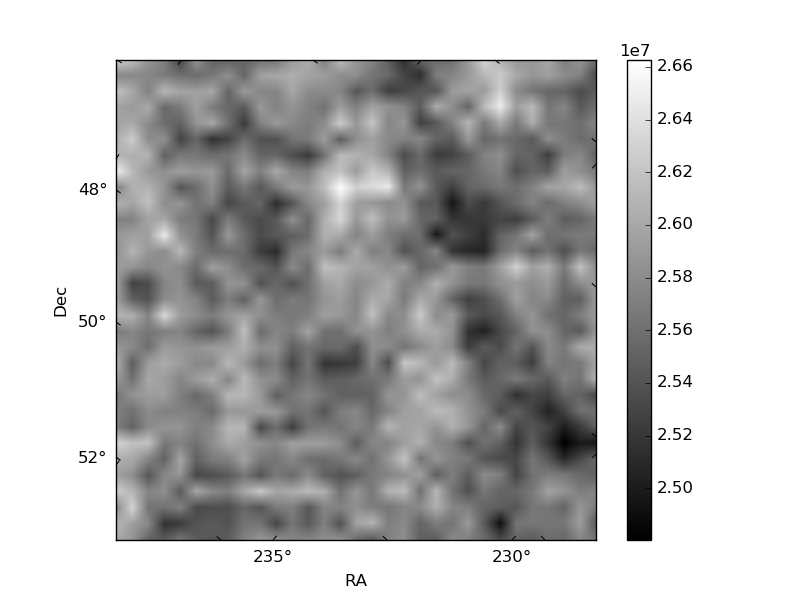
Quadrant B |
|---|---|---|---|
| Quadrant D | 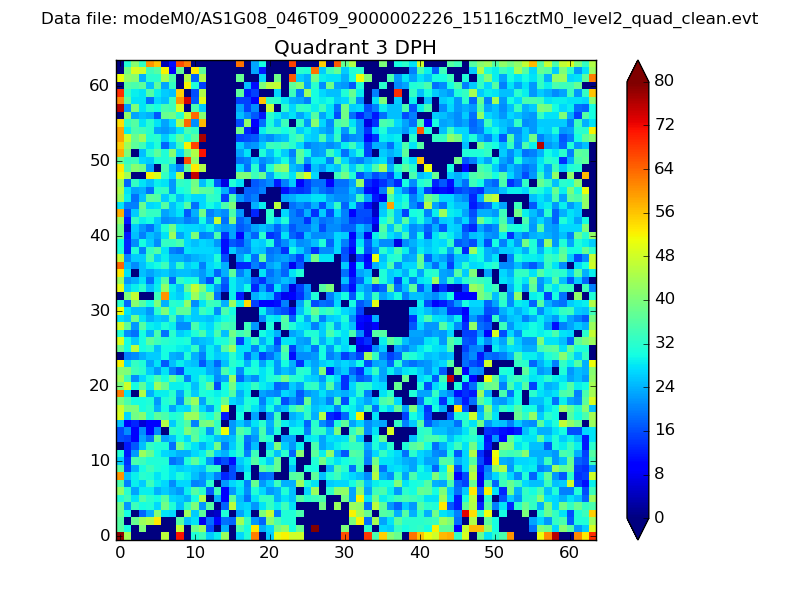 |
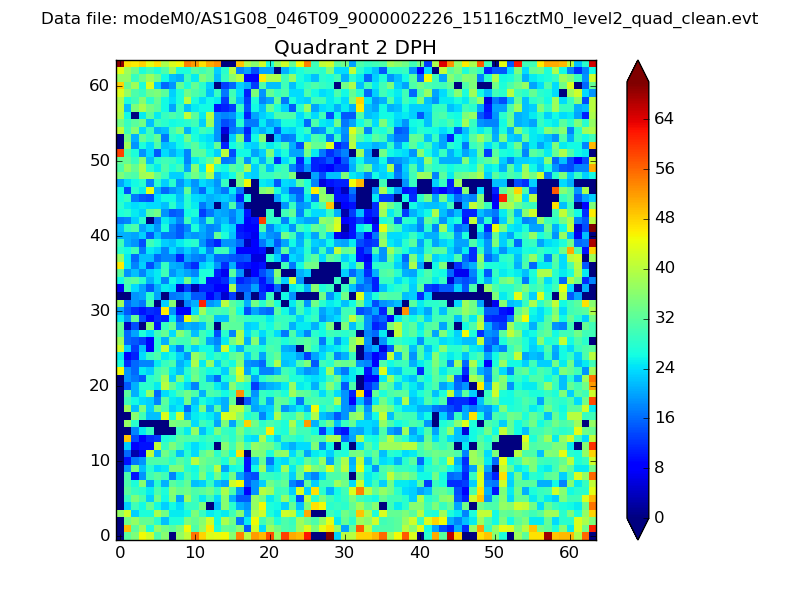 |
Quadrant C |
| Plot type | Count rate plots | Images |
|---|---|---|
| Comparison with Poisson distribution Blue bars denote a histogram of data divided into 1 sec bins. Red curve is a Poisson curve with rate = median count rate of data. |
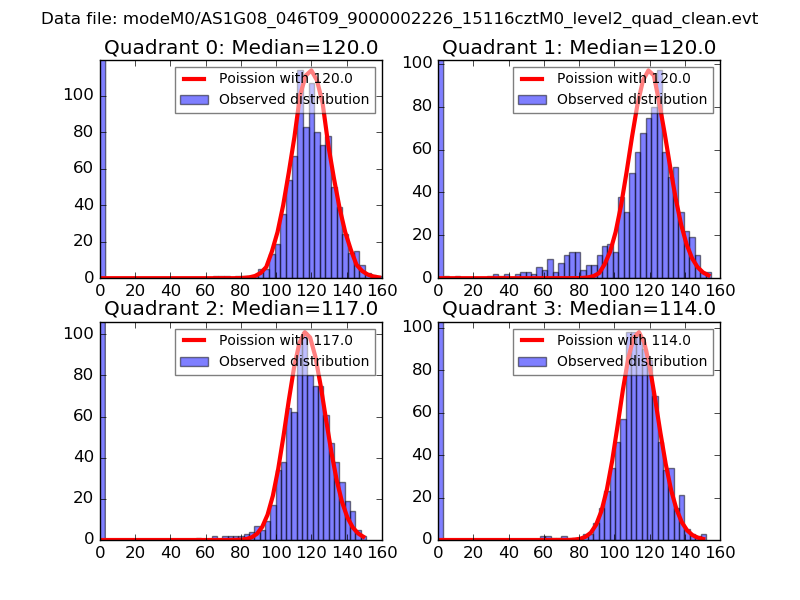 |
 |
| Quadrant-wise count rates Data is divided into 100 sec bins |
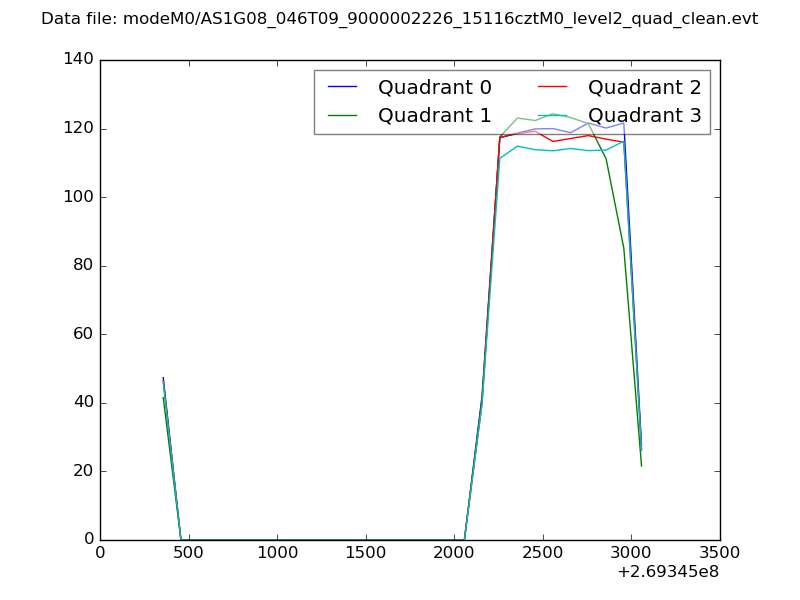 |
|
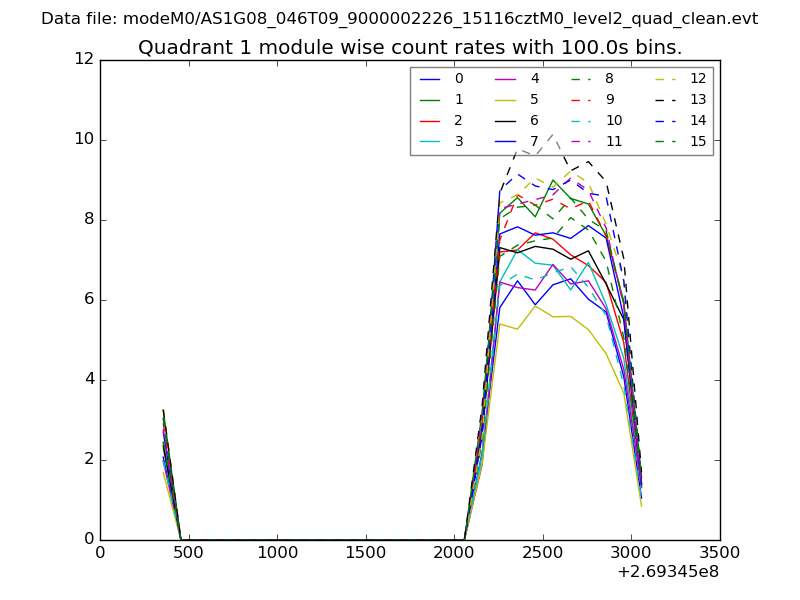
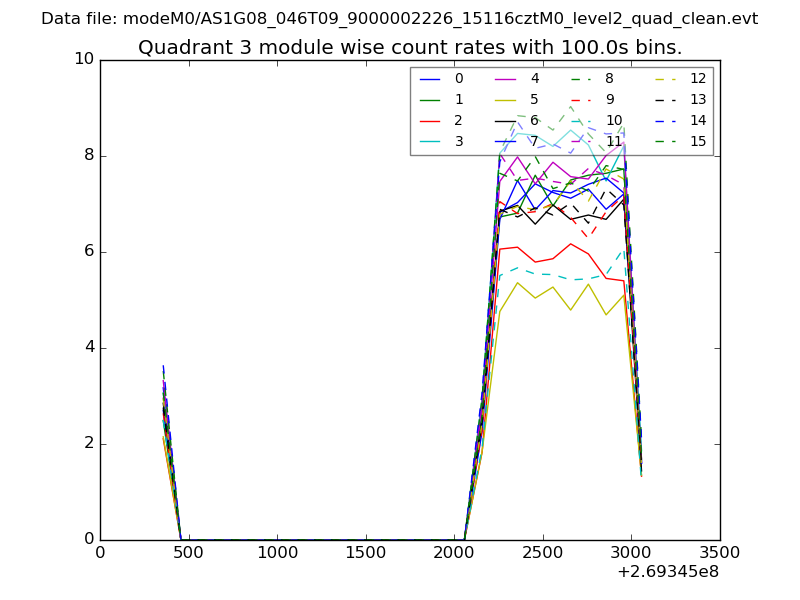
| Module-wise count rates for Quadrant A Data is divided into 100 sec bins |
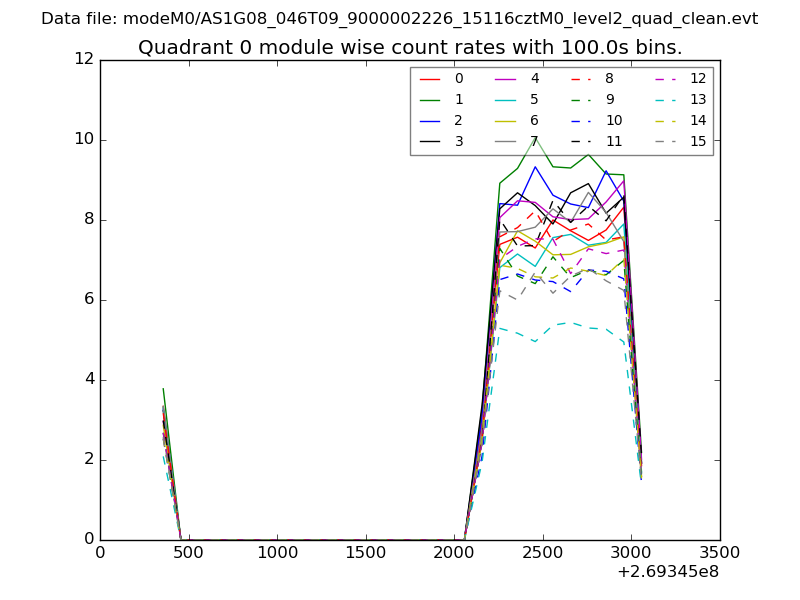 |
 |
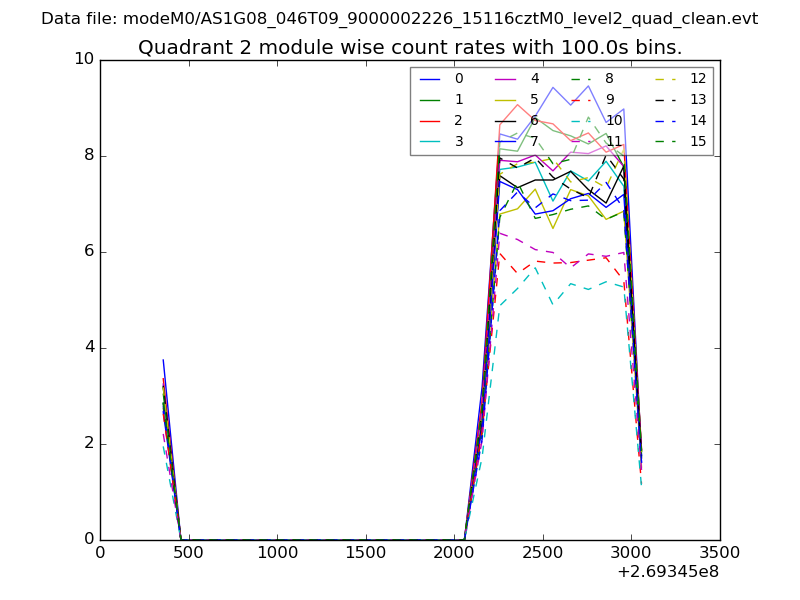
| Module-wise count rates for Quadrant B Data is divided into 100 sec bins |
 |
 |
| Module-wise count rates for Quadrant C Data is divided into 100 sec bins |
 |
 |
| Module-wise count rates for Quadrant D Data is divided into 100 sec bins |
 |
 |
| Parameter | Plot |
|---|---|
| CZT HV Monitor | 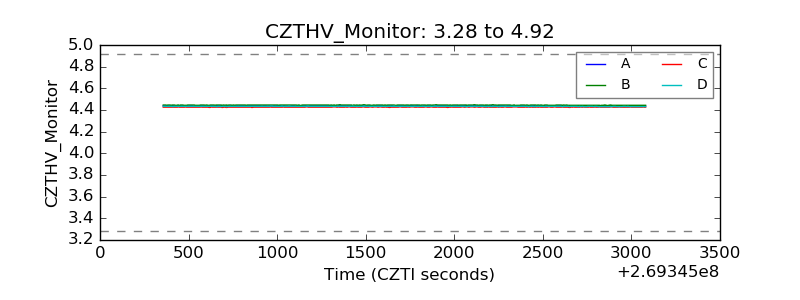 |
| D_VDD | 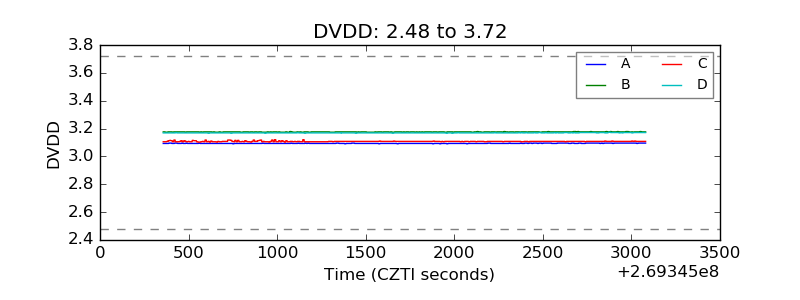 |
| Temperature 1 | 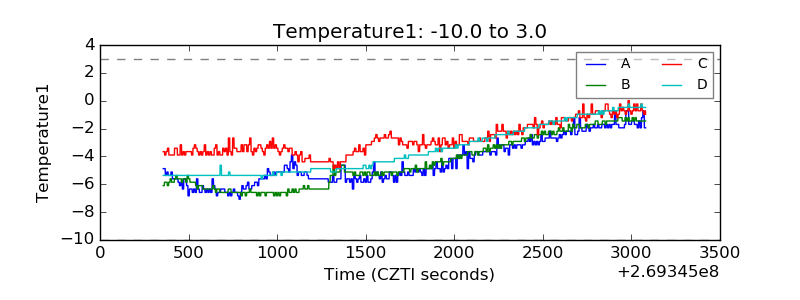 |
| Veto HV Monitor | 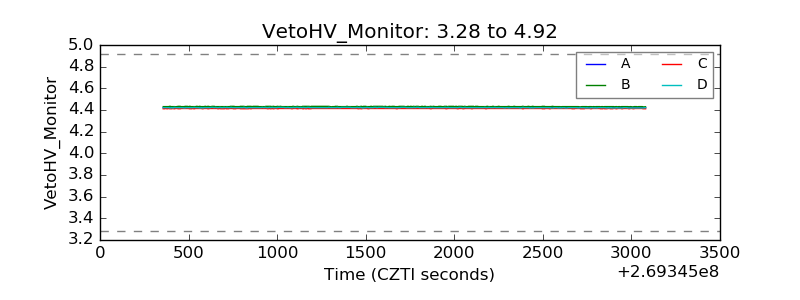 |
| Veto LLD | 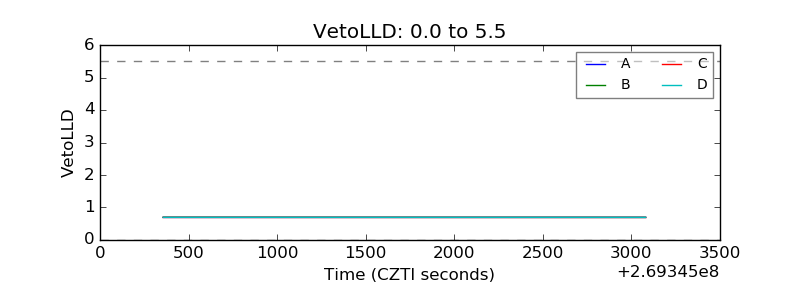 |
| Alpha Counter | 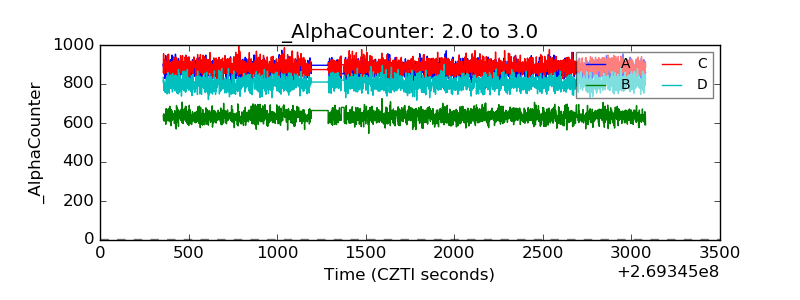 |
| _CPM_Rate | 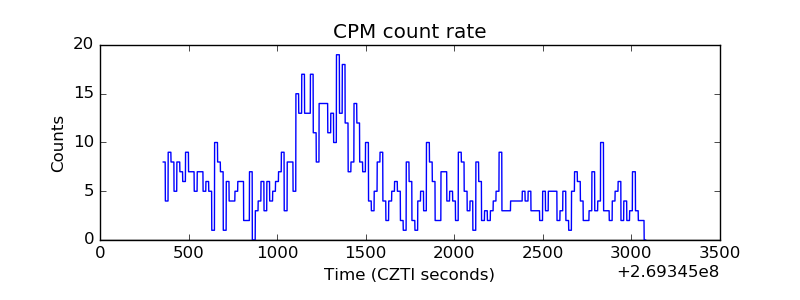 |
| CZT Counter | 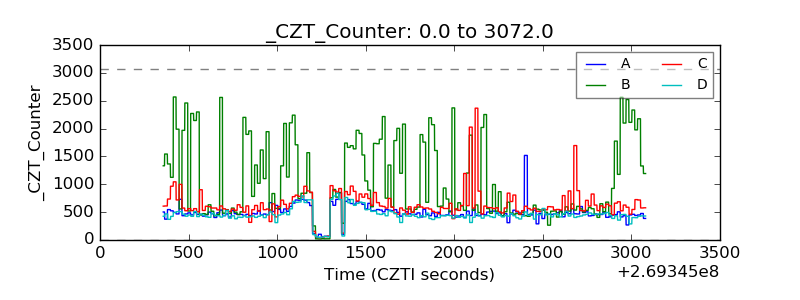 |
| +2.5 Volts monitor |  |
| +5 Volts monitor |  |
| _ROLL_ROT | 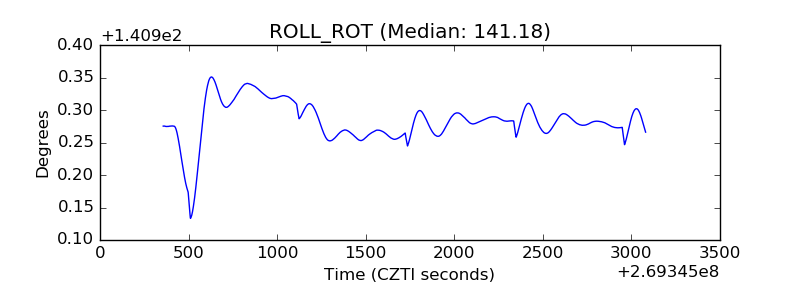 |
| _Roll_DEC | 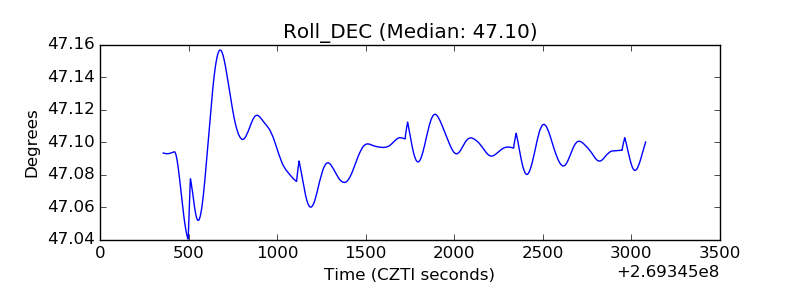 |
| _Roll_RA | 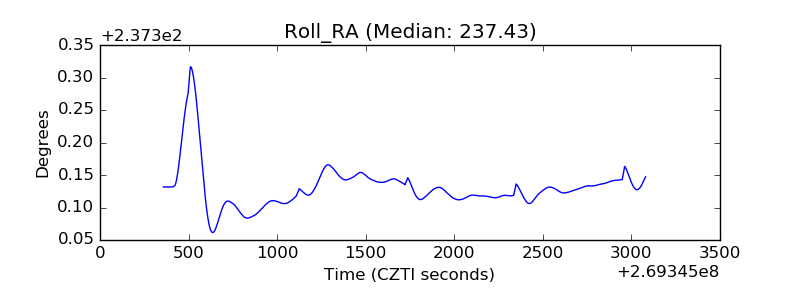 |
| Veto Counter | 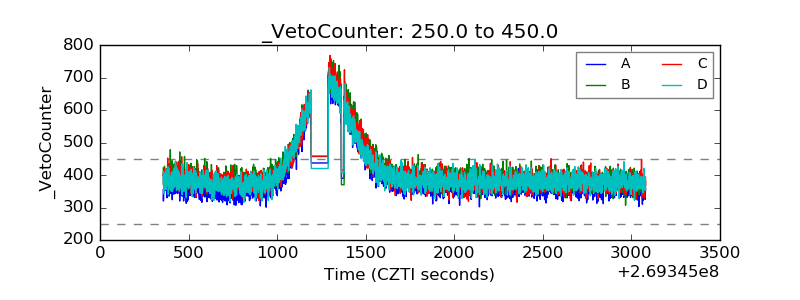 |