| Param | Original file | Final file |
|---|---|---|
| Filename | modeM0/AS1G08_046T09_9000002226_15117cztM0_level2.evt | modeM0/AS1G08_046T09_9000002226_15117cztM0_level2_quad_clean.evt |
| Size (bytes) | 672,860,160 | 98,510,400 |
| Size | 641.7 MB | 93.9 MB |
| Events in quadrant A | 3,637,320 | 645,826 |
| Events in quadrant B | 6,787,818 | 593,952 |
| Events in quadrant C | 5,148,776 | 623,739 |
| Events in quadrant D | 4,287,436 | 589,049 |
| Mode M0 | |||
|---|---|---|---|
| Quadrant | BADHDUFLAG | Total packets | Discarded packets |
| A | 0 | 15820 | 3 |
| B | 0 | 25172 | 2 |
| C | 0 | 20758 | 2 |
| D | 0 | 18130 | 2 |
| Mode M9 | |||
|---|---|---|---|
| Quadrant | BADHDUFLAG | Total packets | Discarded packets |
| A | 0 | 4 | 0 |
| B | 0 | 4 | 0 |
| C | 0 | 4 | 0 |
| D | 0 | 4 | 0 |
| Mode SS | |||
|---|---|---|---|
| Quadrant | BADHDUFLAG | Total packets | Discarded packets |
| A | 0 | 154 | 0 |
| B | 0 | 154 | 0 |
| C | 0 | 154 | 0 |
| D | 0 | 154 | 0 |
| Quadrant | Total seconds | Saturated seconds | Saturation percentage |
|---|---|---|---|
| A | 7622 | 144 | 1.889268% |
| B | 7622 | 1266 | 16.609814% |
| C | 7622 | 237 | 3.109420% |
| D | 7622 | 420 | 5.510365% |
Noise dominated data is calculated using 1-second bins in cleaned event files. If a bin has >2000 counts, and if more than 50% of those come from <1% of pixels, then it is considered to be noise-dominated and hence unusable.
| Quadrant | # 1 sec bins | Bins with >0 counts | Bins with >2000 counts | High rate bins dominated by noise | Noise dominated (total time) | Noise dominated (detector-on time) | Marked lightcurve |
|---|---|---|---|---|---|---|---|
| A | 8063 | 7625 | 5 | 5 | 0.06% | 0.07% | 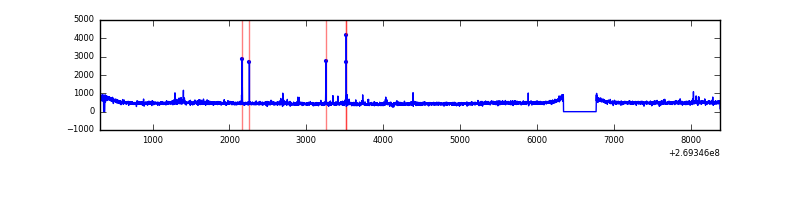 |
| B | 8063 | 7625 | 828 | 828 | 10.27% | 10.86% | 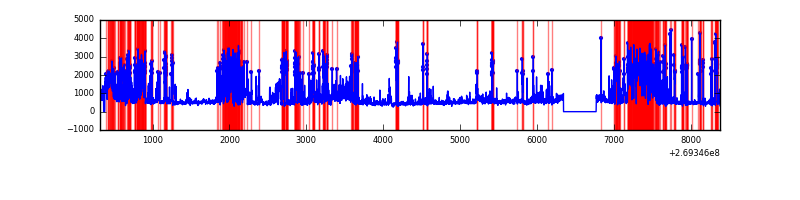 |
| C | 8063 | 7625 | 85 | 85 | 1.05% | 1.11% | 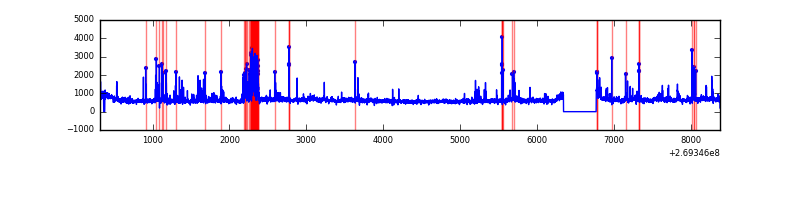 |
| D | 8063 | 7625 | 329 | 329 | 4.08% | 4.31% | 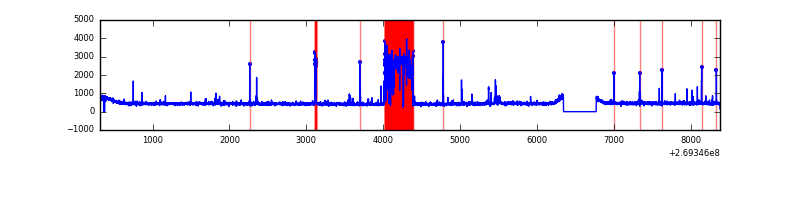 |
Top three noisy pixels from each quadrant. If the there are fewer than three noisy pixels in the level2.evt file, extra rows are filled as -1
| Pixel properties | Quadrant properties | ||||||
|---|---|---|---|---|---|---|---|
| Quadrant | DetID | PixID | Counts | Sigma | Mean | Median | Sigma |
| A | 12 | 189 | 52215 | 276.67 | 911 | 893 | 185.5 |
| A | 13 | 248 | 44928 | 237.39 | 911 | 893 | 185.5 |
| A | 15 | 69 | 18443 | 94.61 | 911 | 893 | 185.5 |
| B | 10 | 245 | 3031056 | 18739.4 | 844 | 822 | 161.7 |
| B | 3 | 64 | 338554 | 2088.58 | 844 | 822 | 161.7 |
| B | 0 | 190 | 24206 | 144.61 | 844 | 822 | 161.7 |
| C | 3 | 233 | 1175943 | 5807.92 | 875 | 878 | 202.3 |
| C | 4 | 254 | 531986 | 2625.07 | 875 | 878 | 202.3 |
| C | 3 | 234 | 7349 | 31.98 | 875 | 878 | 202.3 |
| D | 1 | 255 | 857708 | 4031.48 | 867 | 842 | 212.5 |
| D | 9 | 85 | 32991 | 151.26 | 867 | 842 | 212.5 |
| D | 2 | 234 | 29976 | 137.07 | 867 | 842 | 212.5 |
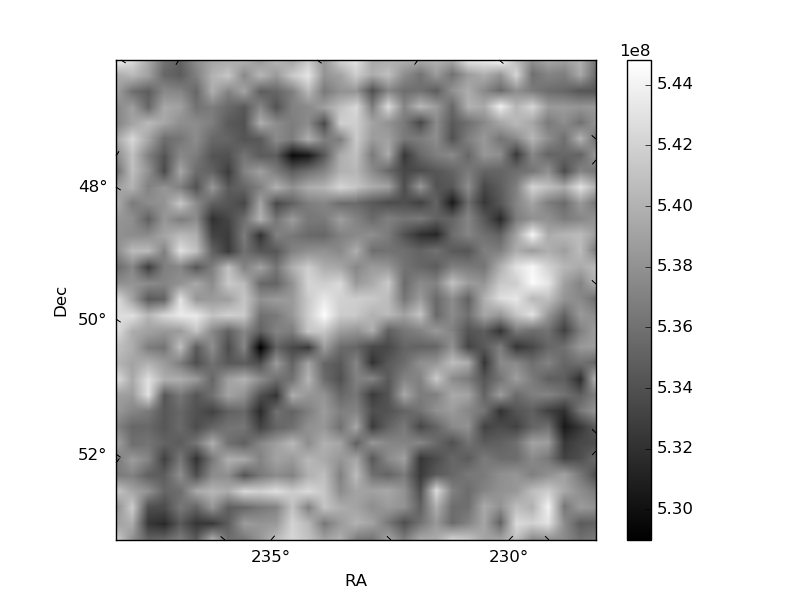
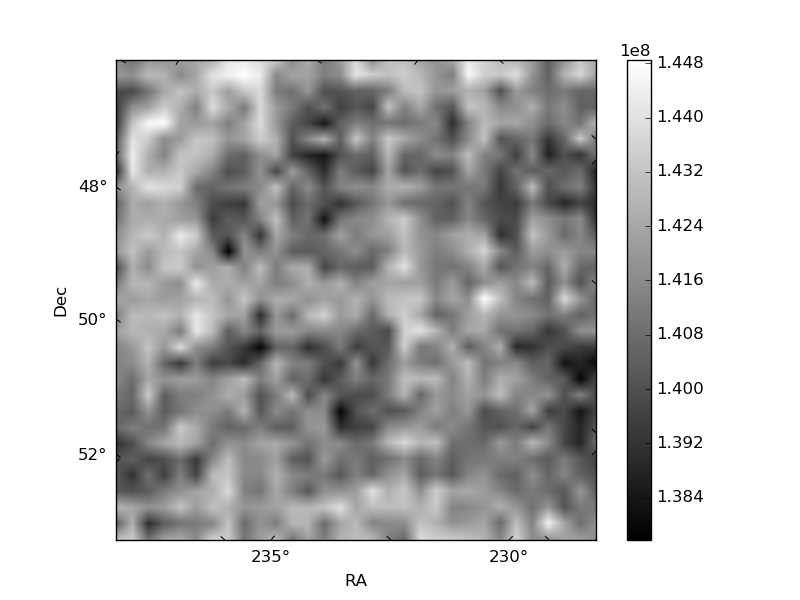
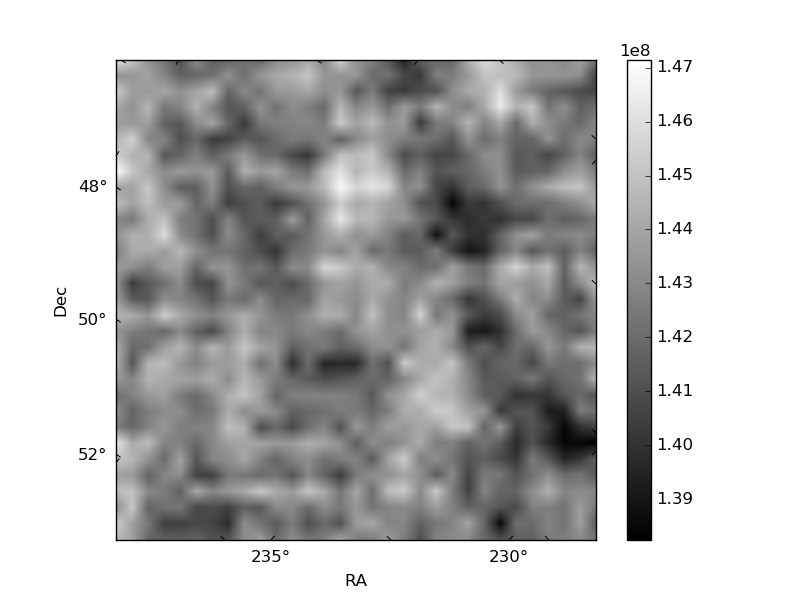
Histogram calculated using DETX and DETY for each event in the final _common_clean file
| Quadrant A | 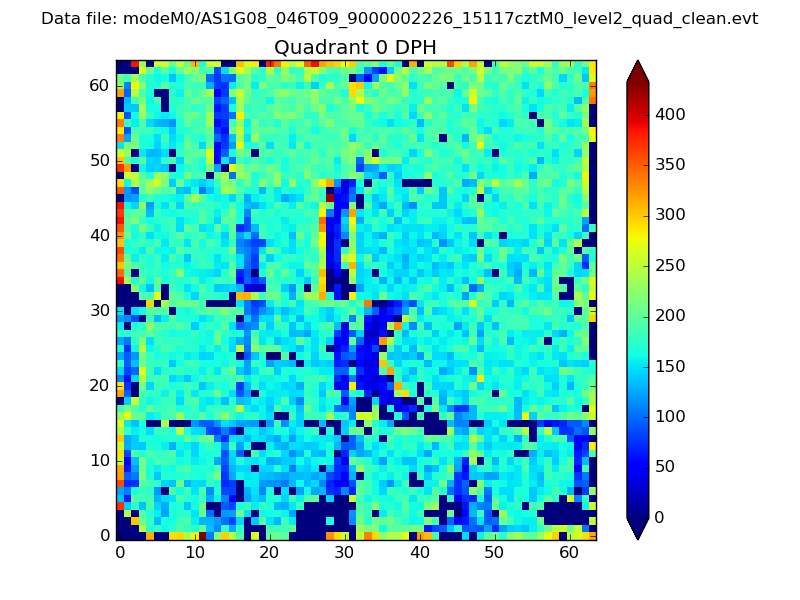 |
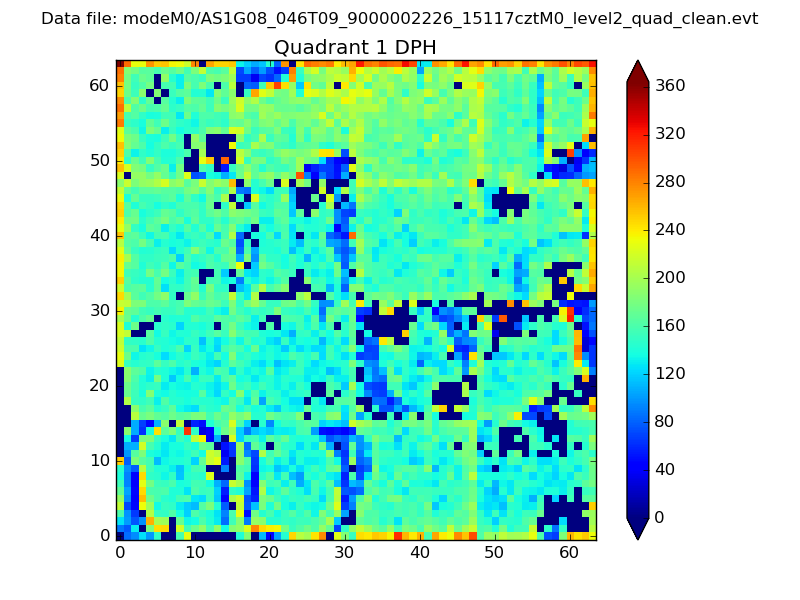 |
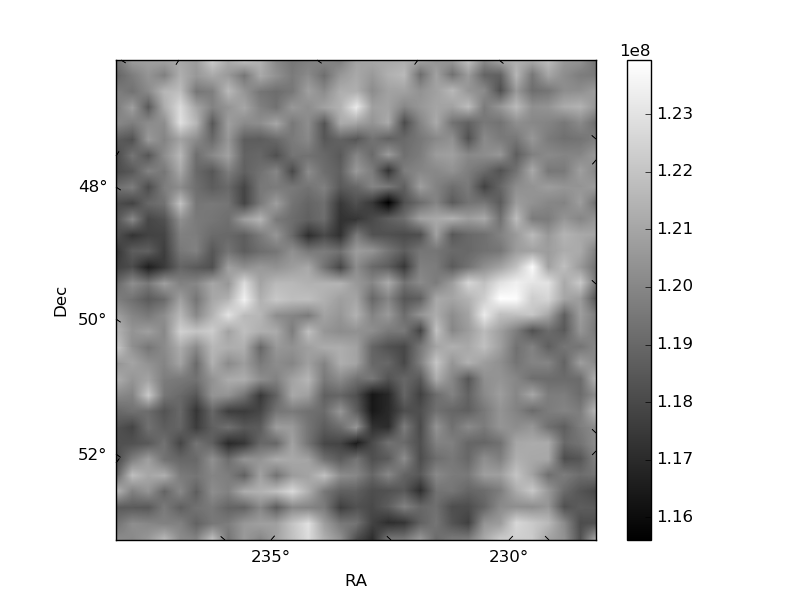
Quadrant B |
|---|---|---|---|
| Quadrant D |  |
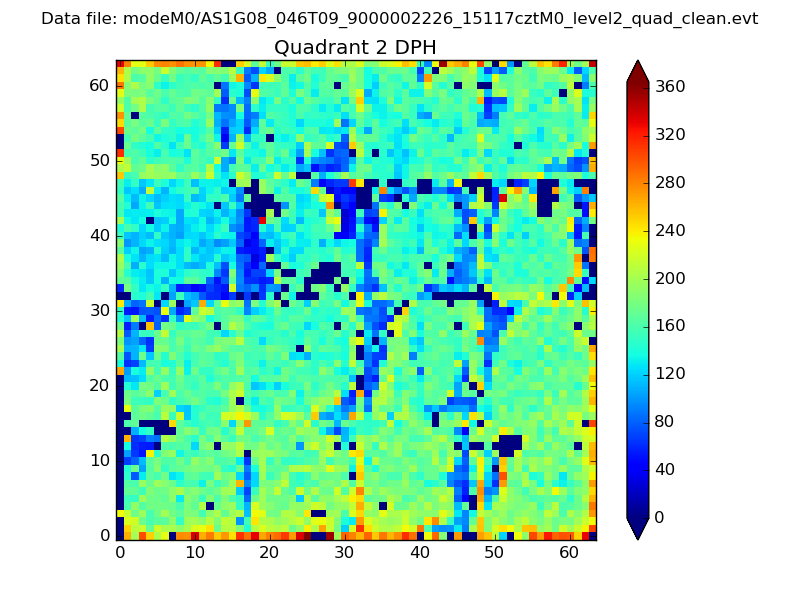 |
Quadrant C |
| Plot type | Count rate plots | Images |
|---|---|---|
| Comparison with Poisson distribution Blue bars denote a histogram of data divided into 1 sec bins. Red curve is a Poisson curve with rate = median count rate of data. |
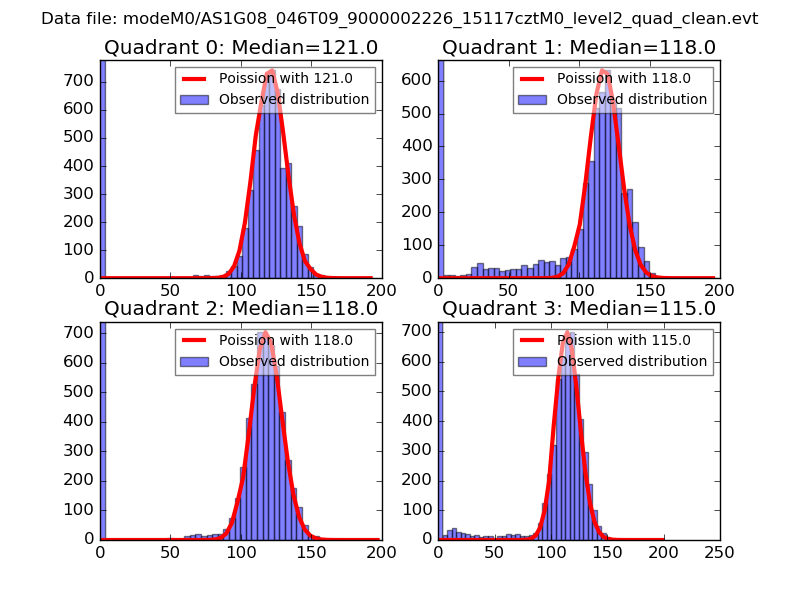 |
 |
| Quadrant-wise count rates Data is divided into 100 sec bins |
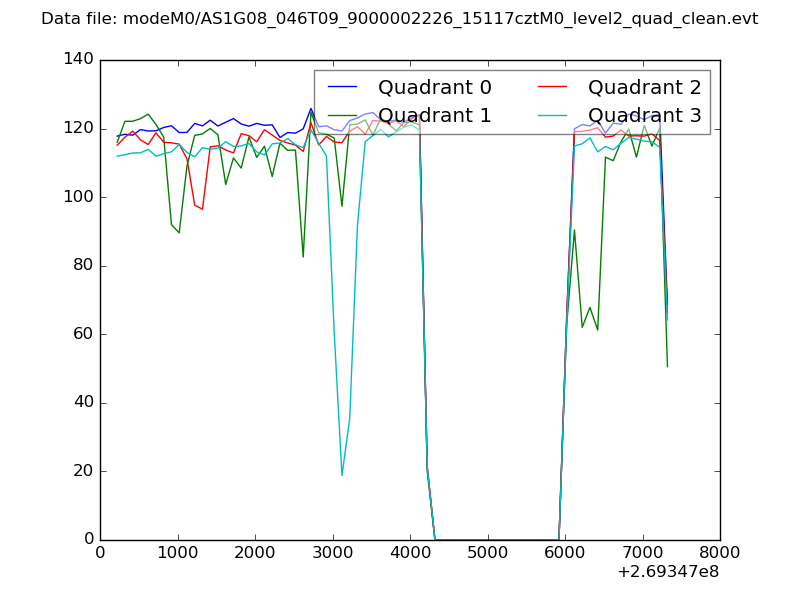 |
|
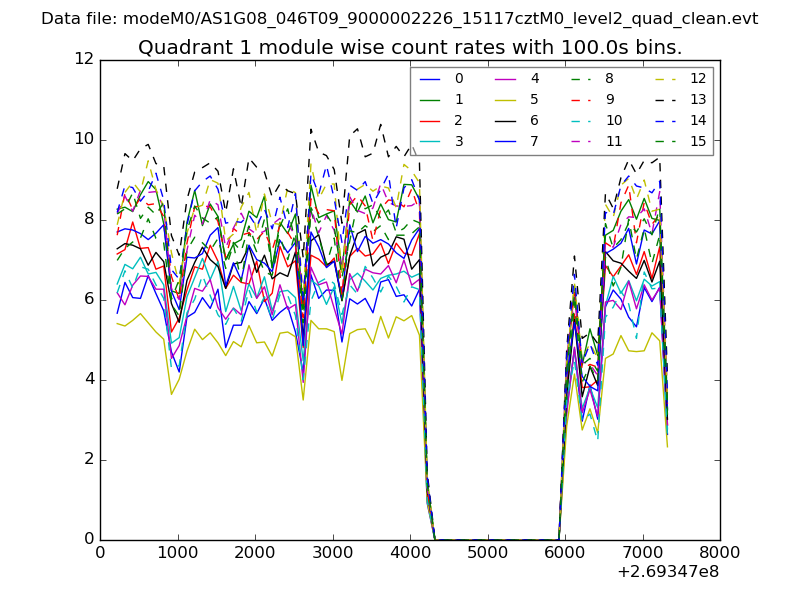
| Module-wise count rates for Quadrant A Data is divided into 100 sec bins |
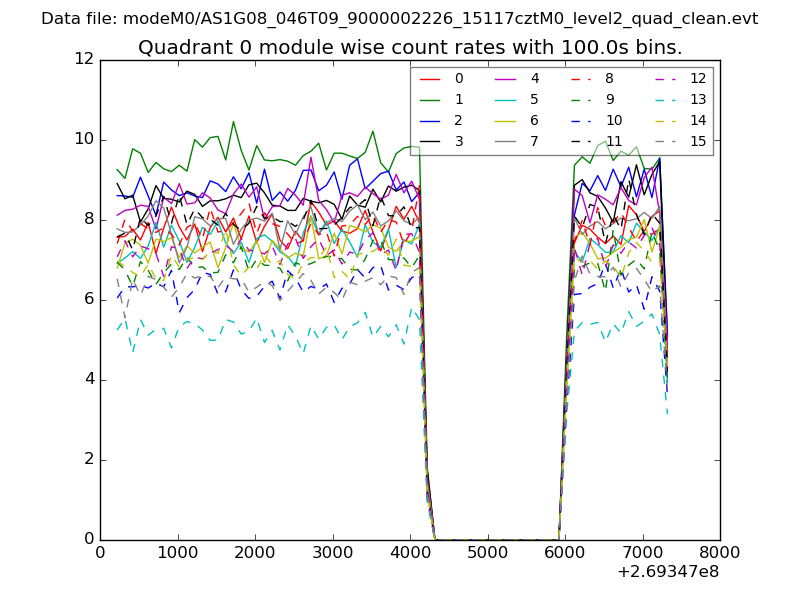 |
 |
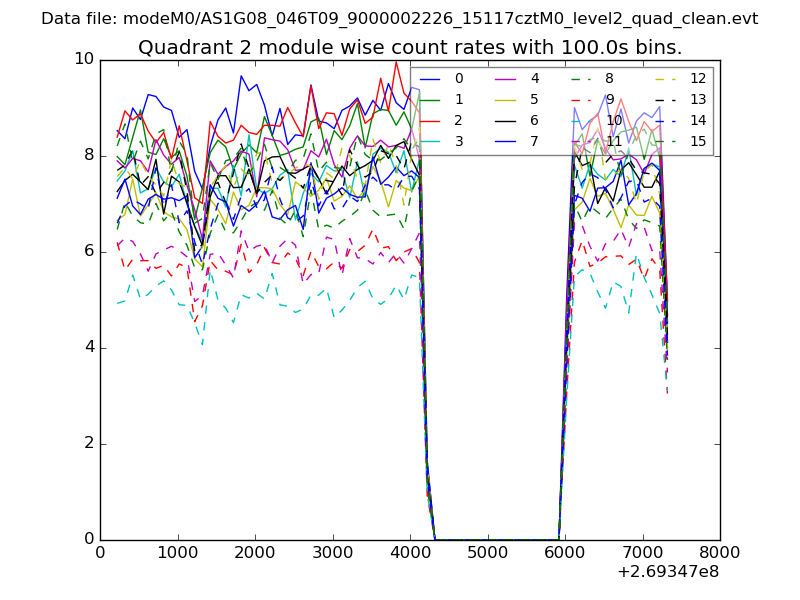
| Module-wise count rates for Quadrant B Data is divided into 100 sec bins |
 |
 |
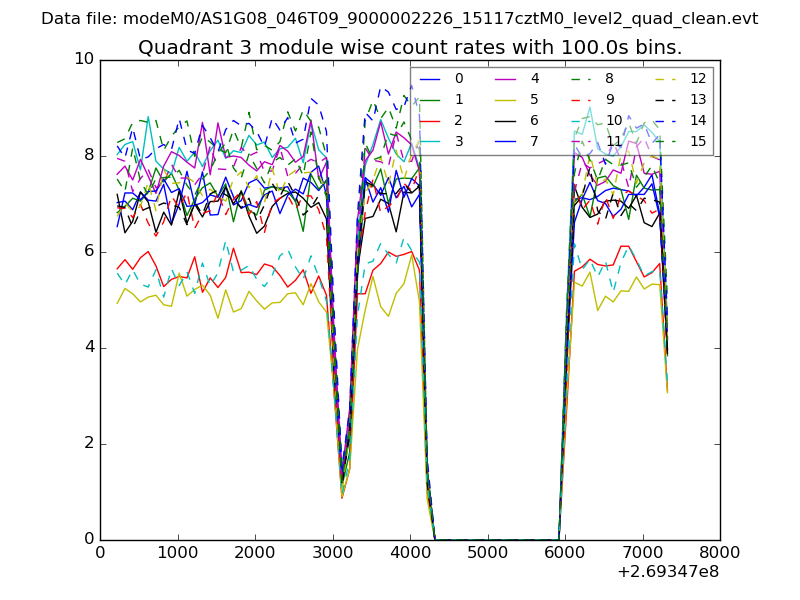
| Module-wise count rates for Quadrant C Data is divided into 100 sec bins |
 |
 |
| Module-wise count rates for Quadrant D Data is divided into 100 sec bins |
 |
 |
| Parameter | Plot |
|---|---|
| CZT HV Monitor | 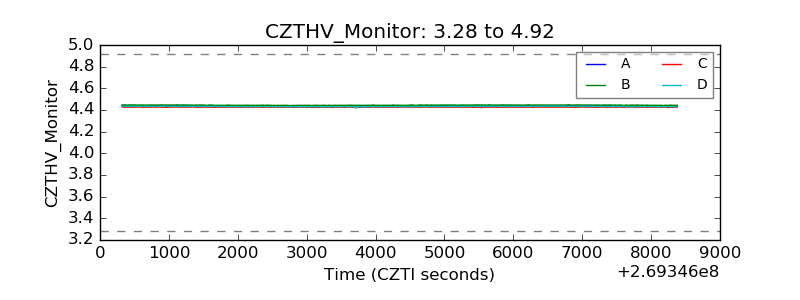 |
| D_VDD | 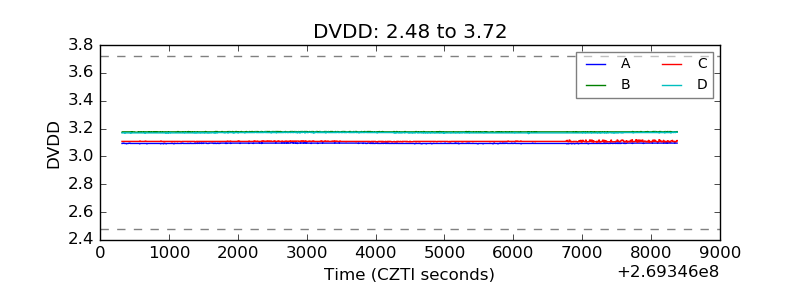 |
| Temperature 1 | 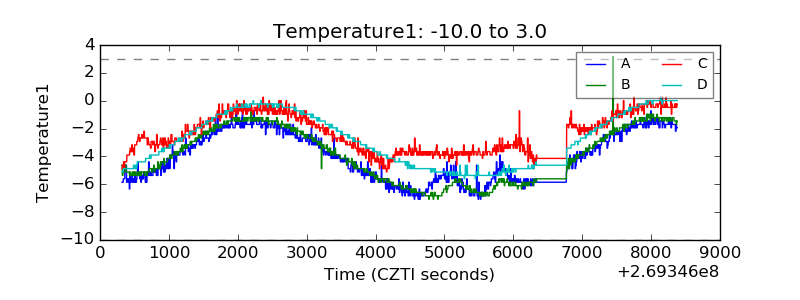 |
| Veto HV Monitor |  |
| Veto LLD | 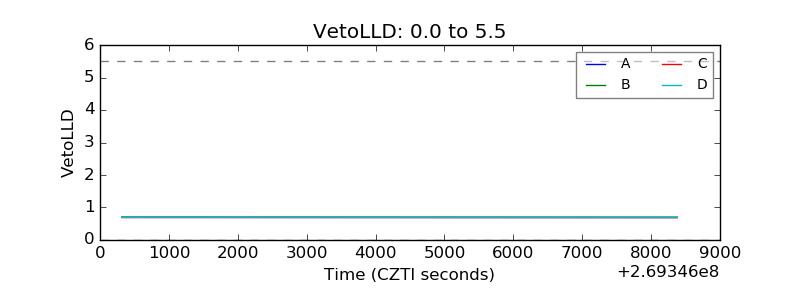 |
| Alpha Counter | 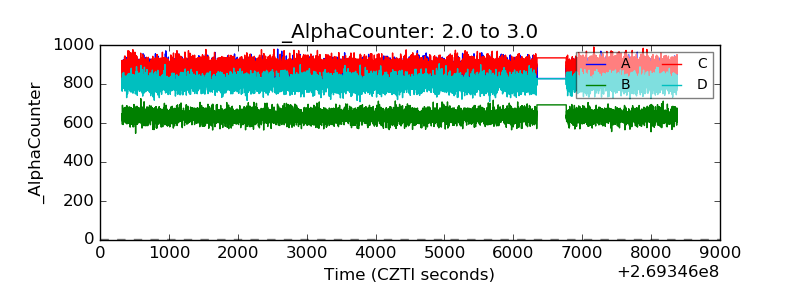 |
| _CPM_Rate | 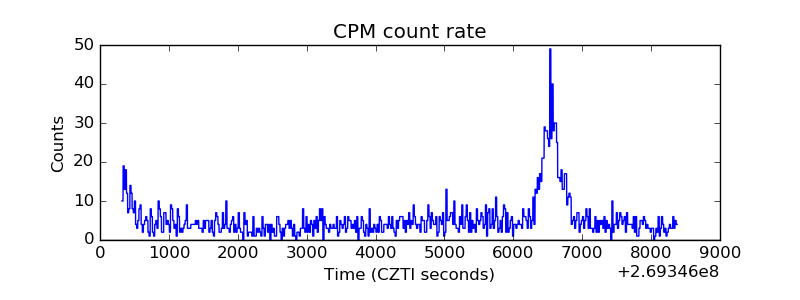 |
| CZT Counter | 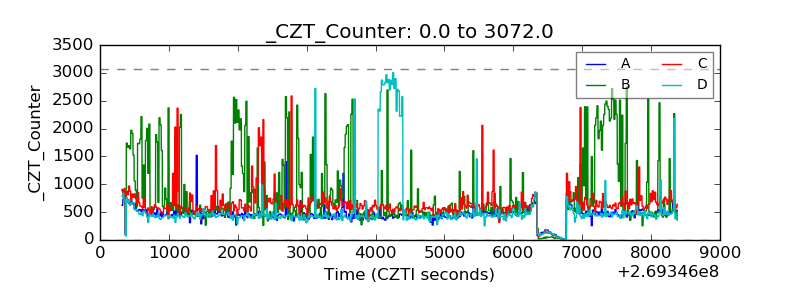 |
| +2.5 Volts monitor | 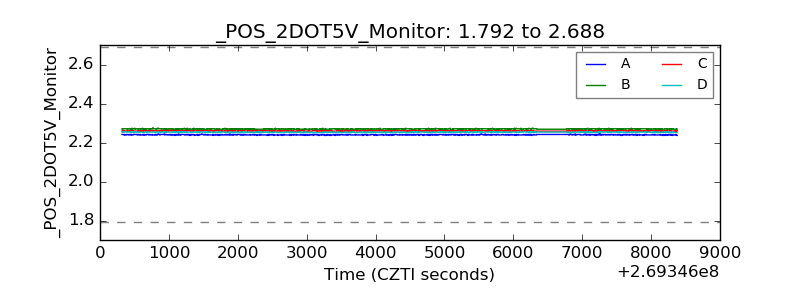 |
| +5 Volts monitor |  |
| _ROLL_ROT | 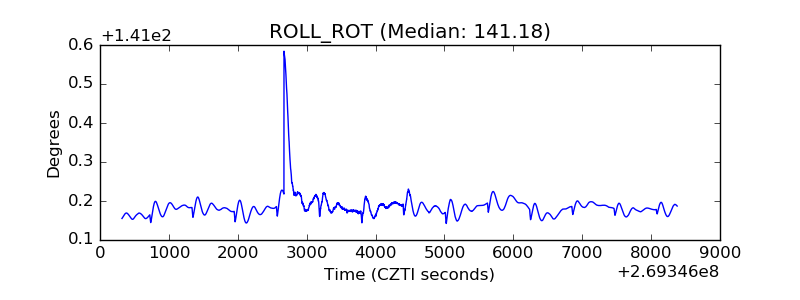 |
| _Roll_DEC | 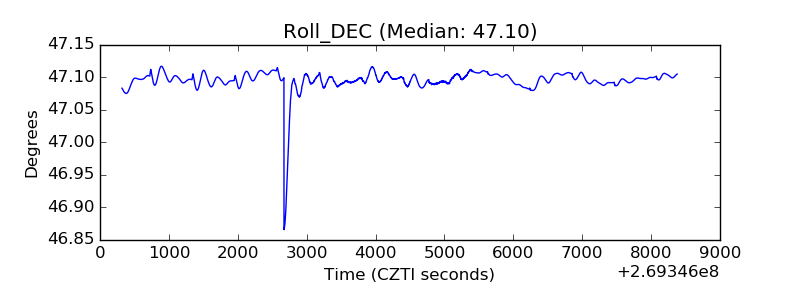 |
| _Roll_RA | 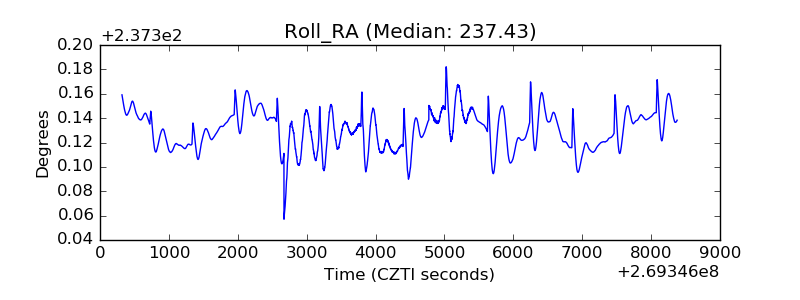 |
| Veto Counter | 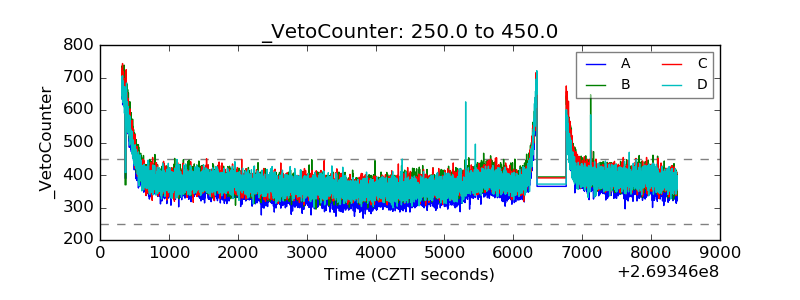 |