| Param | Original file | Final file |
|---|---|---|
| Filename | modeM0/AS1G08_046T09_9000002226_15119cztM0_level2.evt | modeM0/AS1G08_046T09_9000002226_15119cztM0_level2_quad_clean.evt |
| Size (bytes) | 904,815,360 | 168,235,200 |
| Size | 862.9 MB | 160.4 MB |
| Events in quadrant A | 5,687,236 | 1,094,056 |
| Events in quadrant B | 7,900,119 | 1,055,845 |
| Events in quadrant C | 7,269,589 | 1,067,352 |
| Events in quadrant D | 5,731,526 | 1,045,920 |
| Mode M0 | |||
|---|---|---|---|
| Quadrant | BADHDUFLAG | Total packets | Discarded packets |
| A | 0 | 24875 | 3 |
| B | 0 | 31287 | 2 |
| C | 0 | 29641 | 2 |
| D | 0 | 25564 | 2 |
| Mode M9 | |||
|---|---|---|---|
| Quadrant | BADHDUFLAG | Total packets | Discarded packets |
| A | 0 | 14 | 0 |
| B | 0 | 14 | 0 |
| C | 0 | 14 | 0 |
| D | 0 | 14 | 0 |
| Mode SS | |||
|---|---|---|---|
| Quadrant | BADHDUFLAG | Total packets | Discarded packets |
| A | 0 | 244 | 0 |
| B | 0 | 244 | 0 |
| C | 0 | 244 | 0 |
| D | 0 | 244 | 0 |
| Quadrant | Total seconds | Saturated seconds | Saturation percentage |
|---|---|---|---|
| A | 12034 | 81 | 0.673093% |
| B | 12034 | 694 | 5.766994% |
| C | 12034 | 91 | 0.756191% |
| D | 12034 | 122 | 1.013794% |
Noise dominated data is calculated using 1-second bins in cleaned event files. If a bin has >2000 counts, and if more than 50% of those come from <1% of pixels, then it is considered to be noise-dominated and hence unusable.
| Quadrant | # 1 sec bins | Bins with >0 counts | Bins with >2000 counts | High rate bins dominated by noise | Noise dominated (total time) | Noise dominated (detector-on time) | Marked lightcurve |
|---|---|---|---|---|---|---|---|
| A | 13410 | 12035 | 9 | 9 | 0.07% | 0.07% | 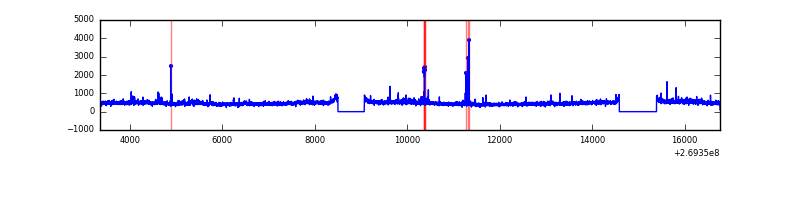 |
| B | 13410 | 12036 | 500 | 500 | 3.73% | 4.15% | 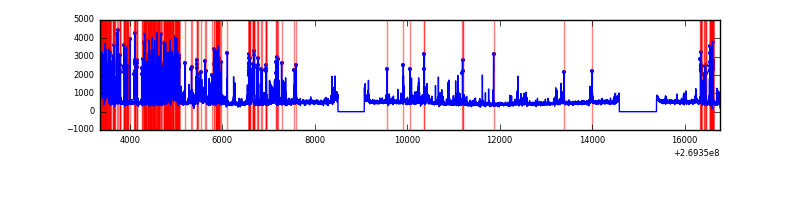 |
| C | 13410 | 12036 | 16 | 16 | 0.12% | 0.13% | 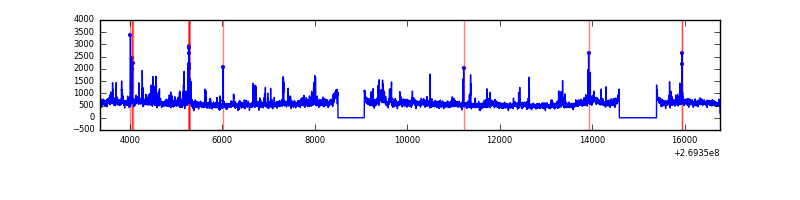 |
| D | 13410 | 12036 | 51 | 51 | 0.38% | 0.42% | 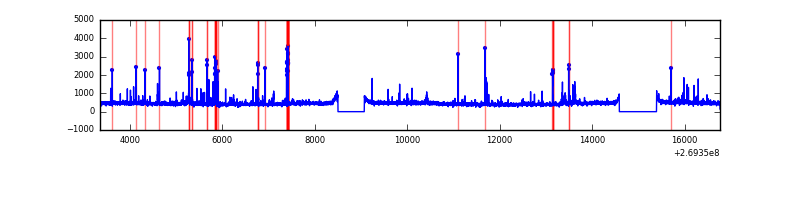 |
Top three noisy pixels from each quadrant. If the there are fewer than three noisy pixels in the level2.evt file, extra rows are filled as -1
| Pixel properties | Quadrant properties | ||||||
|---|---|---|---|---|---|---|---|
| Quadrant | DetID | PixID | Counts | Sigma | Mean | Median | Sigma |
| A | 12 | 189 | 118524 | 411.72 | 1406 | 1373 | 284.5 |
| A | 15 | 239 | 57621 | 197.68 | 1406 | 1373 | 284.5 |
| A | 9 | 143 | 50049 | 171.07 | 1406 | 1373 | 284.5 |
| B | 10 | 245 | 1613942 | 6225.07 | 1374 | 1338 | 259.0 |
| B | 3 | 64 | 629246 | 2423.89 | 1374 | 1338 | 259.0 |
| B | 0 | 190 | 50103 | 188.25 | 1374 | 1338 | 259.0 |
| C | 3 | 233 | 1652879 | 5255.19 | 1368 | 1374 | 314.3 |
| C | 4 | 254 | 214770 | 679.04 | 1368 | 1374 | 314.3 |
| C | 0 | 207 | 35150 | 107.48 | 1368 | 1374 | 314.3 |
| D | 2 | 14 | 107998 | 322.35 | 1373 | 1333 | 330.9 |
| D | 7 | 38 | 106510 | 317.85 | 1373 | 1333 | 330.9 |
| D | 5 | 222 | 78288 | 232.56 | 1373 | 1333 | 330.9 |
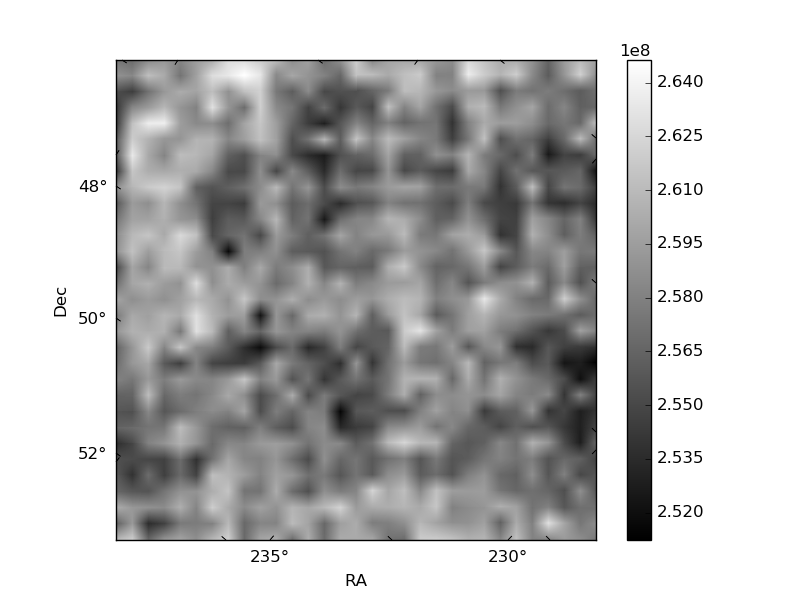
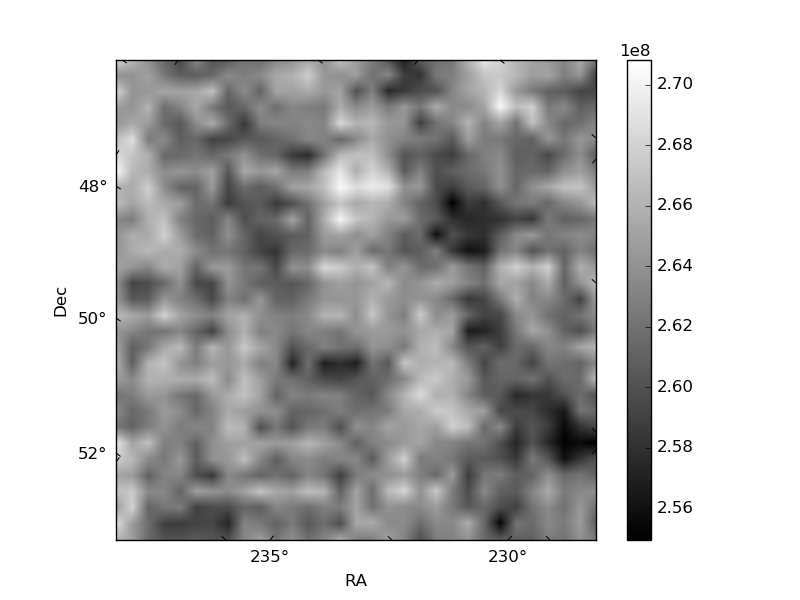
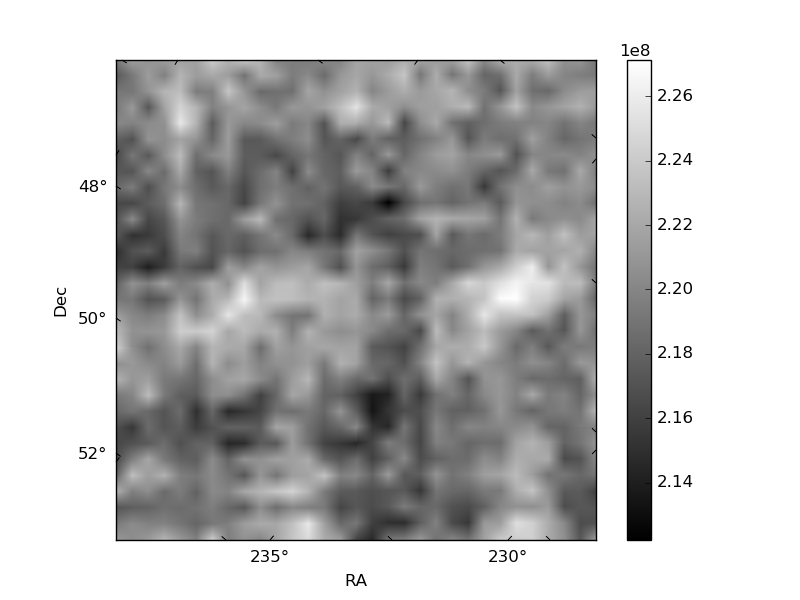
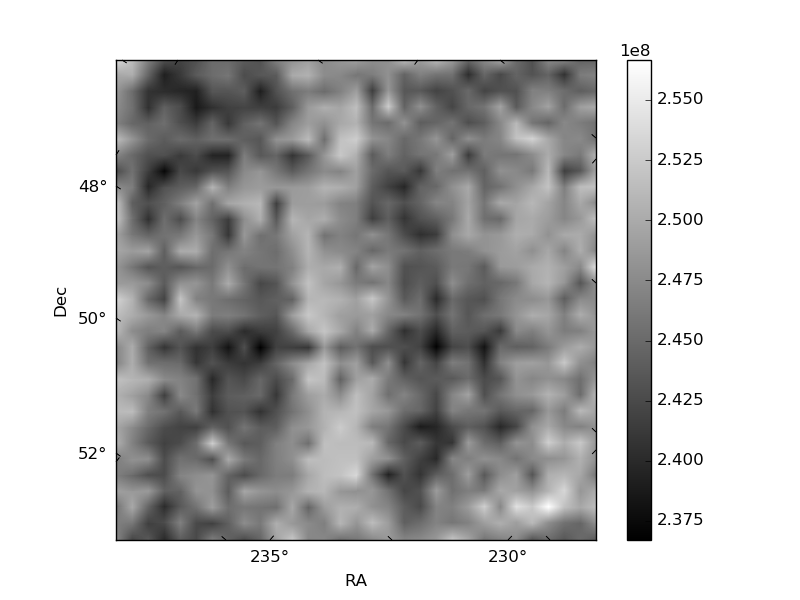
Histogram calculated using DETX and DETY for each event in the final _common_clean file
| Quadrant A | 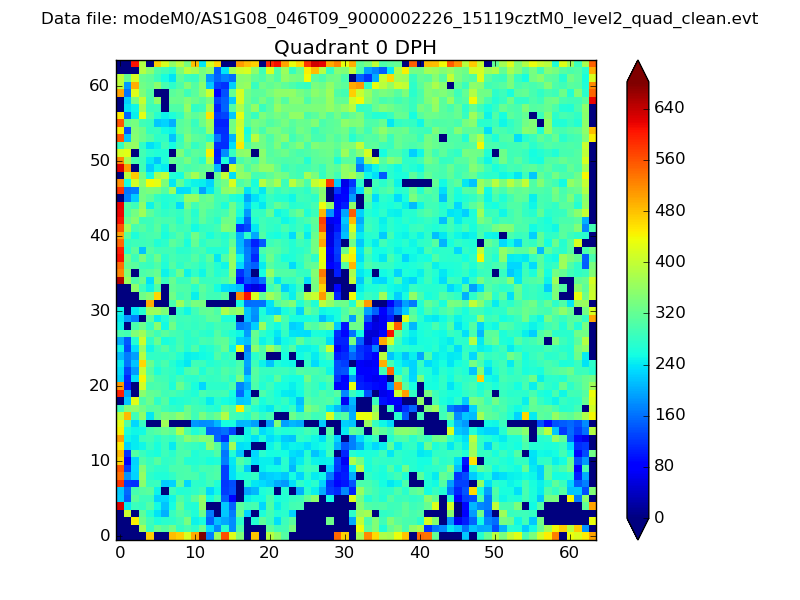 |
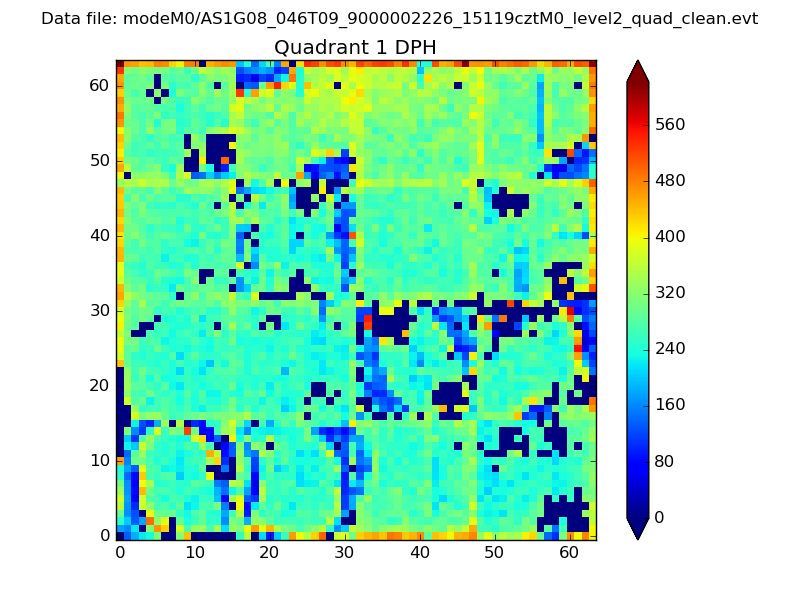 |
Quadrant B |
|---|---|---|---|
| Quadrant D |  |
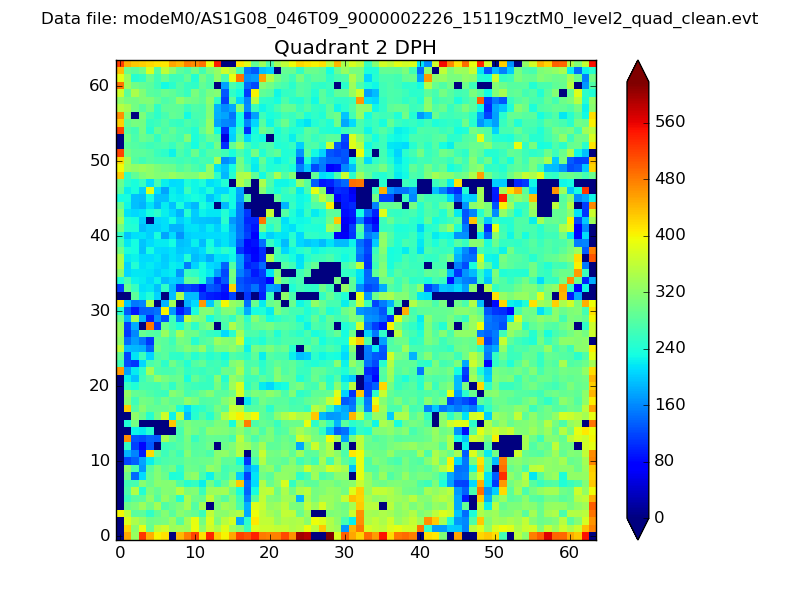 |
Quadrant C |
| Plot type | Count rate plots | Images |
|---|---|---|
| Comparison with Poisson distribution Blue bars denote a histogram of data divided into 1 sec bins. Red curve is a Poisson curve with rate = median count rate of data. |
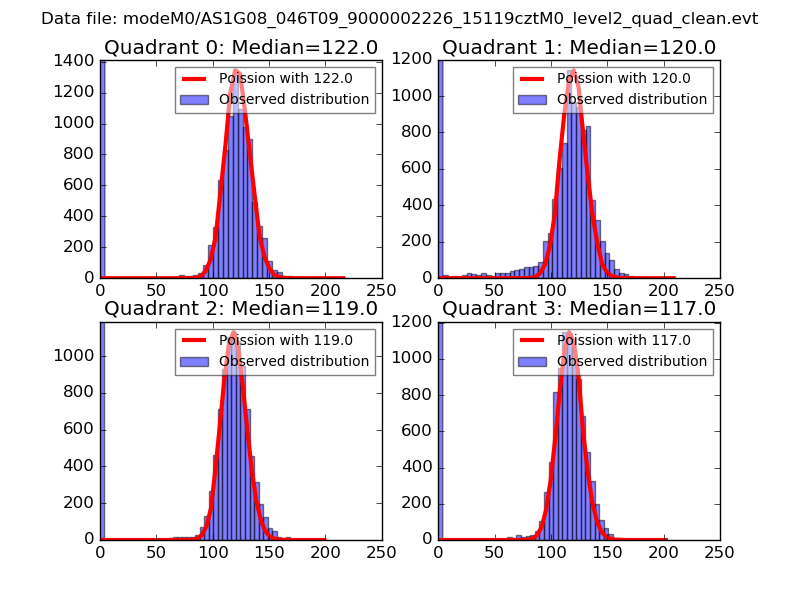 |
 |
| Quadrant-wise count rates Data is divided into 100 sec bins |
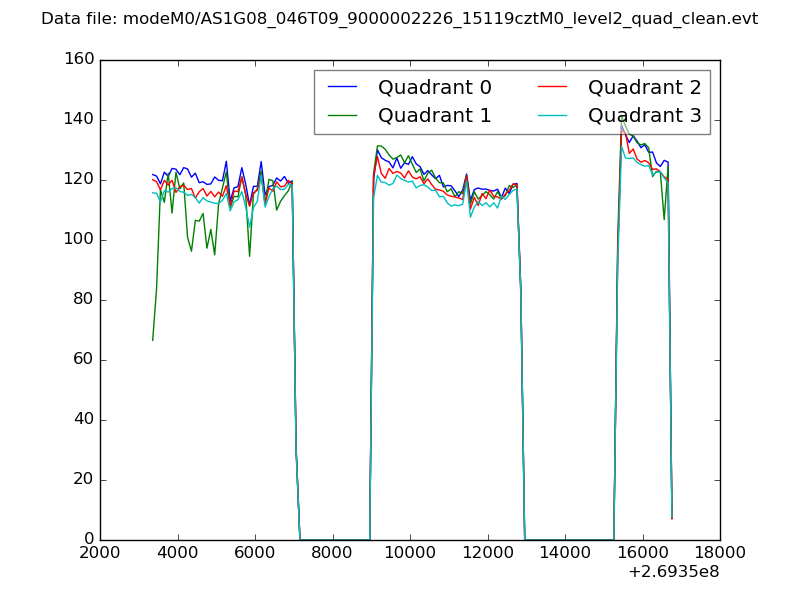 |
|
| Module-wise count rates for Quadrant A Data is divided into 100 sec bins |
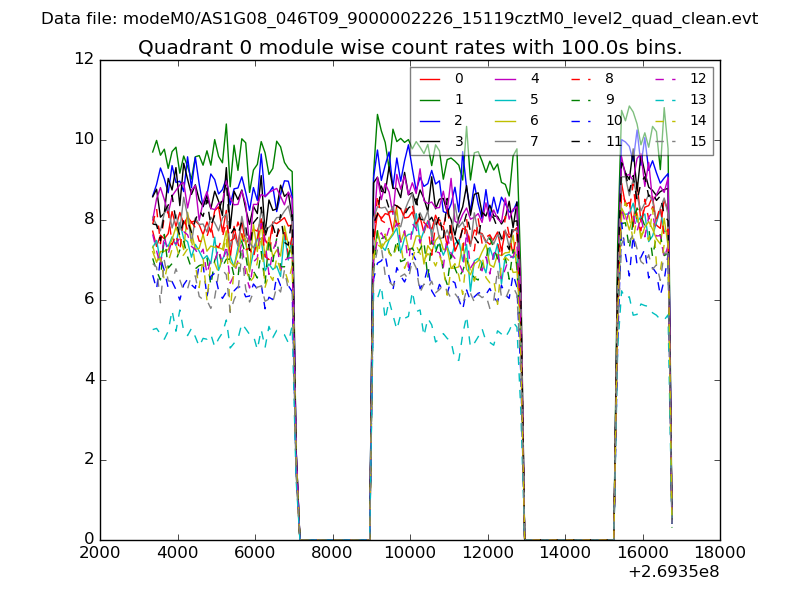 |
 |
| Module-wise count rates for Quadrant B Data is divided into 100 sec bins |
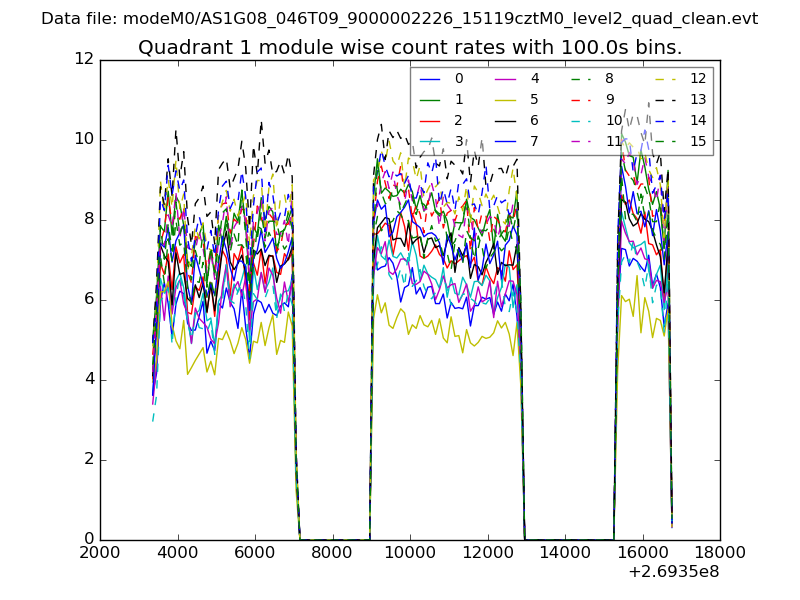 |
 |
| Module-wise count rates for Quadrant C Data is divided into 100 sec bins |
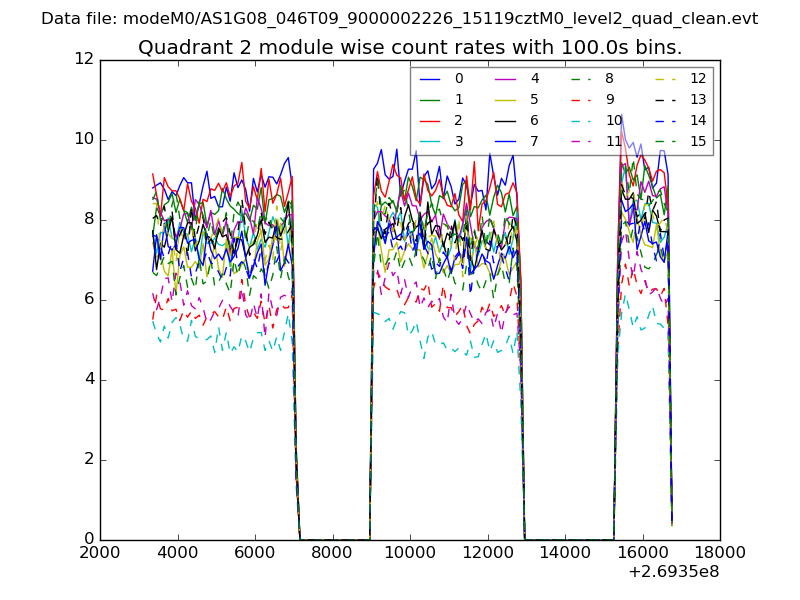 |
 |
| Module-wise count rates for Quadrant D Data is divided into 100 sec bins |
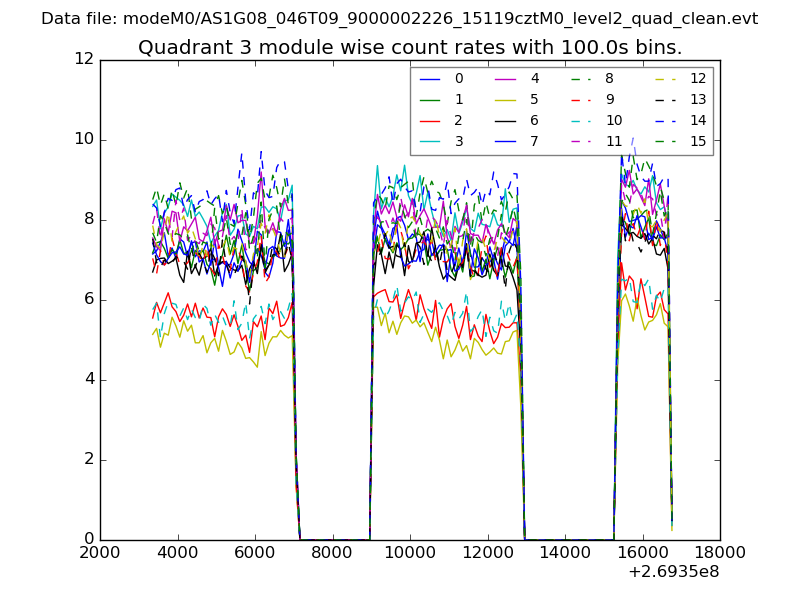 |
 |
| Parameter | Plot |
|---|---|
| CZT HV Monitor | 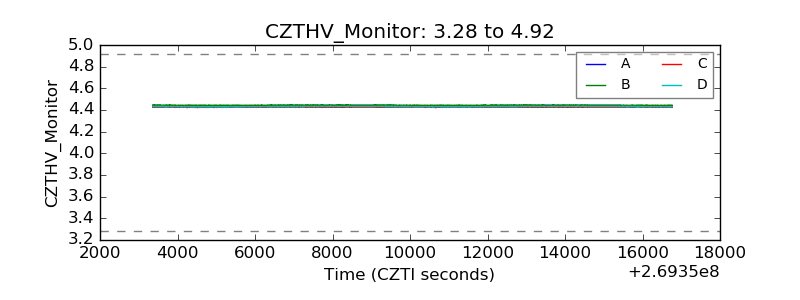 |
| D_VDD | 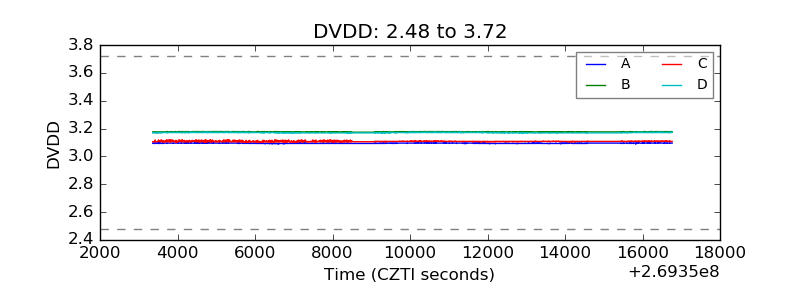 |
| Temperature 1 | 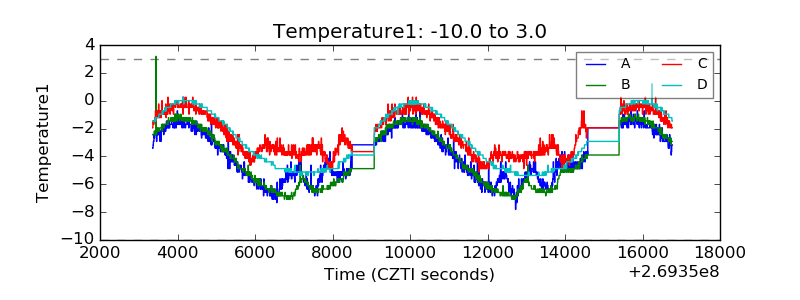 |
| Veto HV Monitor |  |
| Veto LLD | 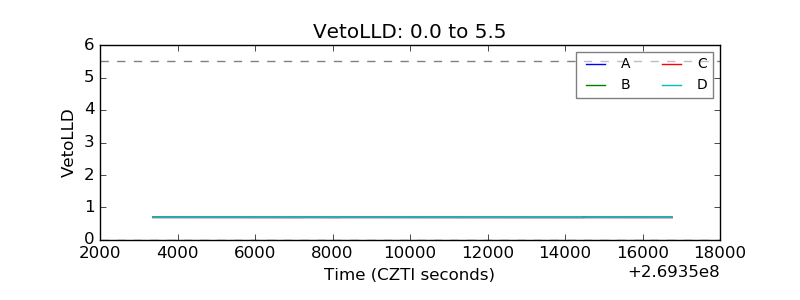 |
| Alpha Counter | 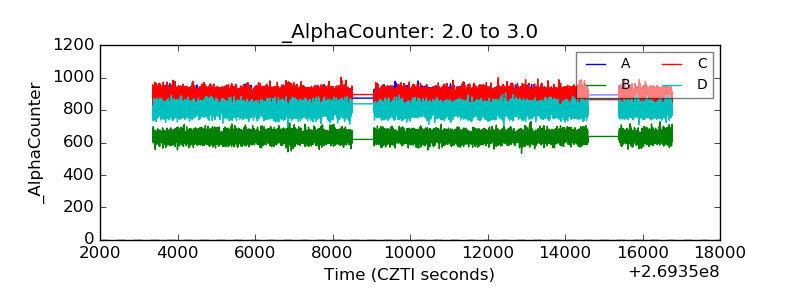 |
| _CPM_Rate | 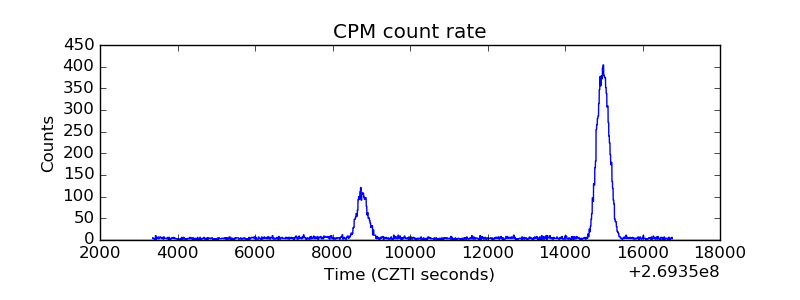 |
| CZT Counter | 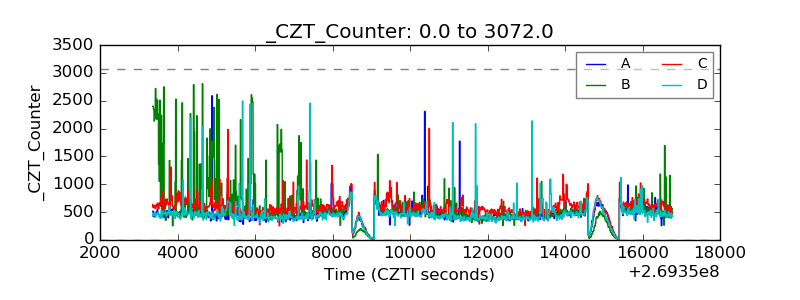 |
| +2.5 Volts monitor | 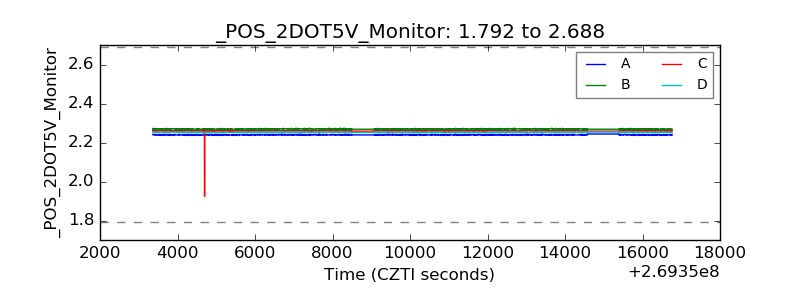 |
| +5 Volts monitor |  |
| _ROLL_ROT | 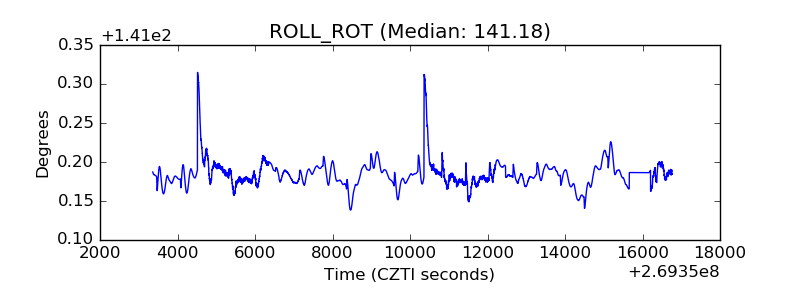 |
| _Roll_DEC | 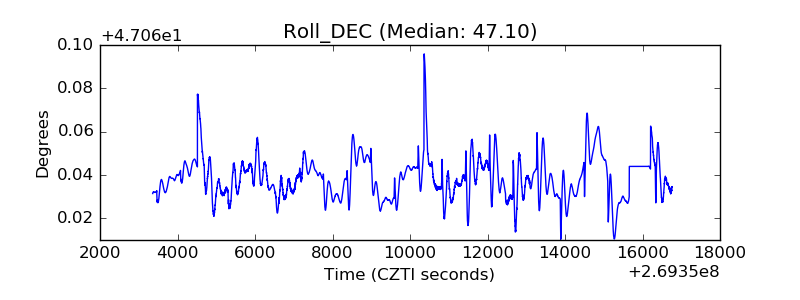 |
| _Roll_RA | 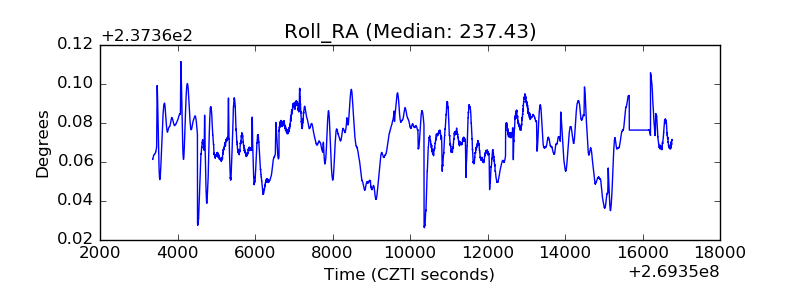 |
| Veto Counter | 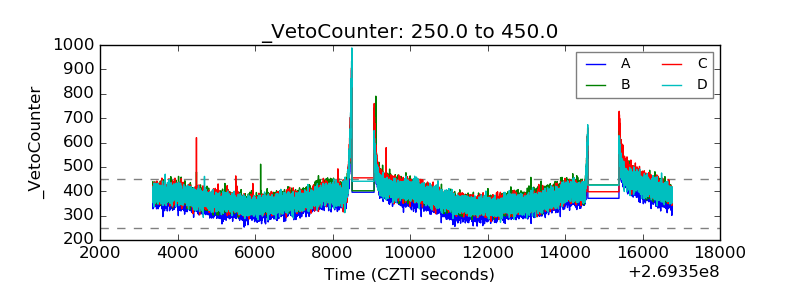 |