| Param | Original file | Final file |
|---|---|---|
| Filename | modeM0/AS1G08_046T09_9000002226_15121cztM0_level2.evt | modeM0/AS1G08_046T09_9000002226_15121cztM0_level2_quad_clean.evt |
| Size (bytes) | 469,848,960 | 93,314,880 |
| Size | 448.1 MB | 89.0 MB |
| Events in quadrant A | 2,980,283 | 606,757 |
| Events in quadrant B | 3,295,219 | 608,063 |
| Events in quadrant C | 4,150,518 | 593,818 |
| Events in quadrant D | 3,370,352 | 572,562 |
| Mode M0 | |||
|---|---|---|---|
| Quadrant | BADHDUFLAG | Total packets | Discarded packets |
| A | 0 | 13290 | 3 |
| B | 0 | 13967 | 2 |
| C | 0 | 16610 | 2 |
| D | 0 | 14626 | 2 |
| Mode M9 | |||
|---|---|---|---|
| Quadrant | BADHDUFLAG | Total packets | Discarded packets |
| A | 0 | 12 | 0 |
| B | 0 | 12 | 0 |
| C | 0 | 12 | 0 |
| D | 0 | 12 | 0 |
| Mode SS | |||
|---|---|---|---|
| Quadrant | BADHDUFLAG | Total packets | Discarded packets |
| A | 0 | 128 | 0 |
| B | 0 | 128 | 0 |
| C | 0 | 128 | 0 |
| D | 0 | 128 | 0 |
| Quadrant | Total seconds | Saturated seconds | Saturation percentage |
|---|---|---|---|
| A | 6378 | 27 | 0.423330% |
| B | 6378 | 53 | 0.830981% |
| C | 6378 | 179 | 2.806522% |
| D | 6378 | 135 | 2.116651% |
Noise dominated data is calculated using 1-second bins in cleaned event files. If a bin has >2000 counts, and if more than 50% of those come from <1% of pixels, then it is considered to be noise-dominated and hence unusable.
| Quadrant | # 1 sec bins | Bins with >0 counts | Bins with >2000 counts | High rate bins dominated by noise | Noise dominated (total time) | Noise dominated (detector-on time) | Marked lightcurve |
|---|---|---|---|---|---|---|---|
| A | 7483 | 6374 | 0 | 0 | 0.00% | 0.00% | 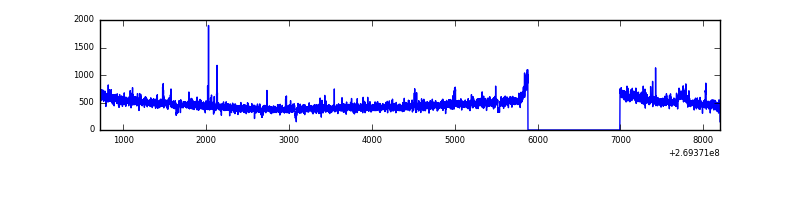 |
| B | 7483 | 6374 | 24 | 24 | 0.32% | 0.38% | 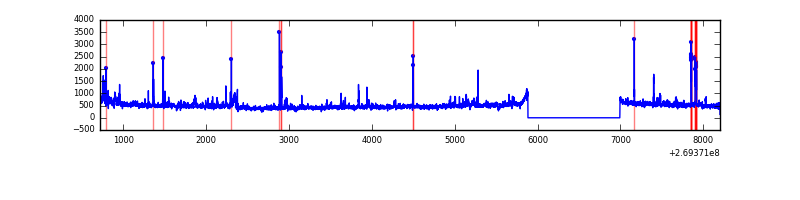 |
| C | 7483 | 6374 | 125 | 125 | 1.67% | 1.96% | 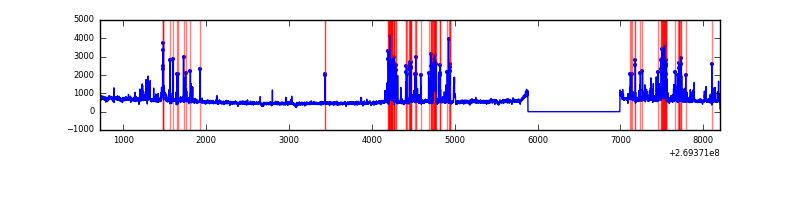 |
| D | 7483 | 6374 | 105 | 105 | 1.40% | 1.65% | 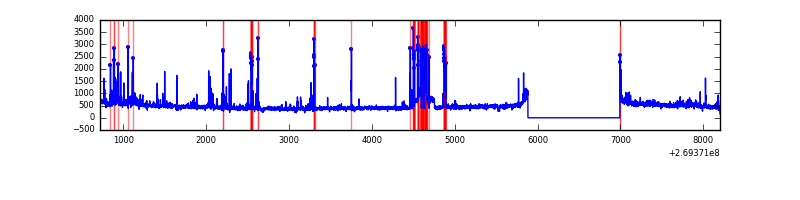 |
Top three noisy pixels from each quadrant. If the there are fewer than three noisy pixels in the level2.evt file, extra rows are filled as -1
| Pixel properties | Quadrant properties | ||||||
|---|---|---|---|---|---|---|---|
| Quadrant | DetID | PixID | Counts | Sigma | Mean | Median | Sigma |
| A | 12 | 189 | 45953 | 295.6 | 760 | 742 | 152.9 |
| A | 0 | 226 | 6776 | 39.45 | 760 | 742 | 152.9 |
| A | 9 | 143 | 6285 | 36.24 | 760 | 742 | 152.9 |
| B | 10 | 245 | 118075 | 825.3 | 761 | 741 | 142.2 |
| B | 3 | 64 | 115992 | 810.65 | 761 | 741 | 142.2 |
| B | 3 | 209 | 28480 | 195.11 | 761 | 741 | 142.2 |
| C | 4 | 254 | 671083 | 3923.27 | 739 | 743 | 170.9 |
| C | 3 | 233 | 587269 | 3432.74 | 739 | 743 | 170.9 |
| C | 13 | 61 | 5240 | 26.32 | 739 | 743 | 170.9 |
| D | 1 | 255 | 243459 | 1350.86 | 739 | 715 | 179.7 |
| D | 10 | 70 | 112360 | 621.3 | 739 | 715 | 179.7 |
| D | 7 | 38 | 67237 | 370.19 | 739 | 715 | 179.7 |
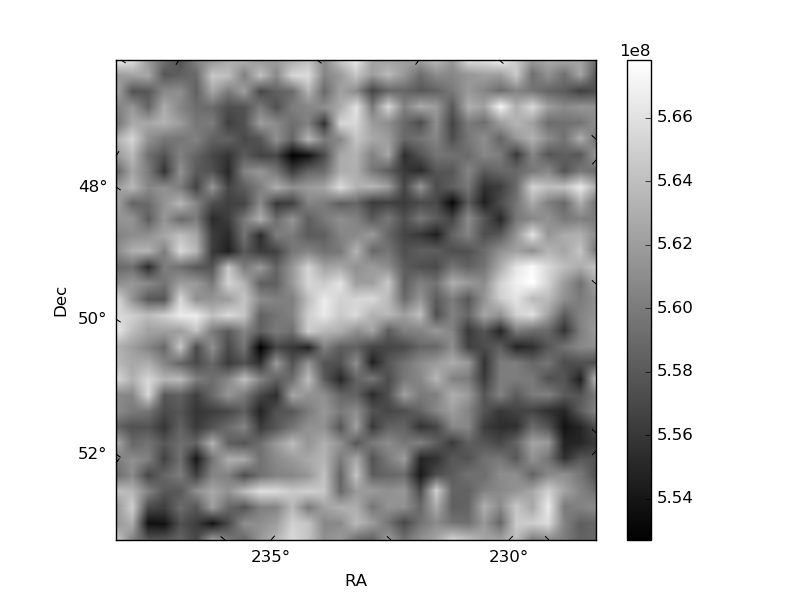
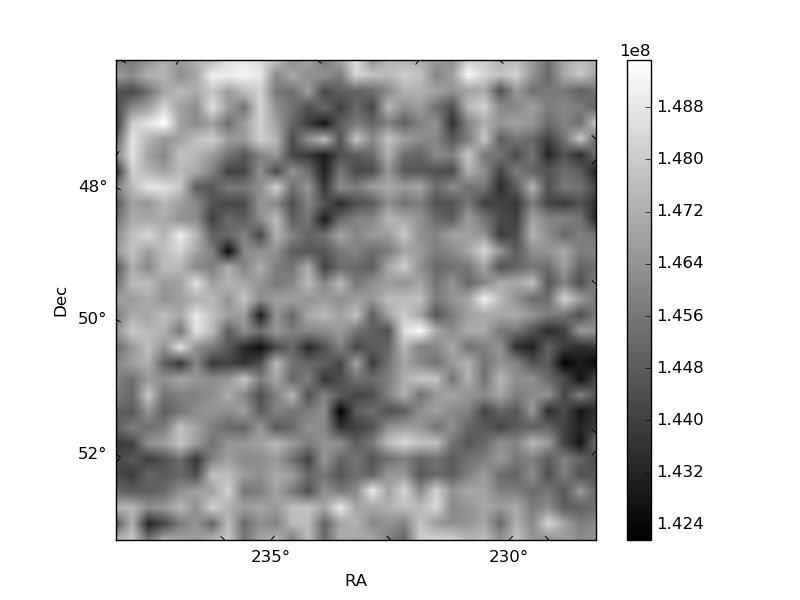
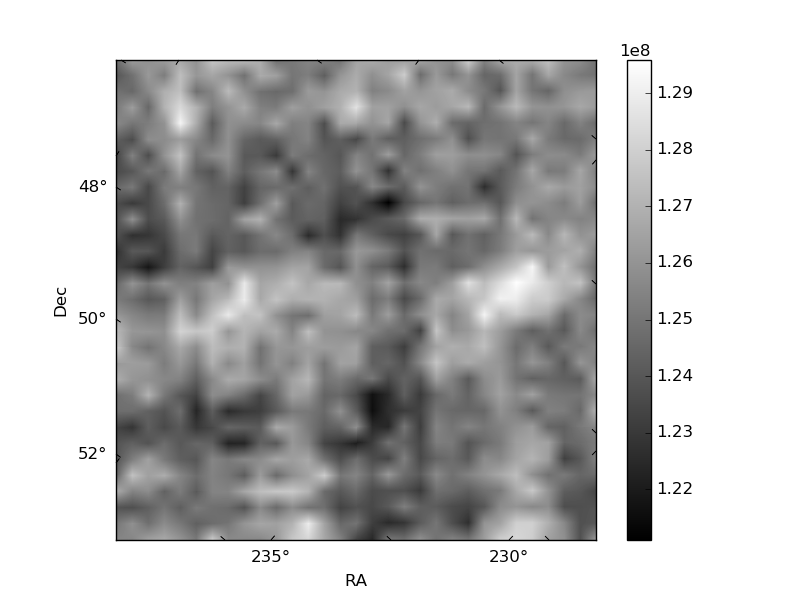
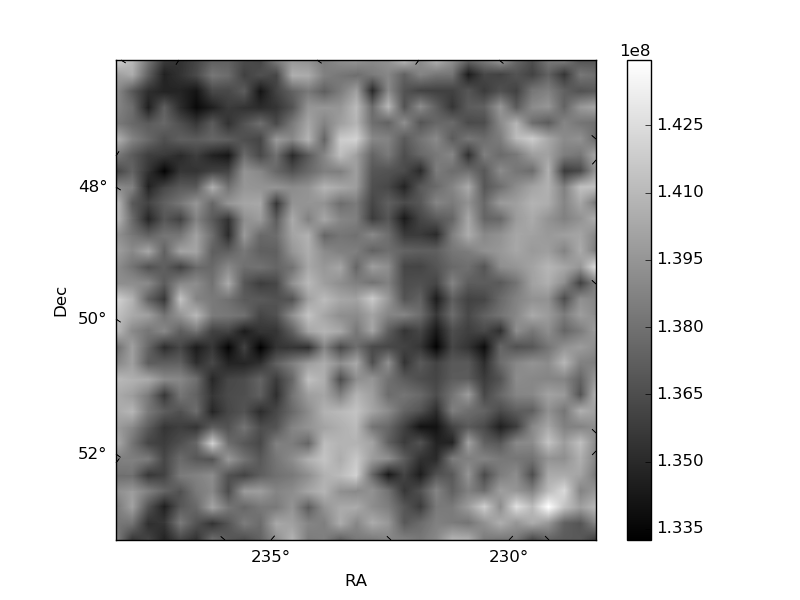
Histogram calculated using DETX and DETY for each event in the final _common_clean file
| Quadrant A | 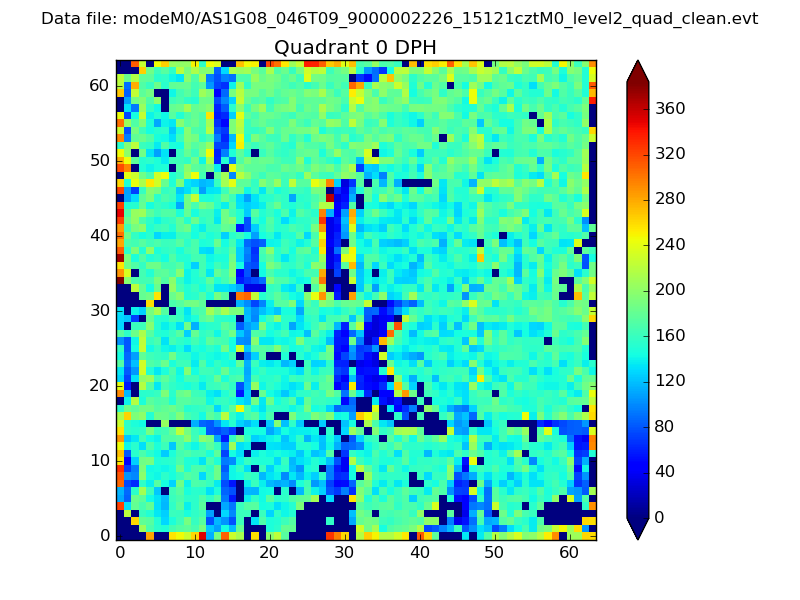 |
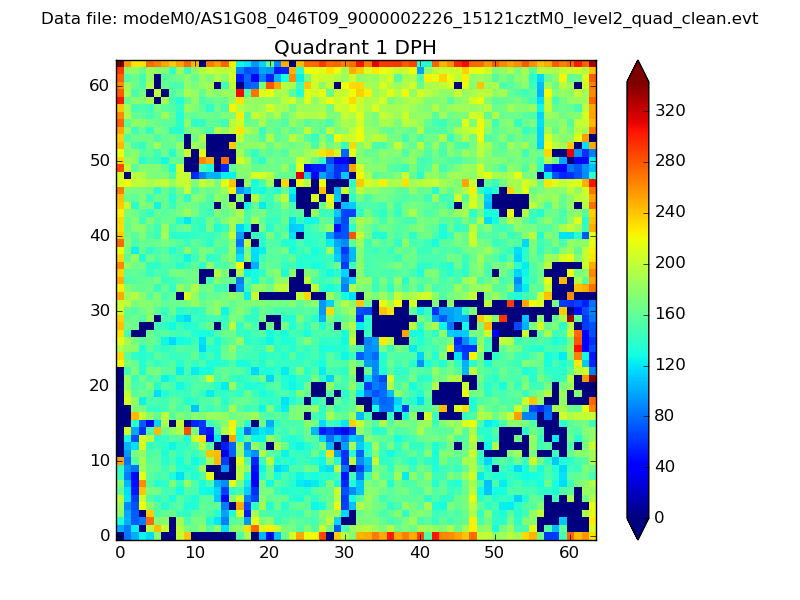 |
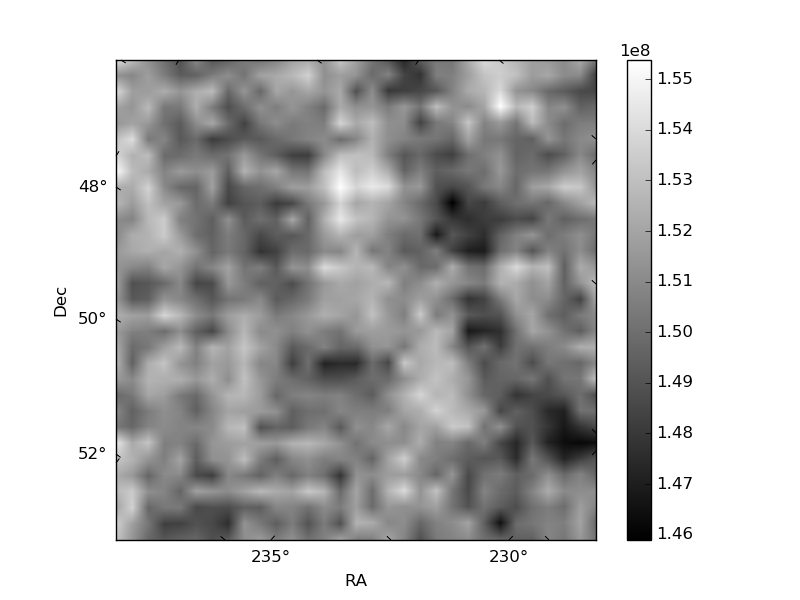
Quadrant B |
|---|---|---|---|
| Quadrant D | 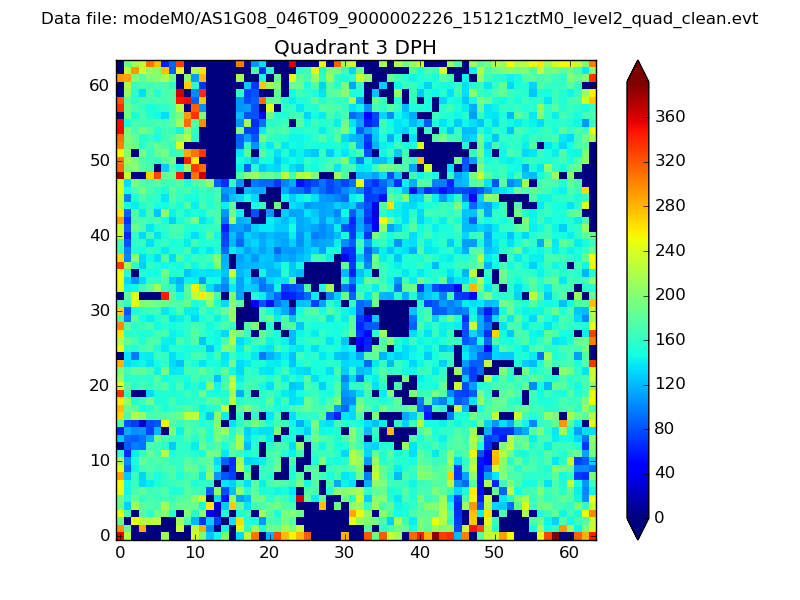 |
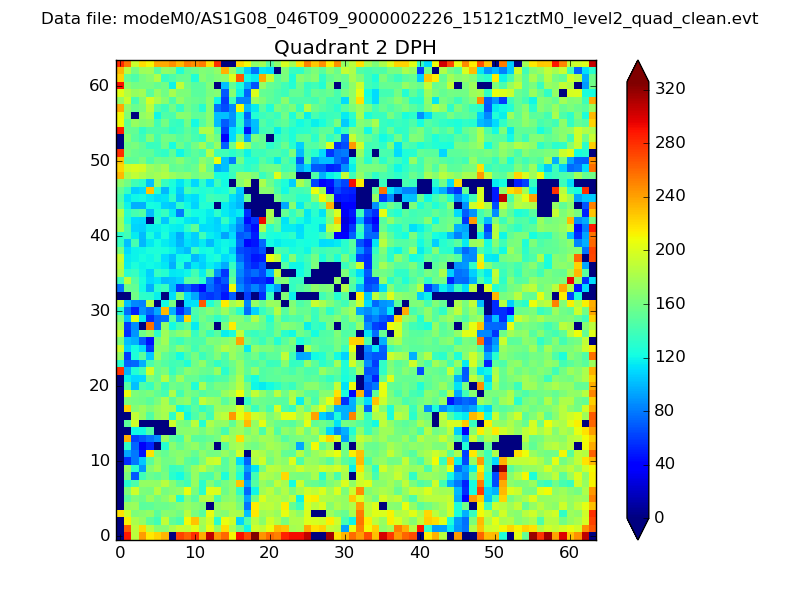 |
Quadrant C |
| Plot type | Count rate plots | Images |
|---|---|---|
| Comparison with Poisson distribution Blue bars denote a histogram of data divided into 1 sec bins. Red curve is a Poisson curve with rate = median count rate of data. |
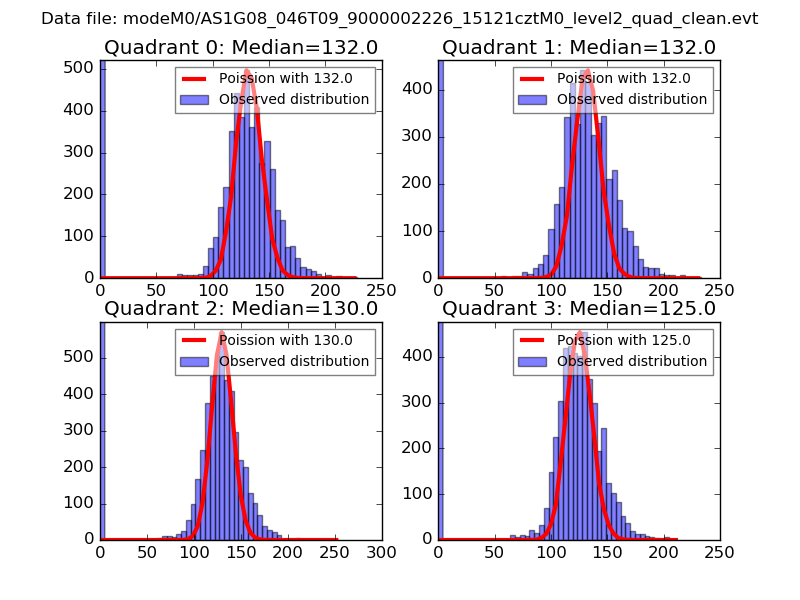 |
 |
| Quadrant-wise count rates Data is divided into 100 sec bins |
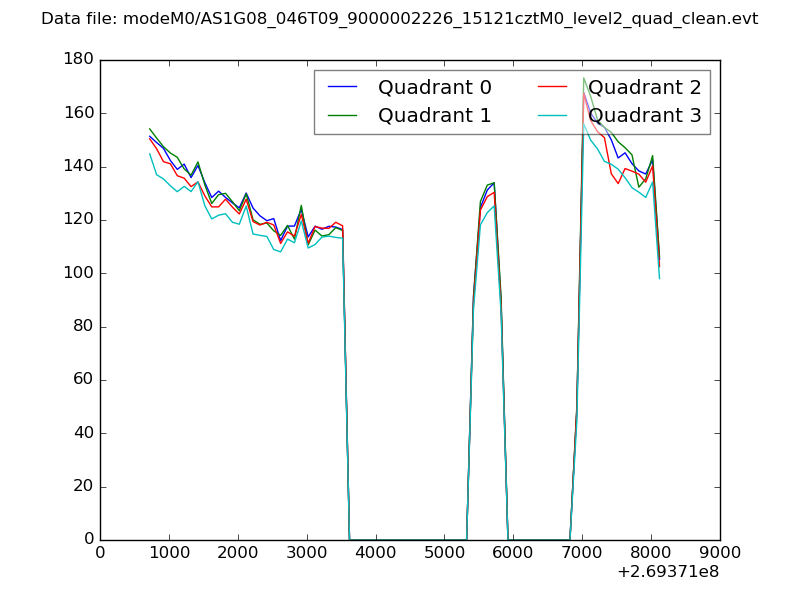 |
|
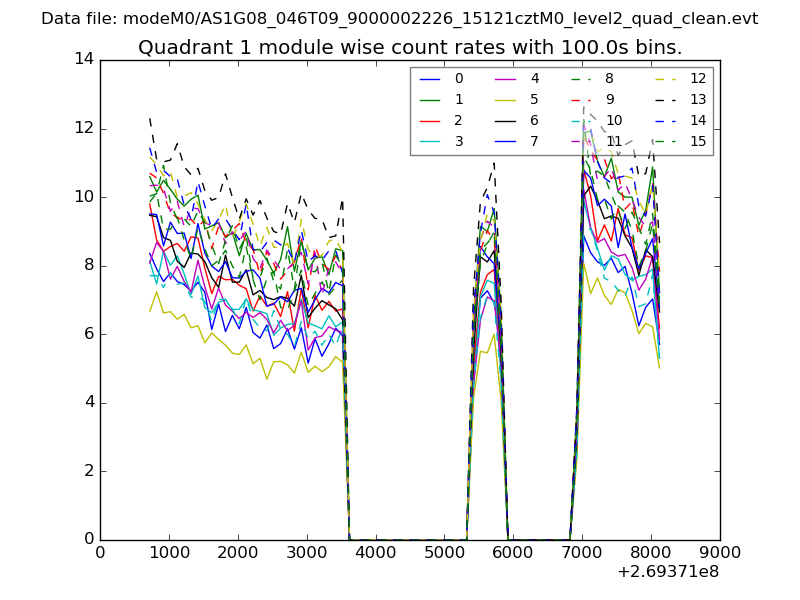
| Module-wise count rates for Quadrant A Data is divided into 100 sec bins |
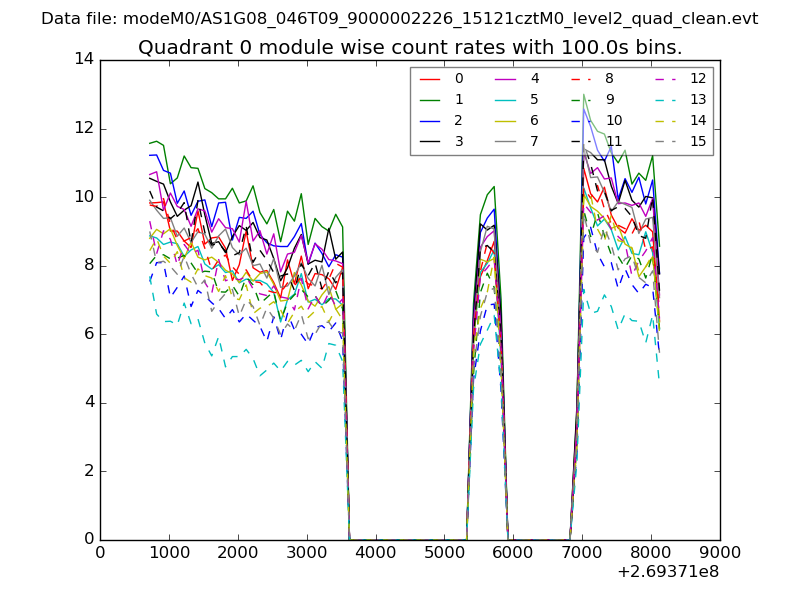 |
 |
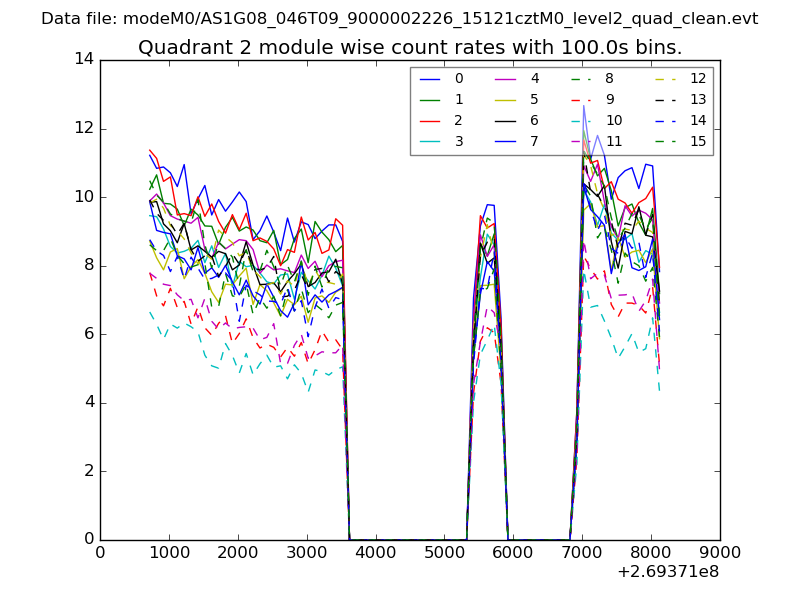
| Module-wise count rates for Quadrant B Data is divided into 100 sec bins |
 |
 |
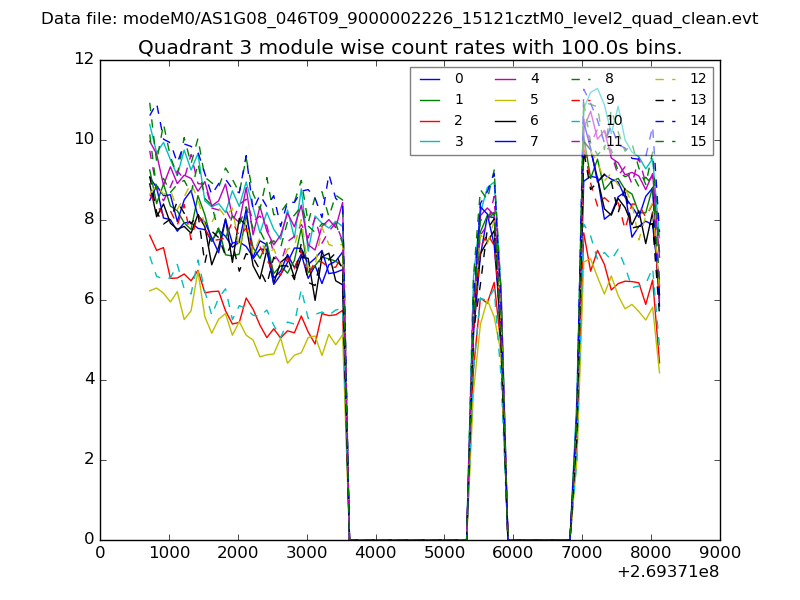
| Module-wise count rates for Quadrant C Data is divided into 100 sec bins |
 |
 |
| Module-wise count rates for Quadrant D Data is divided into 100 sec bins |
 |
 |
| Parameter | Plot |
|---|---|
| CZT HV Monitor | 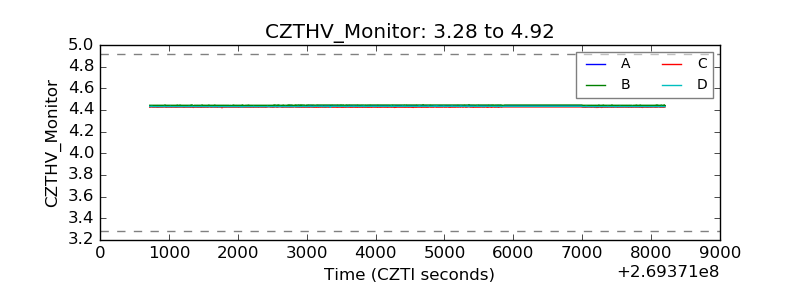 |
| D_VDD | 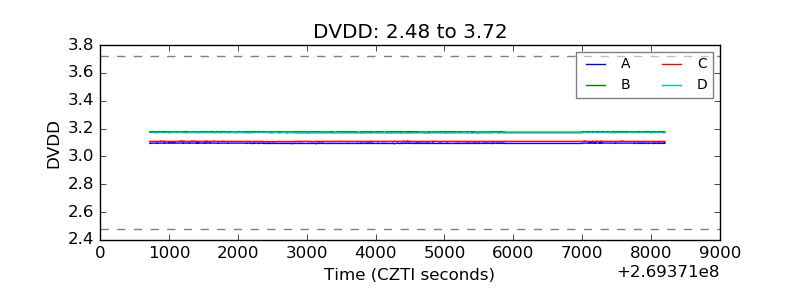 |
| Temperature 1 | 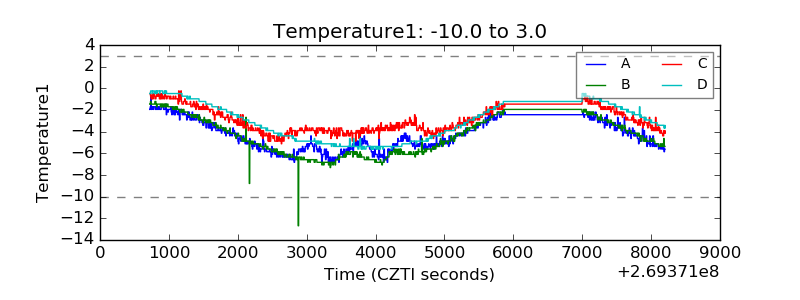 |
| Veto HV Monitor | 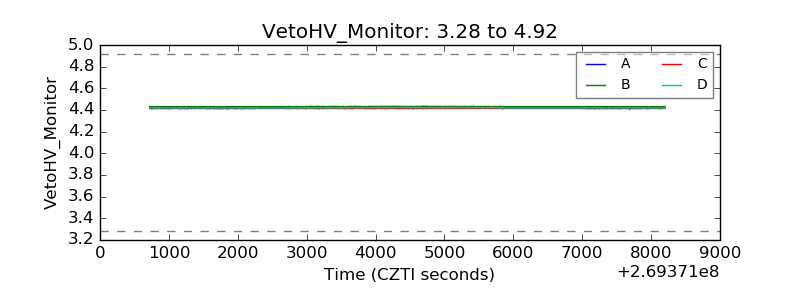 |
| Veto LLD | 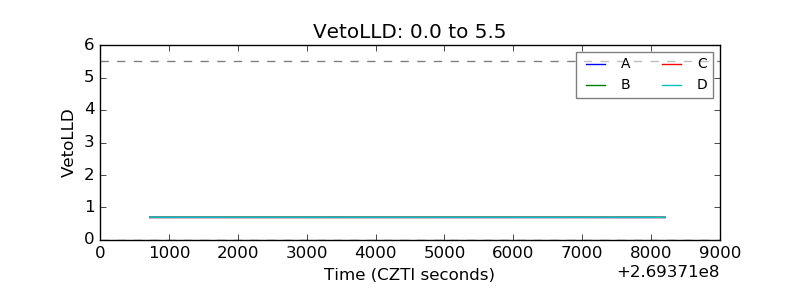 |
| Alpha Counter | 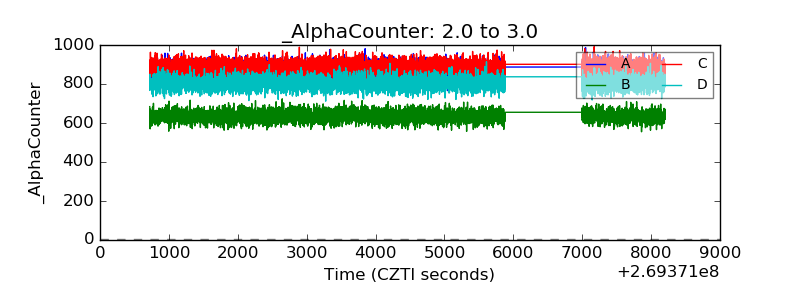 |
| _CPM_Rate | 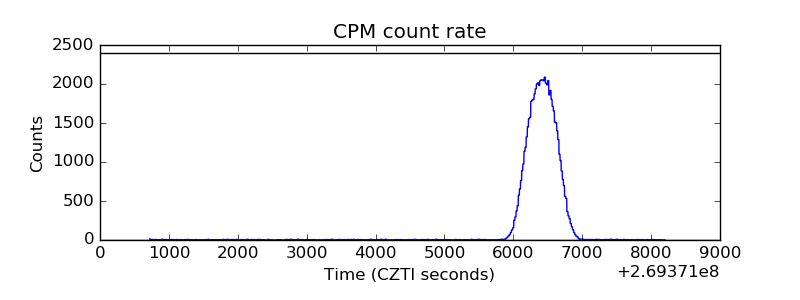 |
| CZT Counter | 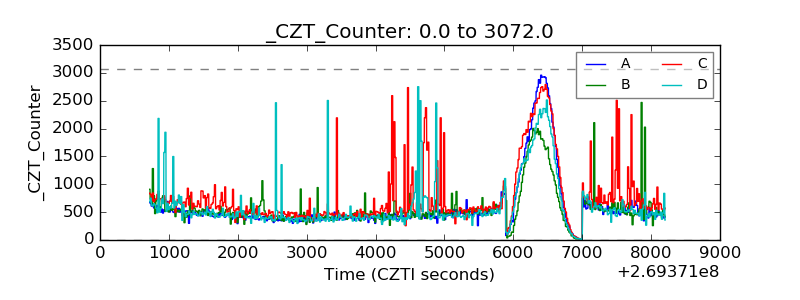 |
| +2.5 Volts monitor |  |
| +5 Volts monitor |  |
| _ROLL_ROT | 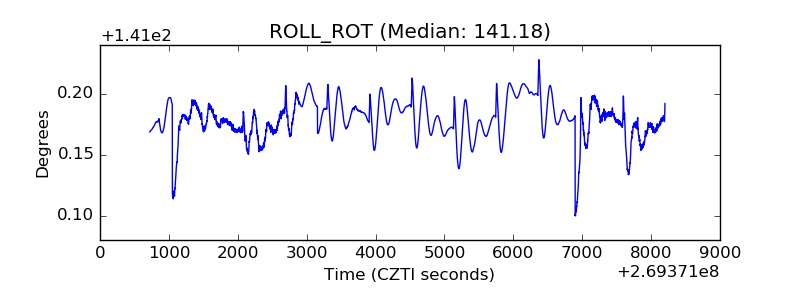 |
| _Roll_DEC | 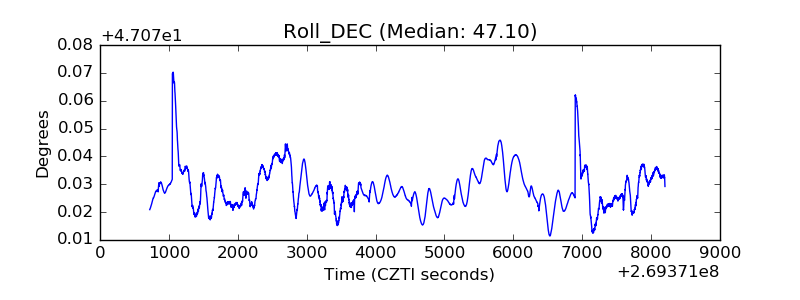 |
| _Roll_RA | 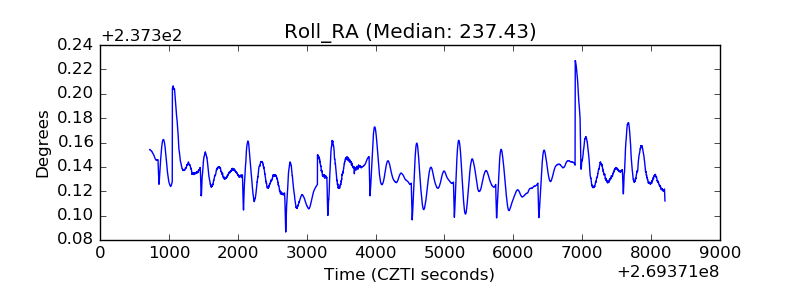 |
| Veto Counter |  |