| Param | Original file | Final file |
|---|---|---|
| Filename | modeM0/AS1G08_046T09_9000002226_15122cztM0_level2.evt | modeM0/AS1G08_046T09_9000002226_15122cztM0_level2_quad_clean.evt |
| Size (bytes) | 486,792,000 | 93,769,920 |
| Size | 464.2 MB | 89.4 MB |
| Events in quadrant A | 3,138,980 | 619,518 |
| Events in quadrant B | 3,223,693 | 630,480 |
| Events in quadrant C | 5,020,196 | 564,758 |
| Events in quadrant D | 2,935,542 | 588,974 |
| Mode M0 | |||
|---|---|---|---|
| Quadrant | BADHDUFLAG | Total packets | Discarded packets |
| A | 0 | 13514 | 3 |
| B | 0 | 13694 | 2 |
| C | 0 | 18957 | 2 |
| D | 0 | 13196 | 2 |
| Mode M9 | |||
|---|---|---|---|
| Quadrant | BADHDUFLAG | Total packets | Discarded packets |
| A | 0 | 22 | 0 |
| B | 0 | 22 | 0 |
| C | 0 | 22 | 0 |
| D | 0 | 23 | 0 |
| Mode SS | |||
|---|---|---|---|
| Quadrant | BADHDUFLAG | Total packets | Discarded packets |
| A | 0 | 126 | 0 |
| B | 0 | 126 | 0 |
| C | 0 | 126 | 0 |
| D | 0 | 126 | 0 |
| Quadrant | Total seconds | Saturated seconds | Saturation percentage |
|---|---|---|---|
| A | 6247 | 11 | 0.176085% |
| B | 6247 | 54 | 0.864415% |
| C | 6247 | 740 | 11.845686% |
| D | 6247 | 17 | 0.272131% |
Noise dominated data is calculated using 1-second bins in cleaned event files. If a bin has >2000 counts, and if more than 50% of those come from <1% of pixels, then it is considered to be noise-dominated and hence unusable.
| Quadrant | # 1 sec bins | Bins with >0 counts | Bins with >2000 counts | High rate bins dominated by noise | Noise dominated (total time) | Noise dominated (detector-on time) | Marked lightcurve |
|---|---|---|---|---|---|---|---|
| A | 7488 | 6249 | 0 | 0 | 0.00% | 0.00% | 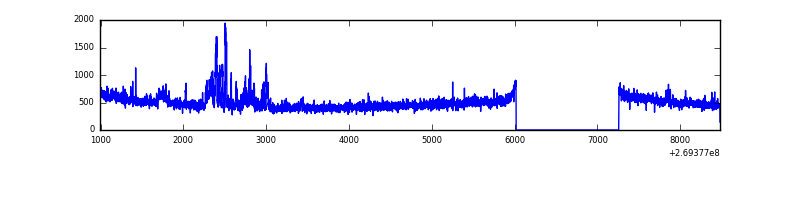 |
| B | 7488 | 6249 | 23 | 23 | 0.31% | 0.37% | 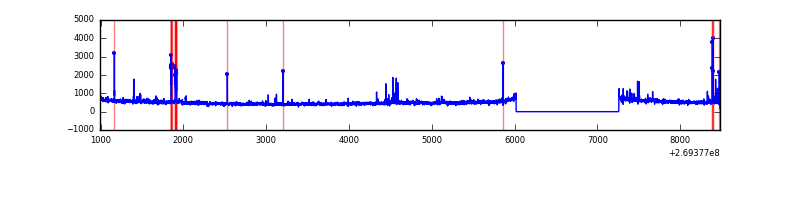 |
| C | 7488 | 6248 | 506 | 506 | 6.76% | 8.10% | 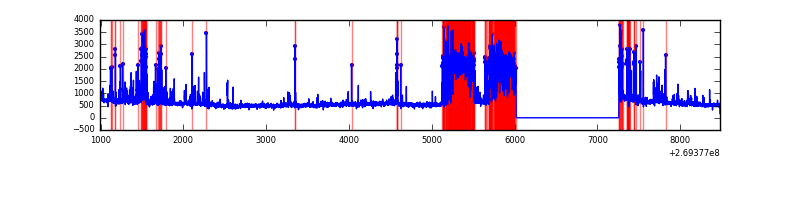 |
| D | 7488 | 6249 | 6 | 6 | 0.08% | 0.10% | 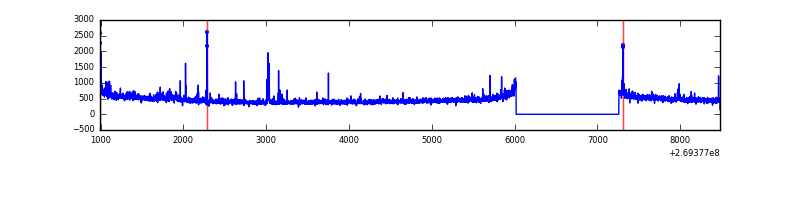 |
Top three noisy pixels from each quadrant. If the there are fewer than three noisy pixels in the level2.evt file, extra rows are filled as -1
| Pixel properties | Quadrant properties | ||||||
|---|---|---|---|---|---|---|---|
| Quadrant | DetID | PixID | Counts | Sigma | Mean | Median | Sigma |
| A | 12 | 189 | 223381 | 1465.06 | 754 | 739 | 152.0 |
| A | 8 | 6 | 8591 | 51.67 | 754 | 739 | 152.0 |
| A | 9 | 143 | 7869 | 46.92 | 754 | 739 | 152.0 |
| B | 3 | 64 | 87905 | 619.81 | 761 | 743 | 140.6 |
| B | 10 | 245 | 78631 | 553.86 | 761 | 743 | 140.6 |
| B | 0 | 190 | 22124 | 152.04 | 761 | 743 | 140.6 |
| C | 4 | 254 | 1650588 | 10448.74 | 689 | 695 | 157.9 |
| C | 3 | 233 | 651435 | 4121.12 | 689 | 695 | 157.9 |
| C | 0 | 207 | 16676 | 101.21 | 689 | 695 | 157.9 |
| D | 1 | 255 | 29954 | 162.88 | 738 | 718 | 179.5 |
| D | 7 | 38 | 26813 | 145.38 | 738 | 718 | 179.5 |
| D | 13 | 243 | 23655 | 127.79 | 738 | 718 | 179.5 |
Histogram calculated using DETX and DETY for each event in the final _common_clean file
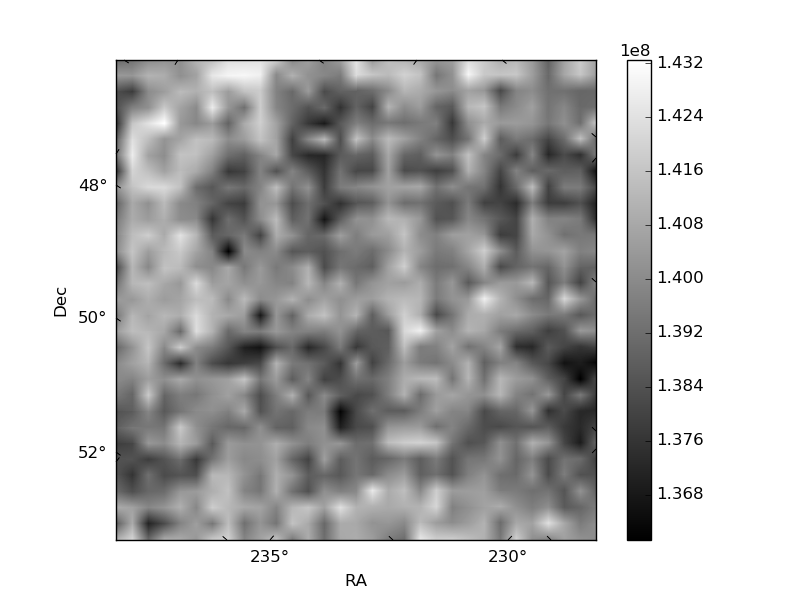
| Quadrant A | 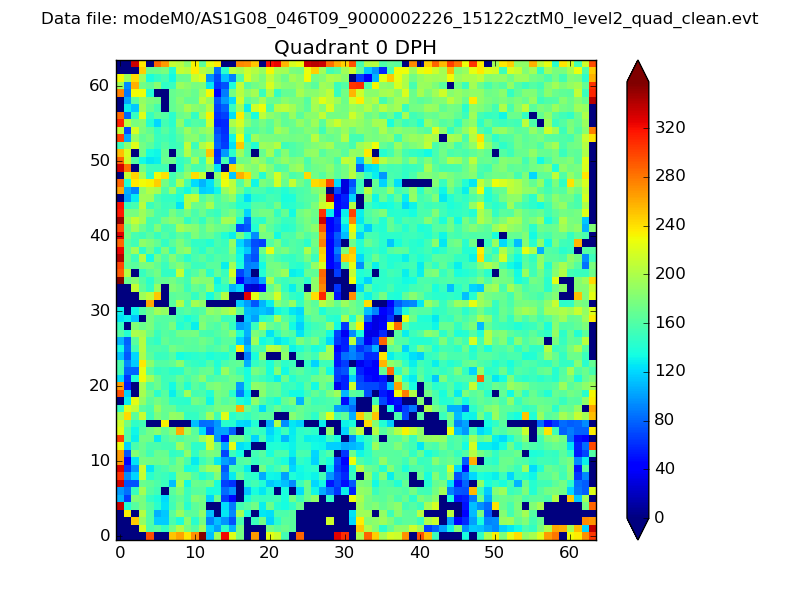 |
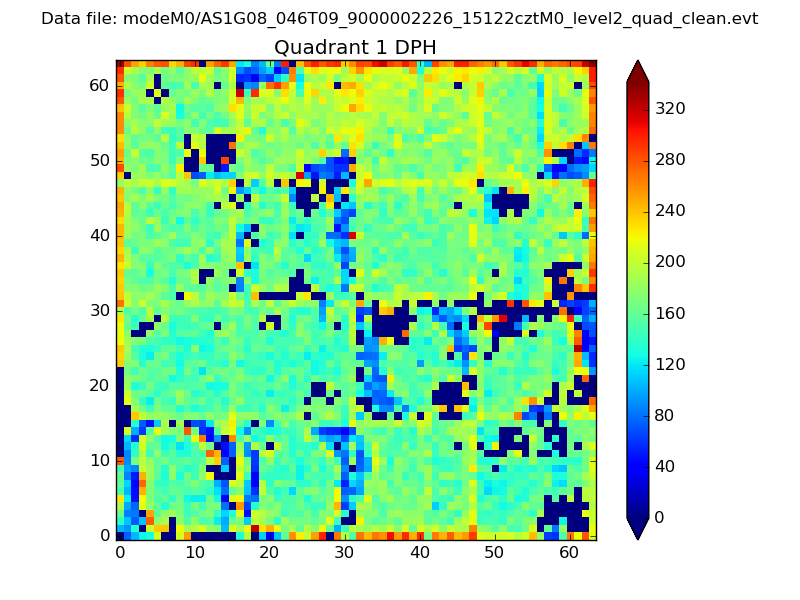 |
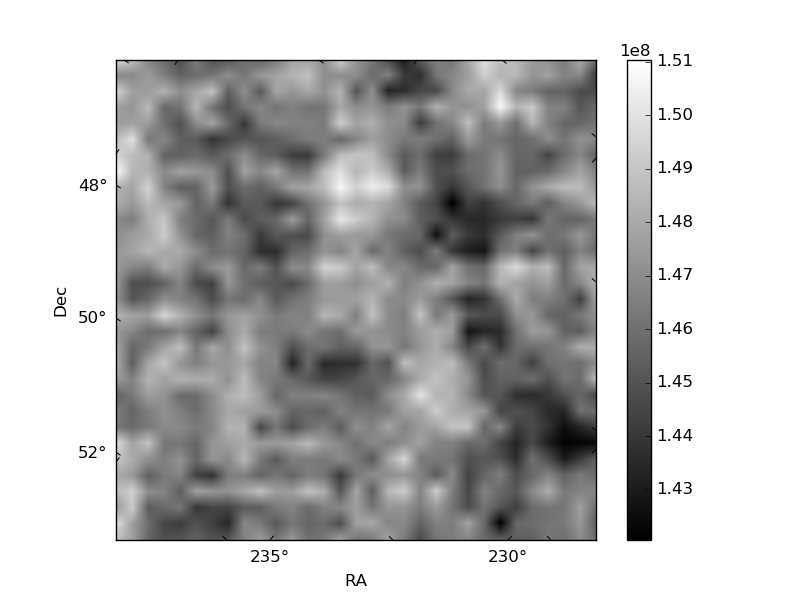
Quadrant B |
|---|---|---|---|
| Quadrant D |  |
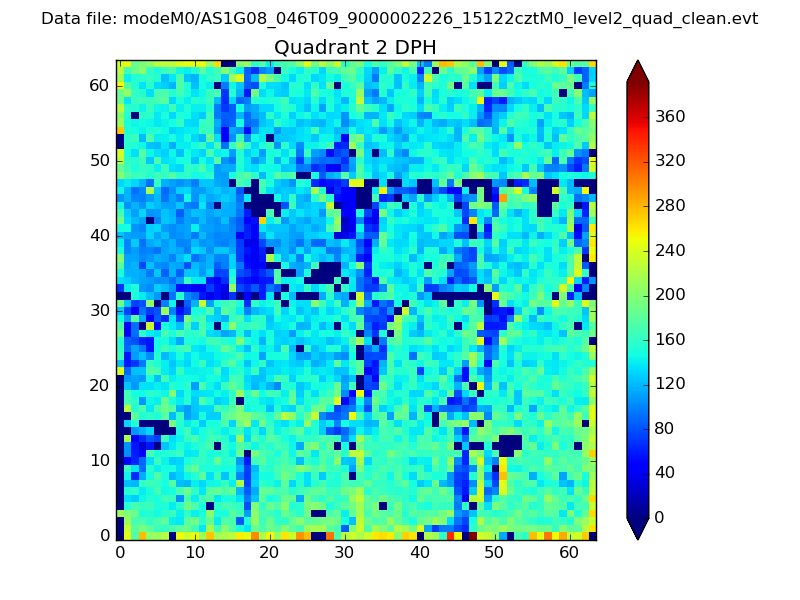 |
Quadrant C |
| Plot type | Count rate plots | Images |
|---|---|---|
| Comparison with Poisson distribution Blue bars denote a histogram of data divided into 1 sec bins. Red curve is a Poisson curve with rate = median count rate of data. |
 |
 |
| Quadrant-wise count rates Data is divided into 100 sec bins |
 |
|
| Module-wise count rates for Quadrant A Data is divided into 100 sec bins |
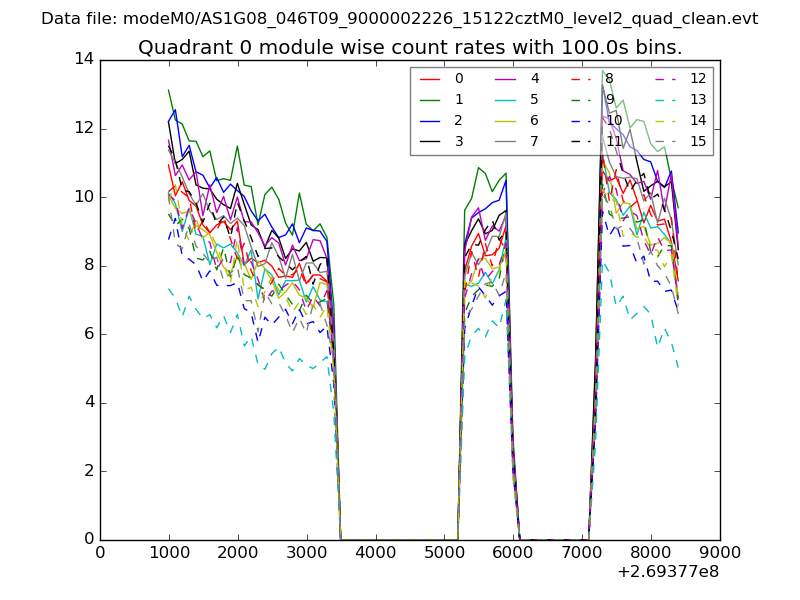 |
 |
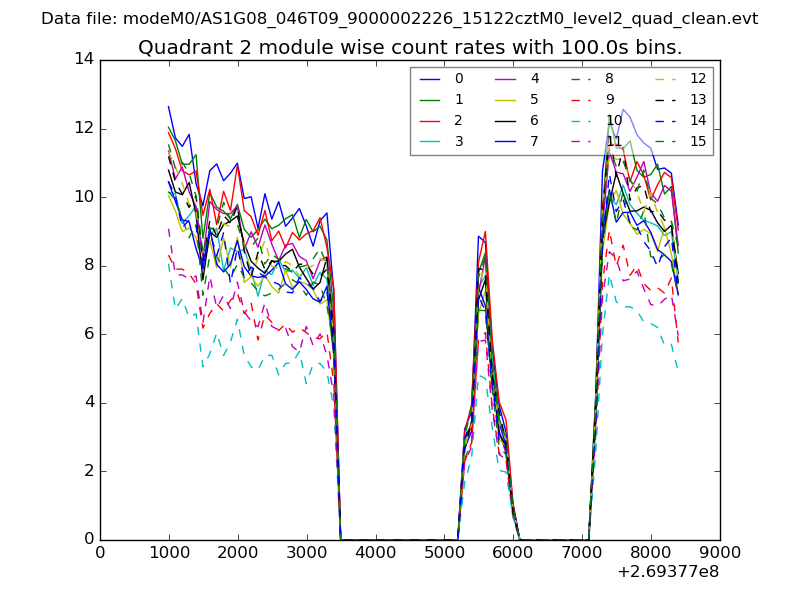
| Module-wise count rates for Quadrant B Data is divided into 100 sec bins |
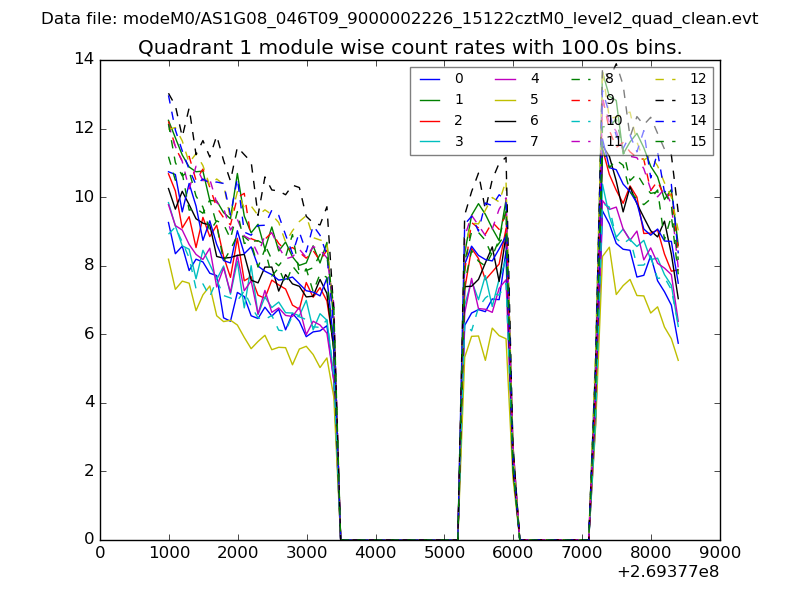 |
 |
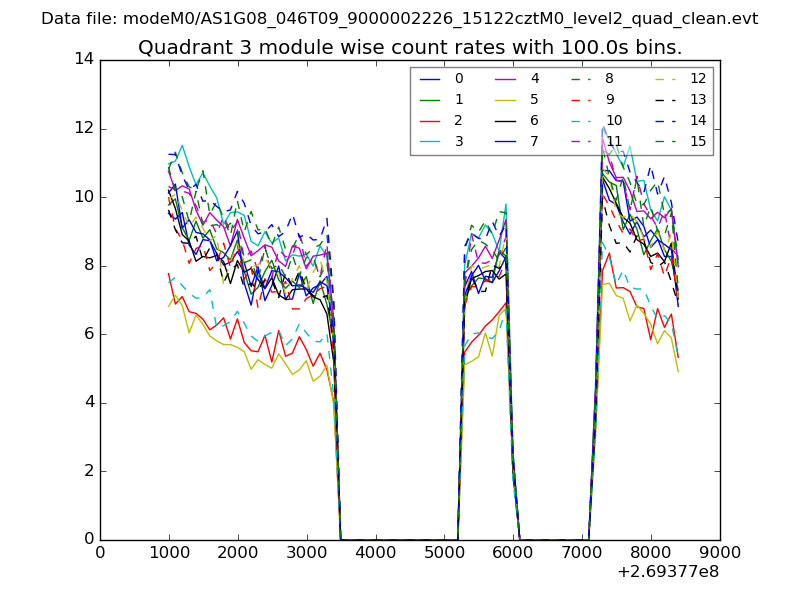
| Module-wise count rates for Quadrant C Data is divided into 100 sec bins |
 |
 |
| Module-wise count rates for Quadrant D Data is divided into 100 sec bins |
 |
 |
| Parameter | Plot |
|---|---|
| CZT HV Monitor | 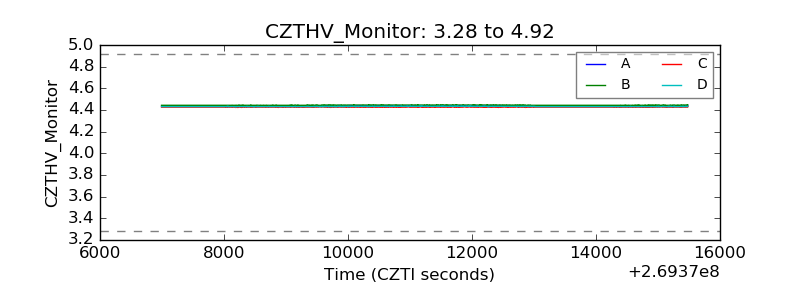 |
| D_VDD | 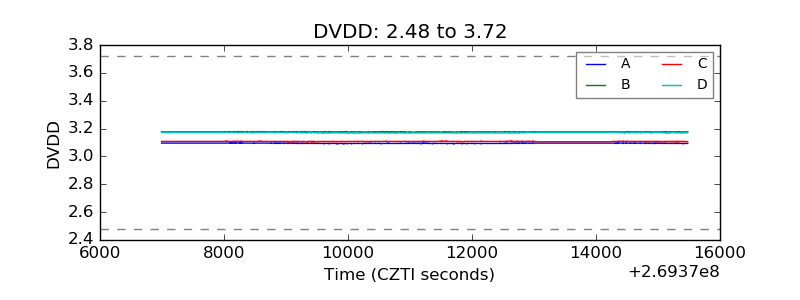 |
| Temperature 1 | 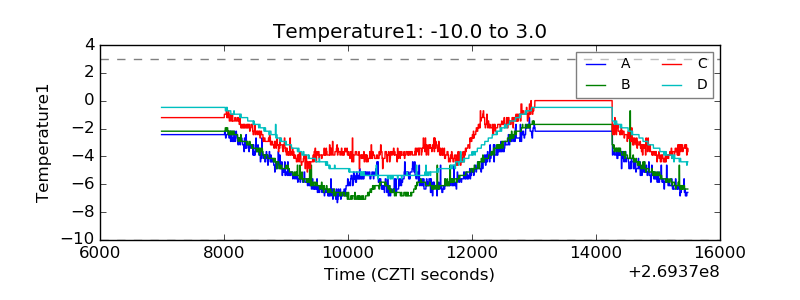 |
| Veto HV Monitor | 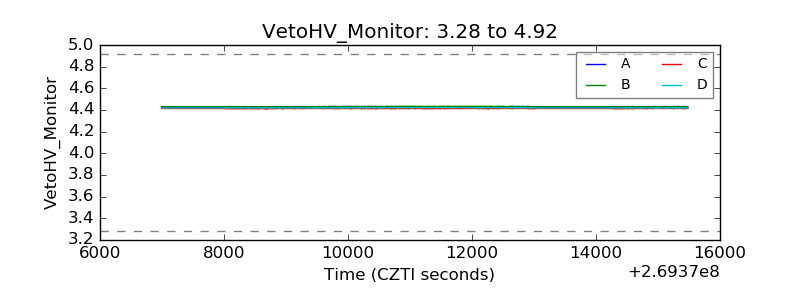 |
| Veto LLD | 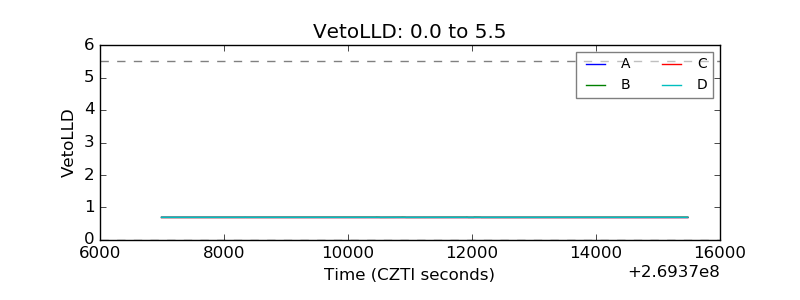 |
| Alpha Counter |  |
| _CPM_Rate |  |
| CZT Counter | 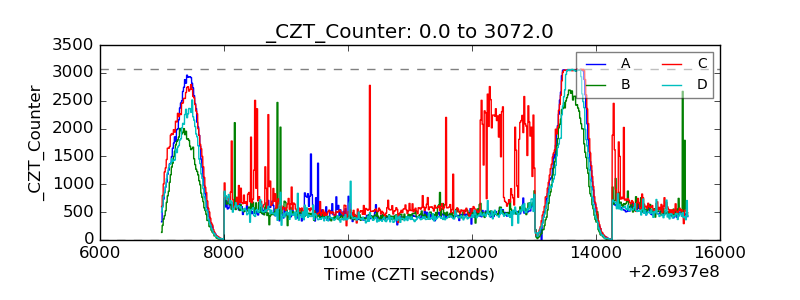 |
| +2.5 Volts monitor |  |
| +5 Volts monitor |  |
| _ROLL_ROT | 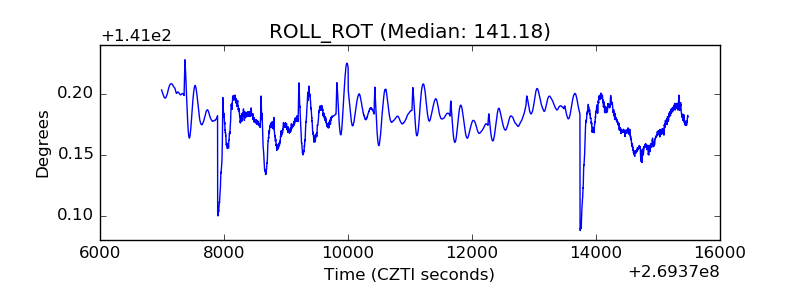 |
| _Roll_DEC | 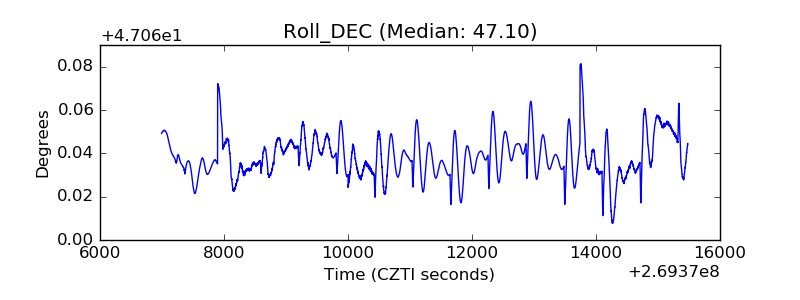 |
| _Roll_RA |  |
| Veto Counter | 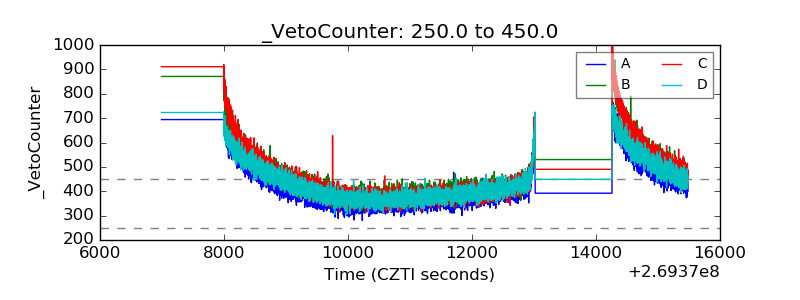 |