| Param | Original file | Final file |
|---|---|---|
| Filename | modeM0/AS1G08_046T09_9000002226_15124cztM0_level2.evt | modeM0/AS1G08_046T09_9000002226_15124cztM0_level2_quad_clean.evt |
| Size (bytes) | 453,346,560 | 97,836,480 |
| Size | 432.3 MB | 93.3 MB |
| Events in quadrant A | 3,009,642 | 640,453 |
| Events in quadrant B | 3,669,888 | 656,084 |
| Events in quadrant C | 3,551,452 | 633,828 |
| Events in quadrant D | 3,078,394 | 600,633 |
| Mode M0 | |||
|---|---|---|---|
| Quadrant | BADHDUFLAG | Total packets | Discarded packets |
| A | 0 | 12959 | 3 |
| B | 0 | 14867 | 2 |
| C | 0 | 14282 | 2 |
| D | 0 | 13467 | 2 |
| Mode M9 | |||
|---|---|---|---|
| Quadrant | BADHDUFLAG | Total packets | Discarded packets |
| A | 0 | 23 | 0 |
| B | 0 | 23 | 0 |
| C | 0 | 23 | 0 |
| D | 0 | 23 | 0 |
| Mode SS | |||
|---|---|---|---|
| Quadrant | BADHDUFLAG | Total packets | Discarded packets |
| A | 0 | 128 | 0 |
| B | 0 | 128 | 0 |
| C | 0 | 128 | 0 |
| D | 0 | 128 | 0 |
| Quadrant | Total seconds | Saturated seconds | Saturation percentage |
|---|---|---|---|
| A | 6180 | 22 | 0.355987% |
| B | 6180 | 91 | 1.472492% |
| C | 6180 | 90 | 1.456311% |
| D | 6180 | 85 | 1.375405% |
Noise dominated data is calculated using 1-second bins in cleaned event files. If a bin has >2000 counts, and if more than 50% of those come from <1% of pixels, then it is considered to be noise-dominated and hence unusable.
| Quadrant | # 1 sec bins | Bins with >0 counts | Bins with >2000 counts | High rate bins dominated by noise | Noise dominated (total time) | Noise dominated (detector-on time) | Marked lightcurve |
|---|---|---|---|---|---|---|---|
| A | 7476 | 6182 | 0 | 0 | 0.00% | 0.00% | 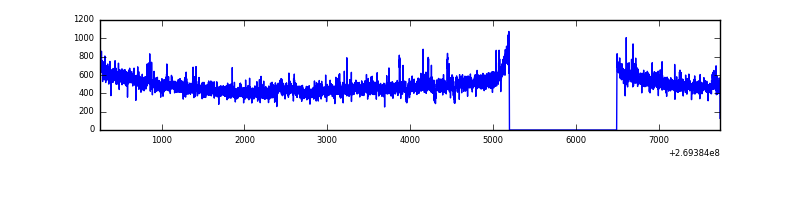 |
| B | 7476 | 6182 | 34 | 34 | 0.45% | 0.55% | 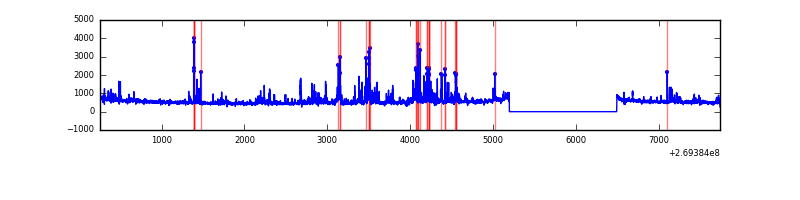 |
| C | 7476 | 6182 | 37 | 37 | 0.49% | 0.60% | 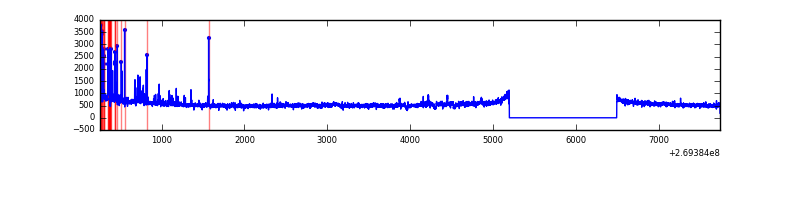 |
| D | 7476 | 6182 | 57 | 57 | 0.76% | 0.92% | 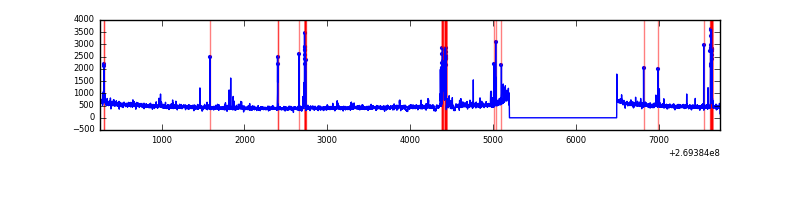 |
Top three noisy pixels from each quadrant. If the there are fewer than three noisy pixels in the level2.evt file, extra rows are filled as -1
| Pixel properties | Quadrant properties | ||||||
|---|---|---|---|---|---|---|---|
| Quadrant | DetID | PixID | Counts | Sigma | Mean | Median | Sigma |
| A | 12 | 189 | 59159 | 381.47 | 764 | 750 | 153.1 |
| A | 8 | 6 | 7211 | 42.2 | 764 | 750 | 153.1 |
| A | 0 | 226 | 6872 | 39.98 | 764 | 750 | 153.1 |
| B | 3 | 64 | 545330 | 3799.4 | 774 | 757 | 143.3 |
| B | 4 | 173 | 17443 | 116.42 | 774 | 757 | 143.3 |
| B | 12 | 111 | 16105 | 107.08 | 774 | 757 | 143.3 |
| C | 3 | 233 | 452163 | 2619.19 | 752 | 758 | 172.3 |
| C | 4 | 254 | 149832 | 864.97 | 752 | 758 | 172.3 |
| C | 14 | 234 | 10221 | 54.91 | 752 | 758 | 172.3 |
| D | 2 | 33 | 87736 | 484.91 | 740 | 718 | 179.5 |
| D | 10 | 70 | 59577 | 327.99 | 740 | 718 | 179.5 |
| D | 13 | 172 | 53576 | 294.55 | 740 | 718 | 179.5 |
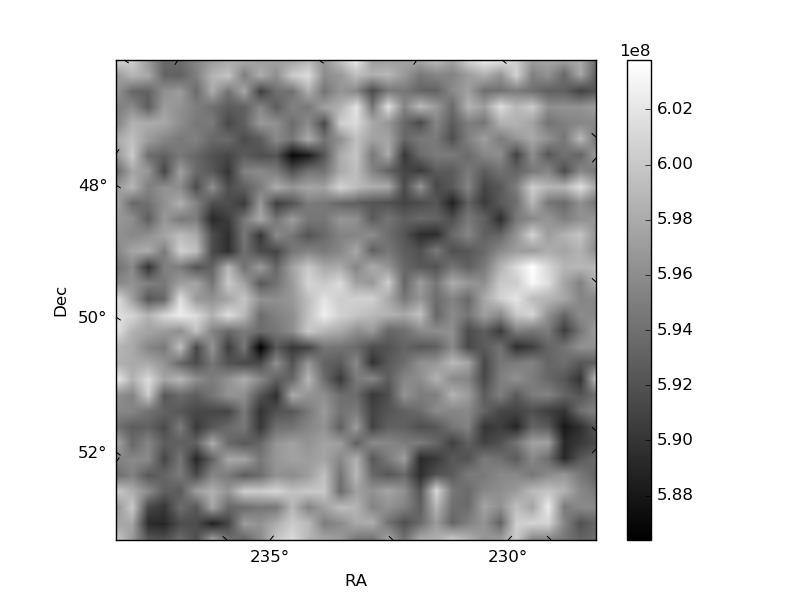
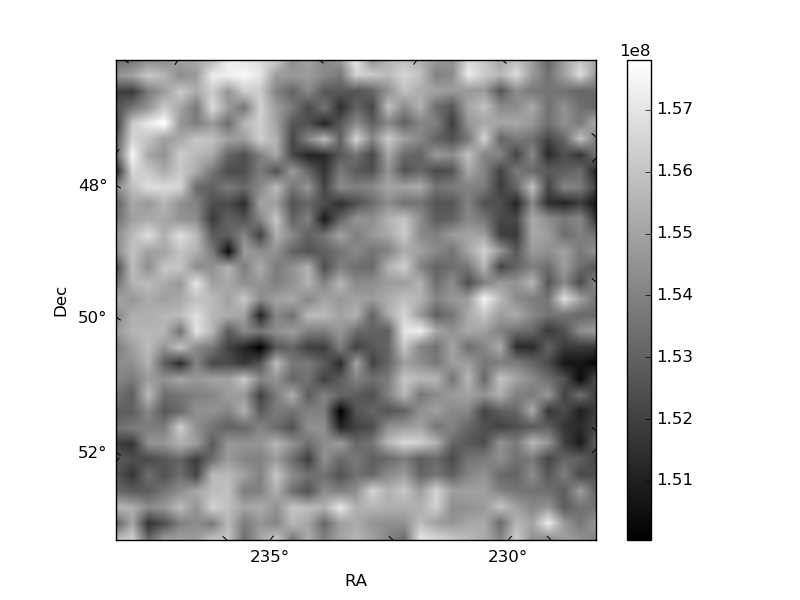
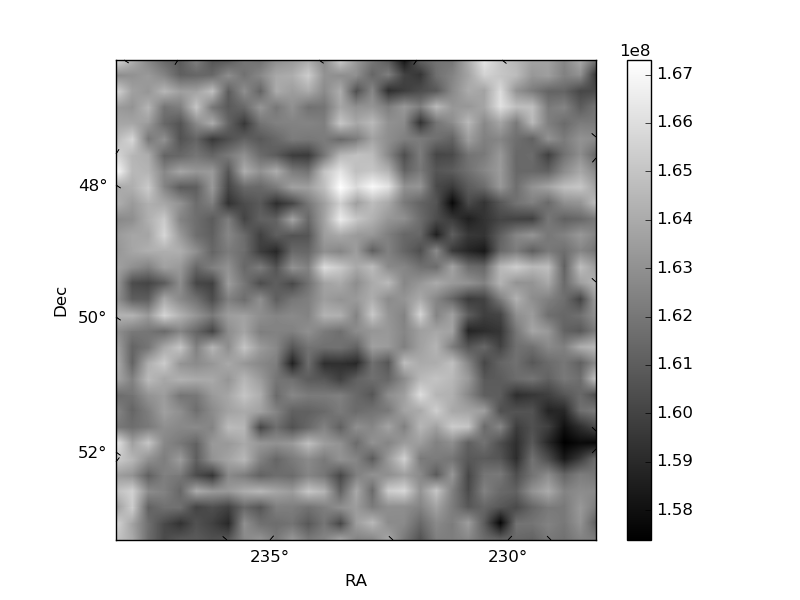
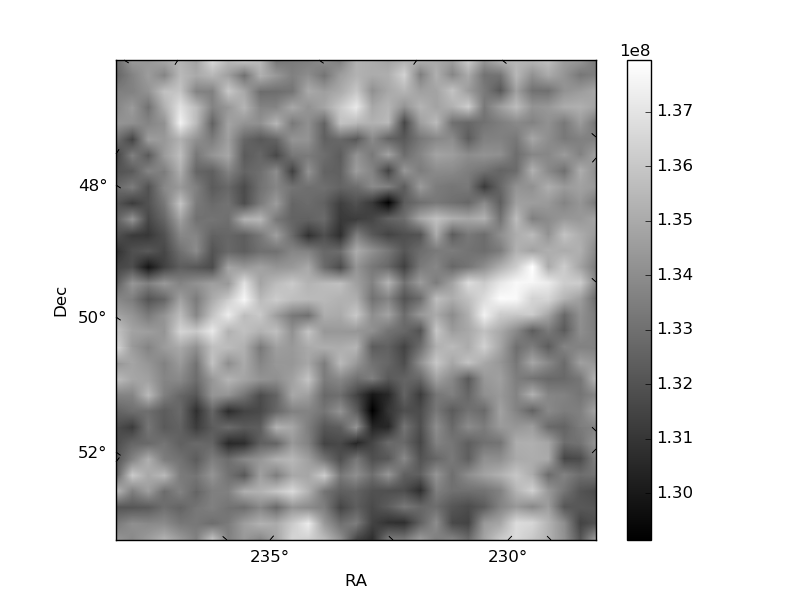
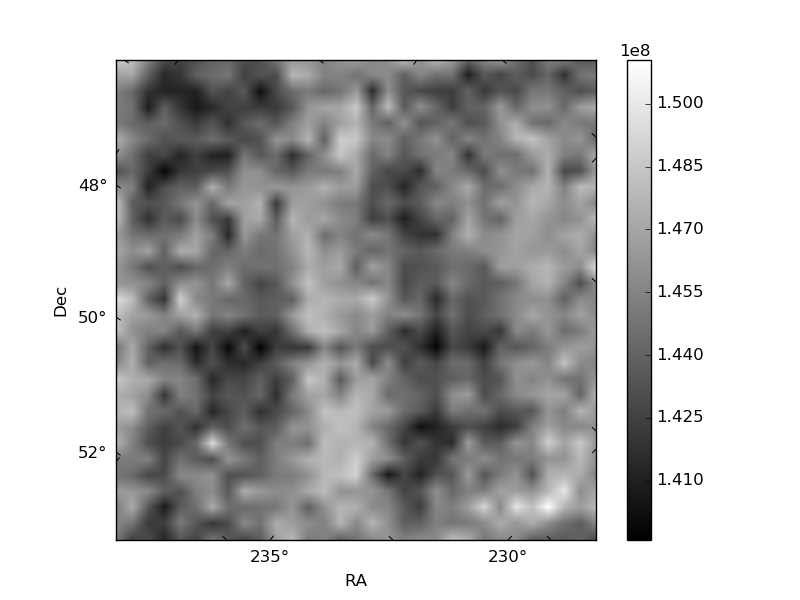
Histogram calculated using DETX and DETY for each event in the final _common_clean file
| Quadrant A | 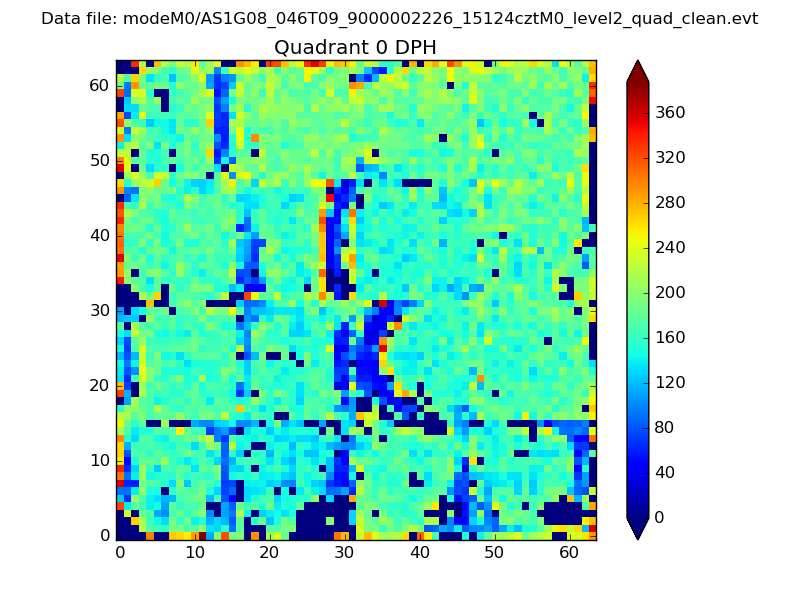 |
 |
Quadrant B |
|---|---|---|---|
| Quadrant D | 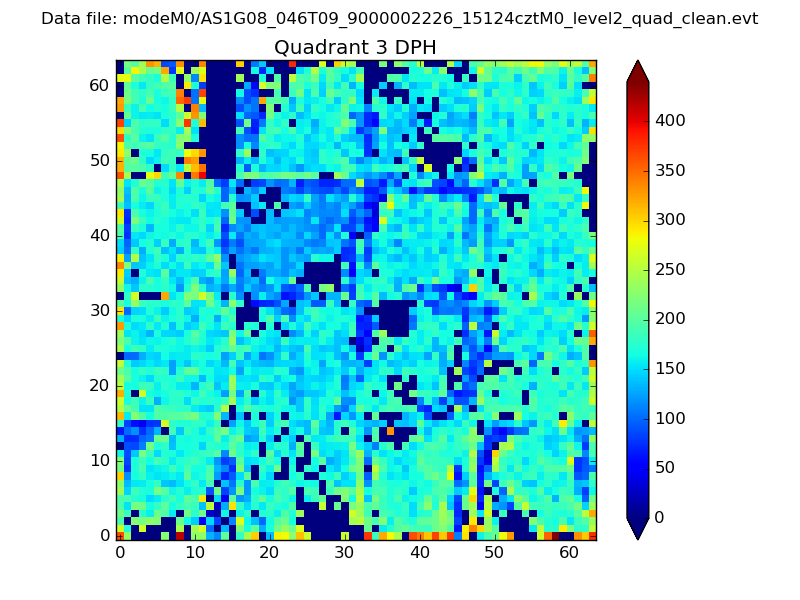 |
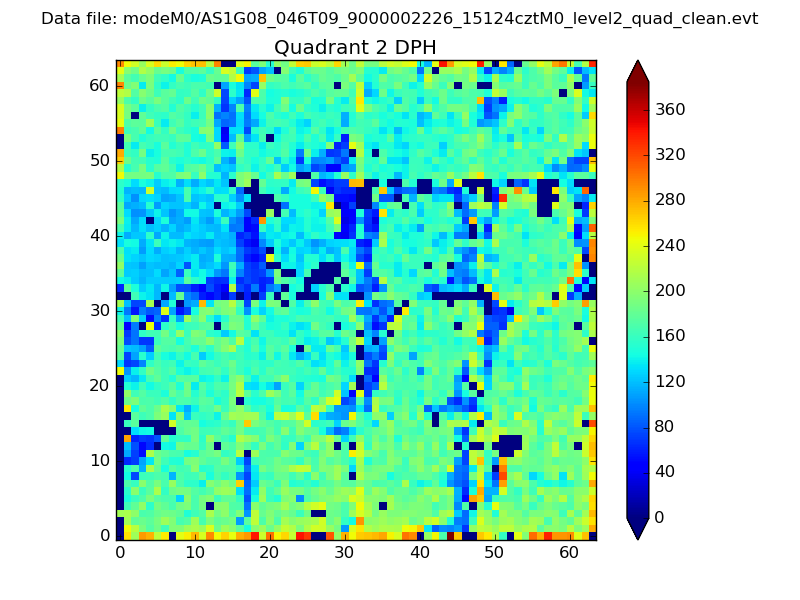 |
Quadrant C |
| Plot type | Count rate plots | Images |
|---|---|---|
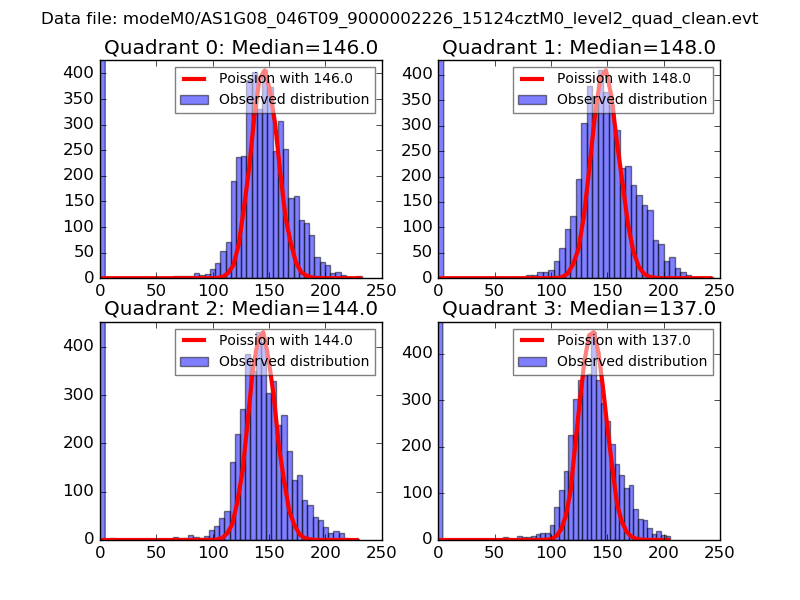
| Comparison with Poisson distribution Blue bars denote a histogram of data divided into 1 sec bins. Red curve is a Poisson curve with rate = median count rate of data. |
 |
 |
| Quadrant-wise count rates Data is divided into 100 sec bins |
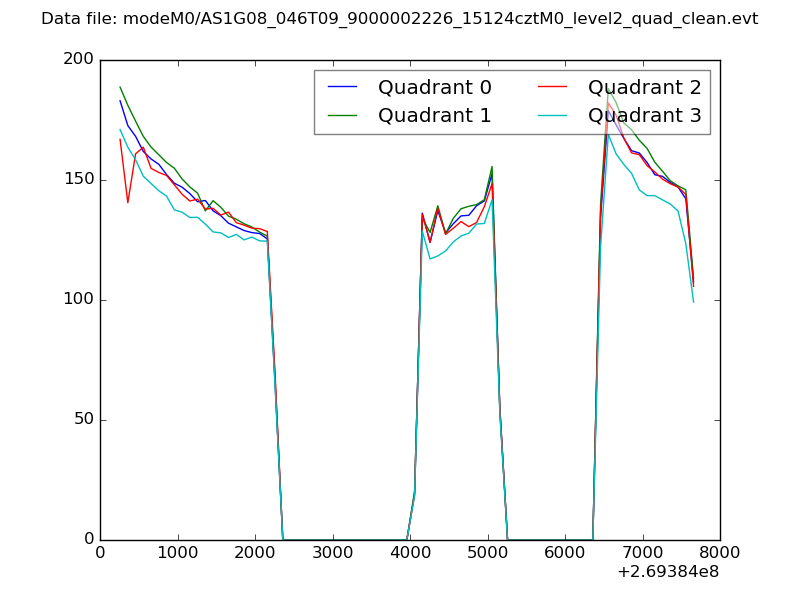 |
|
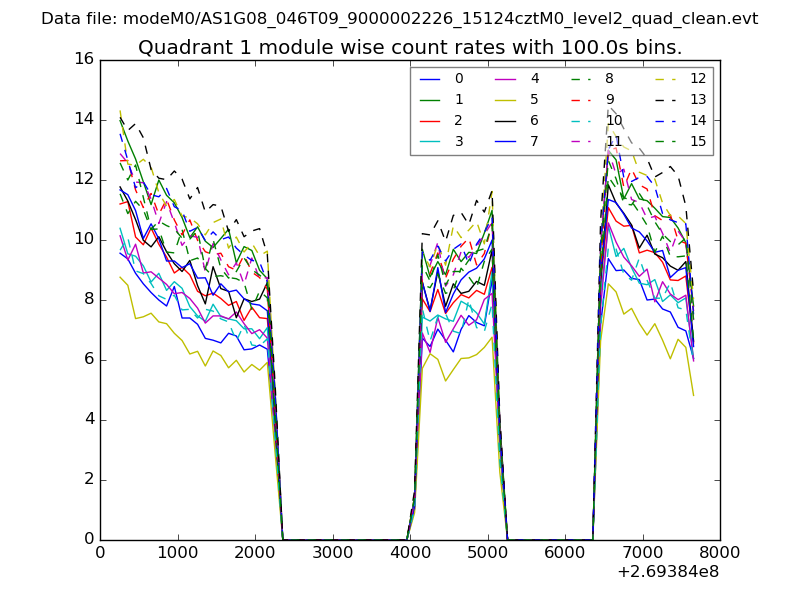
| Module-wise count rates for Quadrant A Data is divided into 100 sec bins |
 |
 |
| Module-wise count rates for Quadrant B Data is divided into 100 sec bins |
 |
 |
| Module-wise count rates for Quadrant C Data is divided into 100 sec bins |
 |
 |
| Module-wise count rates for Quadrant D Data is divided into 100 sec bins |
 |
 |
| Parameter | Plot |
|---|---|
| CZT HV Monitor |  |
| D_VDD | 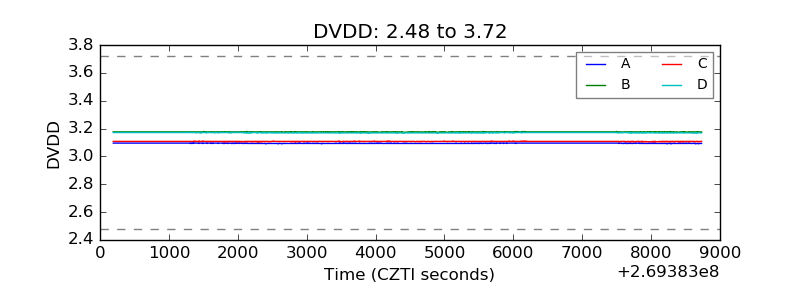 |
| Temperature 1 | 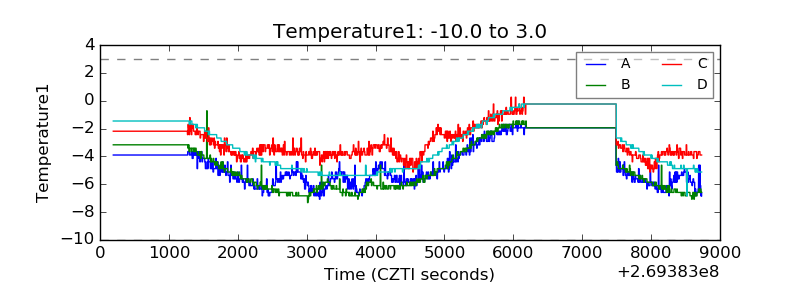 |
| Veto HV Monitor |  |
| Veto LLD | 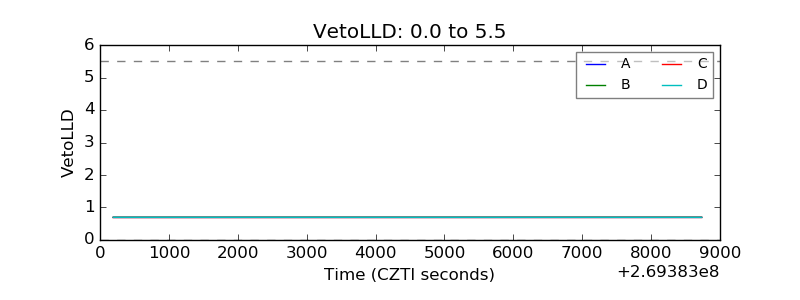 |
| Alpha Counter | 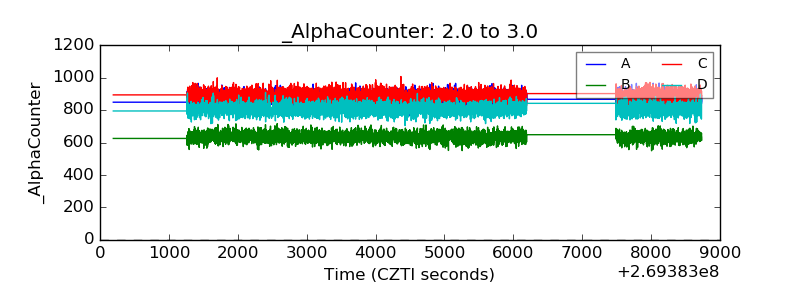 |
| _CPM_Rate | 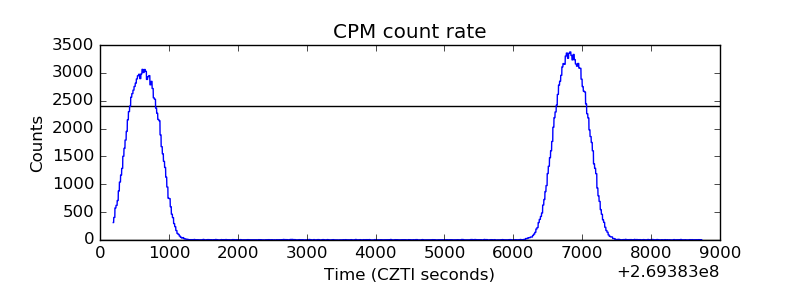 |
| CZT Counter | 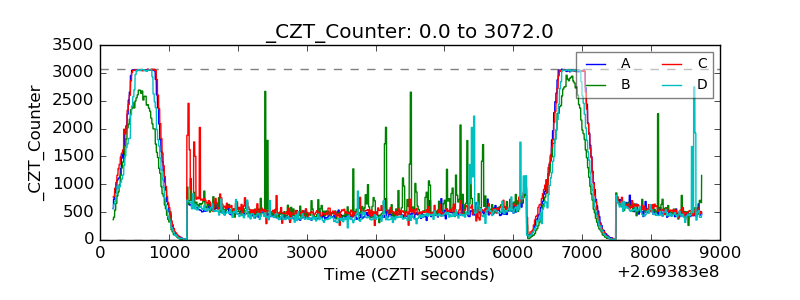 |
| +2.5 Volts monitor | 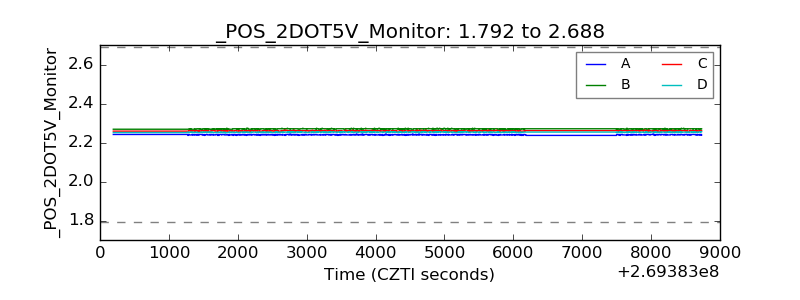 |
| +5 Volts monitor |  |
| _ROLL_ROT | 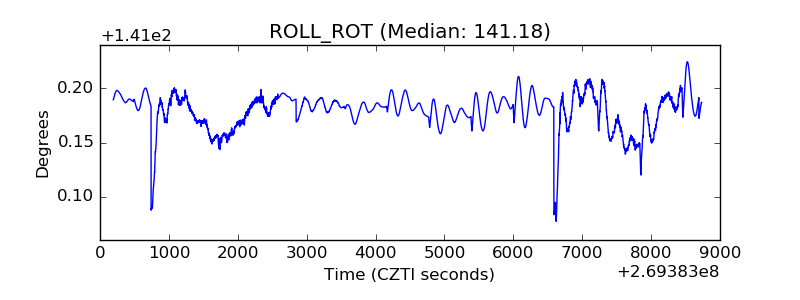 |
| _Roll_DEC |  |
| _Roll_RA | 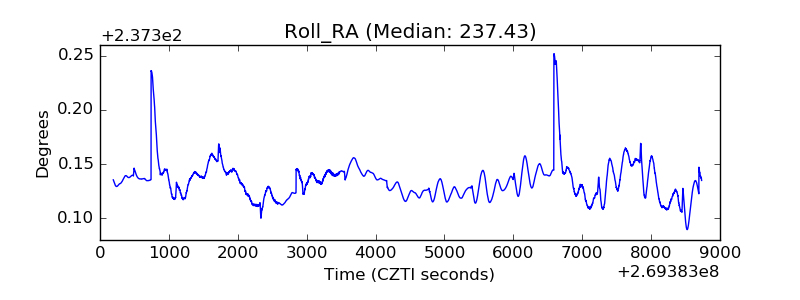 |
| Veto Counter | 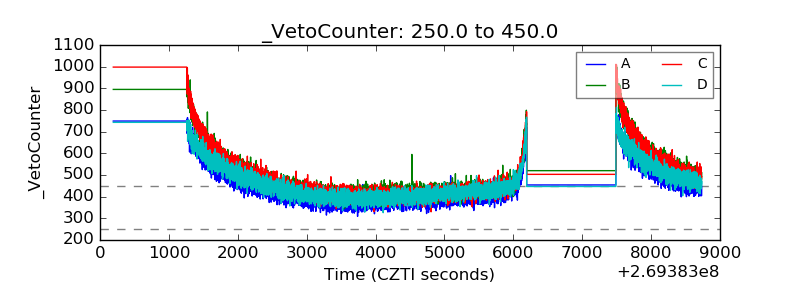 |