| Param | Original file | Final file |
|---|---|---|
| Filename | modeM0/AS1G08_046T09_9000002226_15126cztM0_level2.evt | modeM0/AS1G08_046T09_9000002226_15126cztM0_level2_quad_clean.evt |
| Size (bytes) | 438,670,080 | 90,855,360 |
| Size | 418.3 MB | 86.6 MB |
| Events in quadrant A | 3,022,008 | 588,533 |
| Events in quadrant B | 3,361,772 | 600,634 |
| Events in quadrant C | 3,475,775 | 580,182 |
| Events in quadrant D | 3,004,743 | 549,886 |
| Mode M0 | |||
|---|---|---|---|
| Quadrant | BADHDUFLAG | Total packets | Discarded packets |
| A | 0 | 12888 | 3 |
| B | 0 | 13875 | 2 |
| C | 0 | 14122 | 2 |
| D | 0 | 13229 | 2 |
| Mode M9 | |||
|---|---|---|---|
| Quadrant | BADHDUFLAG | Total packets | Discarded packets |
| A | 0 | 27 | 0 |
| B | 0 | 27 | 0 |
| C | 0 | 27 | 0 |
| D | 0 | 27 | 0 |
| Mode SS | |||
|---|---|---|---|
| Quadrant | BADHDUFLAG | Total packets | Discarded packets |
| A | 0 | 130 | 0 |
| B | 0 | 130 | 0 |
| C | 0 | 130 | 0 |
| D | 0 | 130 | 0 |
| Quadrant | Total seconds | Saturated seconds | Saturation percentage |
|---|---|---|---|
| A | 6184 | 30 | 0.485123% |
| B | 6184 | 81 | 1.309832% |
| C | 6184 | 60 | 0.970246% |
| D | 6184 | 43 | 0.695343% |
Noise dominated data is calculated using 1-second bins in cleaned event files. If a bin has >2000 counts, and if more than 50% of those come from <1% of pixels, then it is considered to be noise-dominated and hence unusable.
| Quadrant | # 1 sec bins | Bins with >0 counts | Bins with >2000 counts | High rate bins dominated by noise | Noise dominated (total time) | Noise dominated (detector-on time) | Marked lightcurve |
|---|---|---|---|---|---|---|---|
| A | 8935 | 6187 | 0 | 0 | 0.00% | 0.00% | 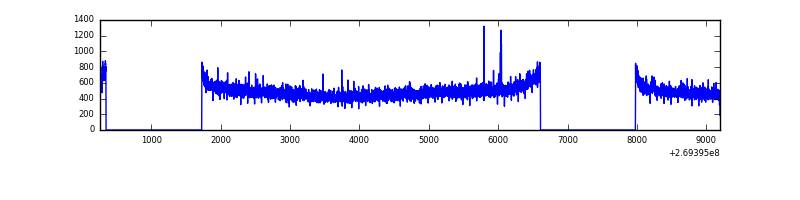 |
| B | 8935 | 6187 | 17 | 17 | 0.19% | 0.27% | 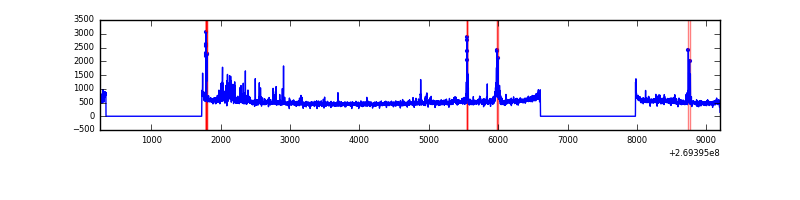 |
| C | 8935 | 6187 | 6 | 6 | 0.07% | 0.10% | 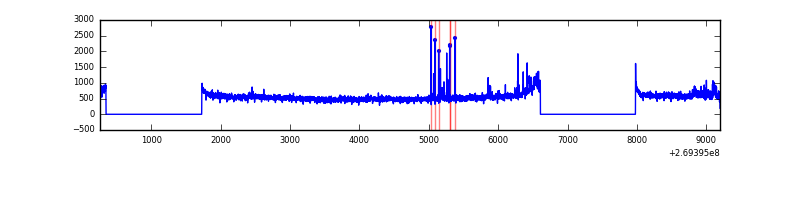 |
| D | 8935 | 6187 | 27 | 27 | 0.30% | 0.44% | 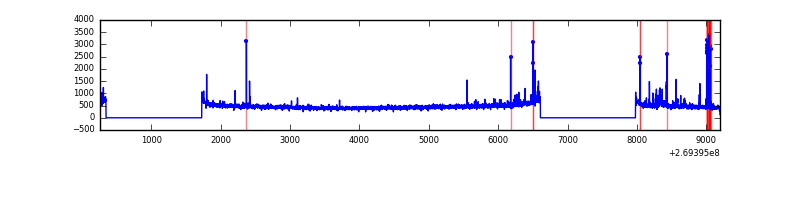 |
Top three noisy pixels from each quadrant. If the there are fewer than three noisy pixels in the level2.evt file, extra rows are filled as -1
| Pixel properties | Quadrant properties | ||||||
|---|---|---|---|---|---|---|---|
| Quadrant | DetID | PixID | Counts | Sigma | Mean | Median | Sigma |
| A | 12 | 189 | 25214 | 157.45 | 778 | 763 | 155.3 |
| A | 0 | 226 | 7067 | 40.59 | 778 | 763 | 155.3 |
| A | 13 | 248 | 6808 | 38.93 | 778 | 763 | 155.3 |
| B | 3 | 64 | 146190 | 1002.78 | 782 | 762 | 145.0 |
| B | 10 | 245 | 107650 | 737.04 | 782 | 762 | 145.0 |
| B | 4 | 48 | 23340 | 155.68 | 782 | 762 | 145.0 |
| C | 3 | 233 | 491023 | 2829.83 | 756 | 761 | 173.2 |
| C | 0 | 207 | 36137 | 204.19 | 756 | 761 | 173.2 |
| C | 13 | 61 | 5509 | 27.41 | 756 | 761 | 173.2 |
| D | 2 | 33 | 99582 | 550.03 | 744 | 723 | 179.7 |
| D | 9 | 1 | 26278 | 142.18 | 744 | 723 | 179.7 |
| D | 2 | 234 | 23017 | 124.04 | 744 | 723 | 179.7 |
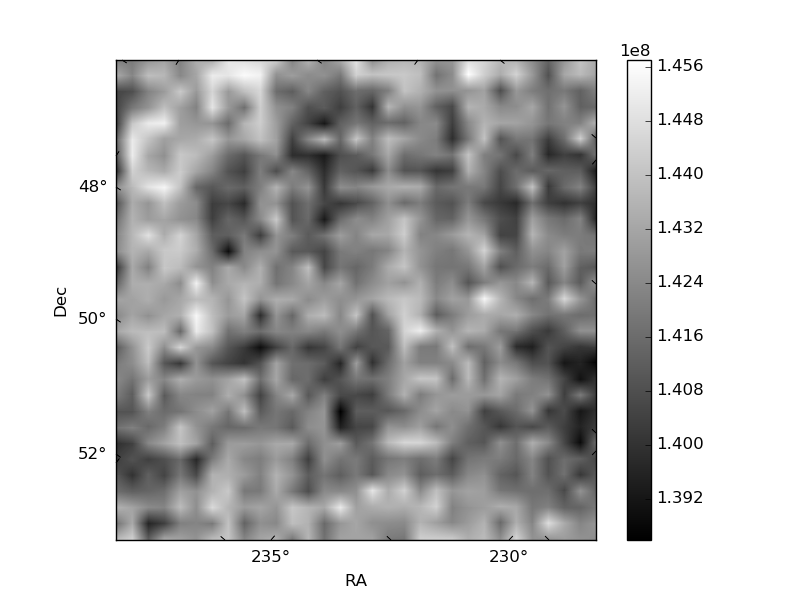
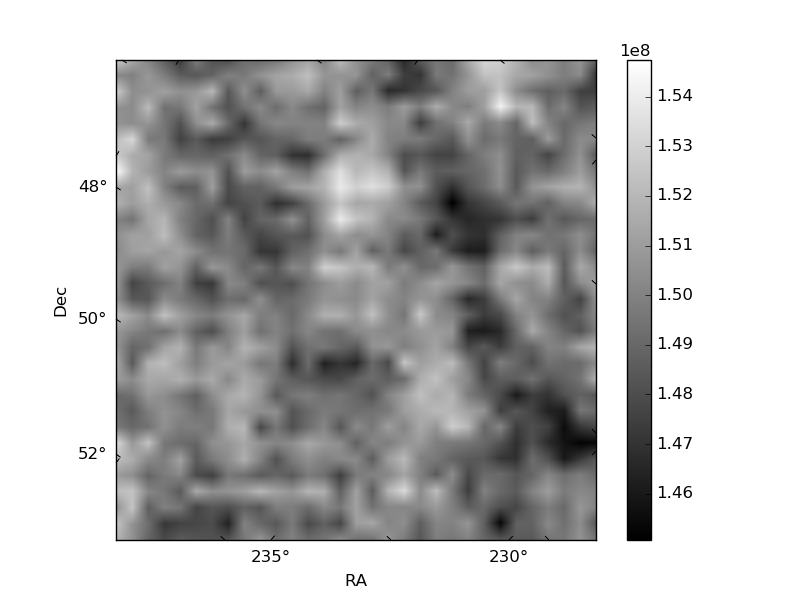
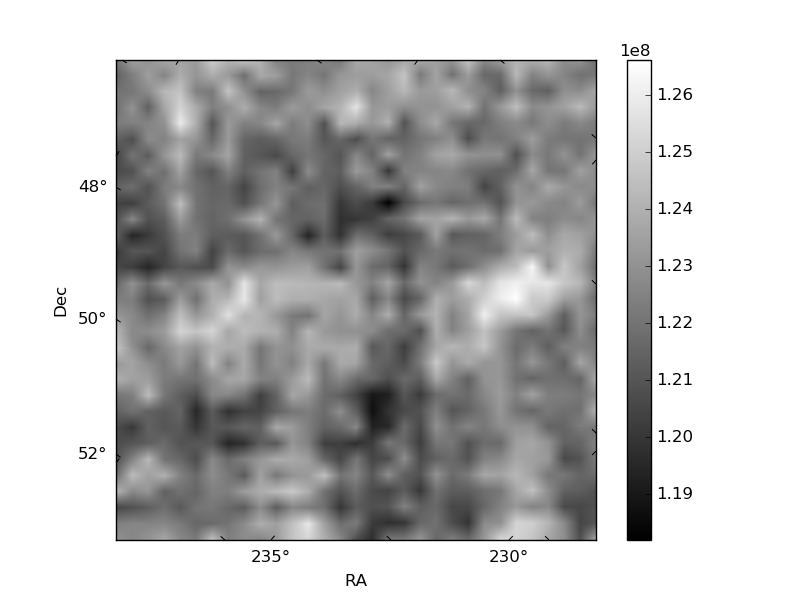
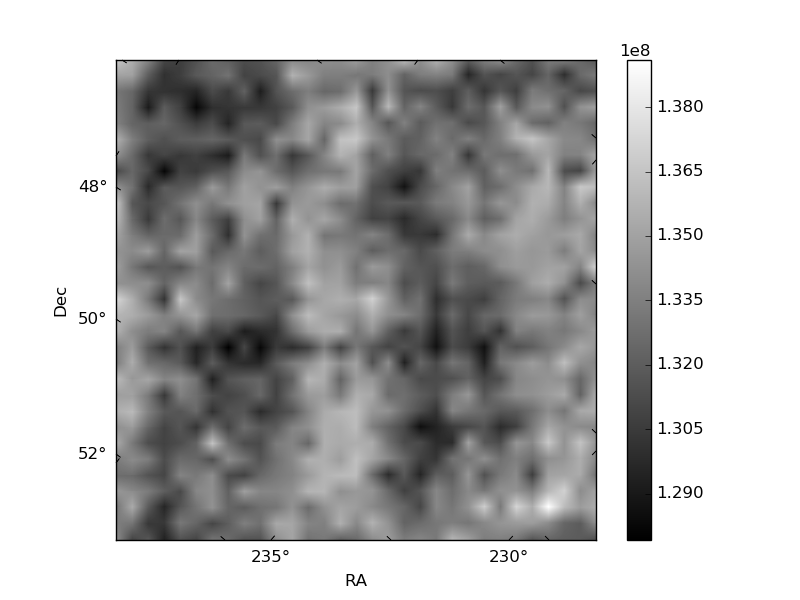
Histogram calculated using DETX and DETY for each event in the final _common_clean file
| Quadrant A | 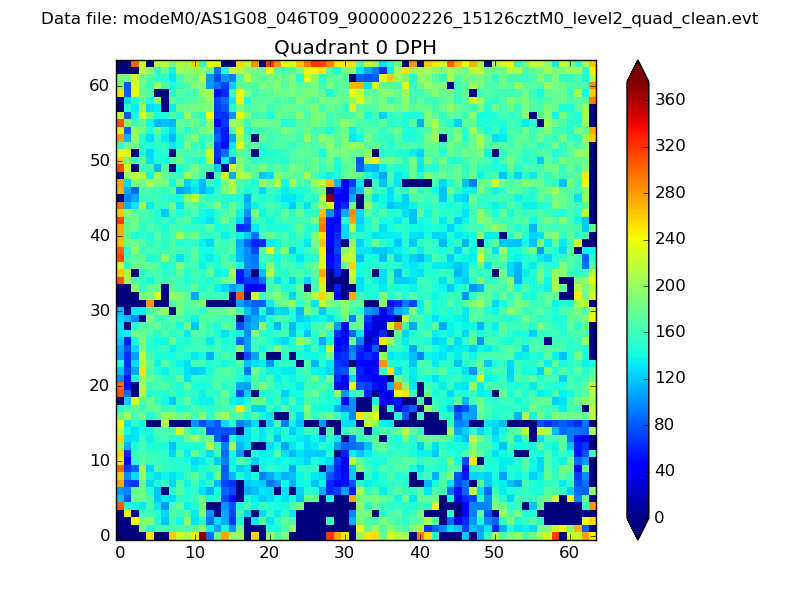 |
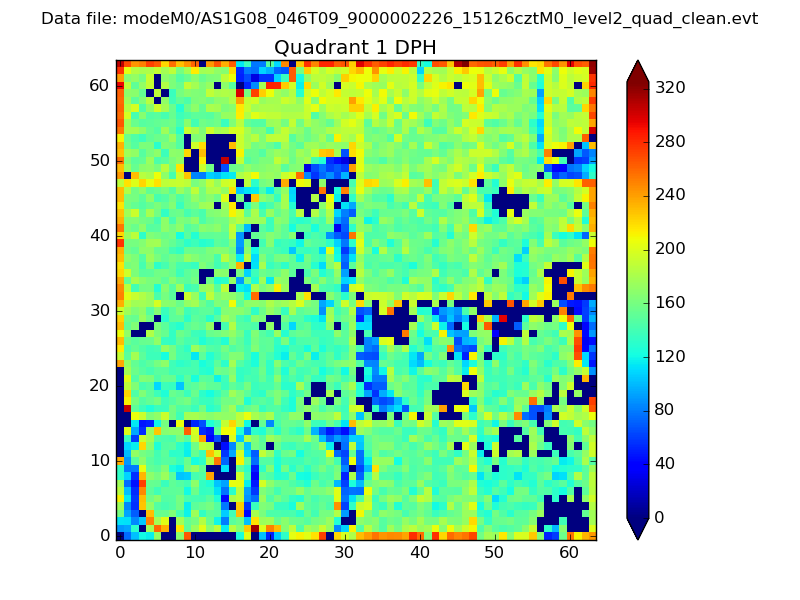 |
Quadrant B |
|---|---|---|---|
| Quadrant D | 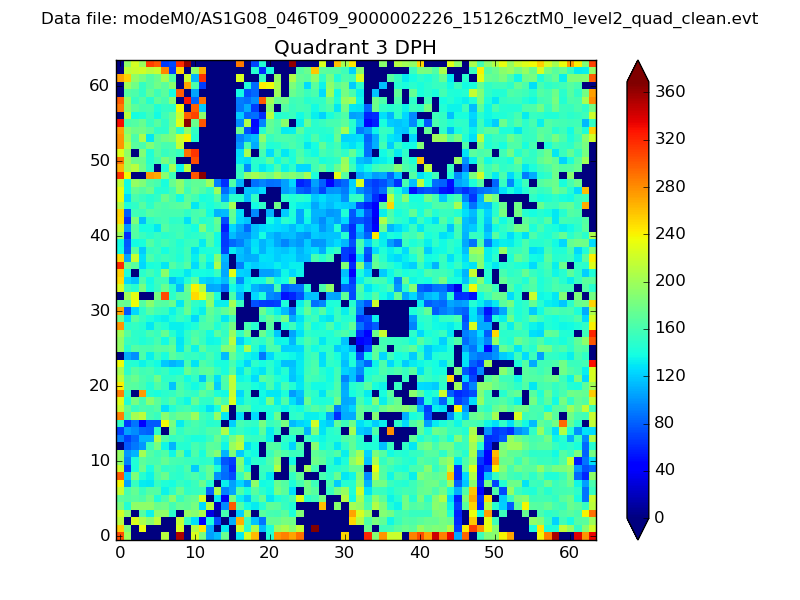 |
 |
Quadrant C |
| Plot type | Count rate plots | Images |
|---|---|---|
| Comparison with Poisson distribution Blue bars denote a histogram of data divided into 1 sec bins. Red curve is a Poisson curve with rate = median count rate of data. |
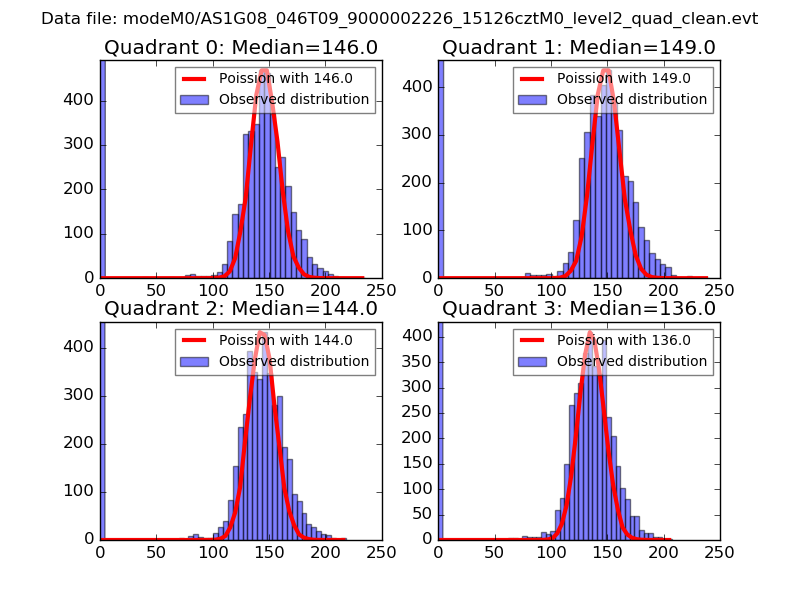 |
 |
| Quadrant-wise count rates Data is divided into 100 sec bins |
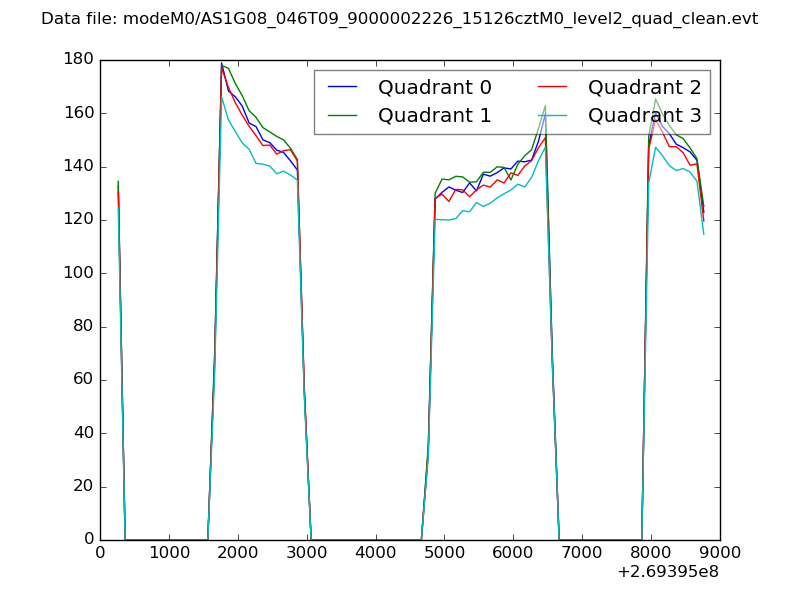 |
|
| Module-wise count rates for Quadrant A Data is divided into 100 sec bins |
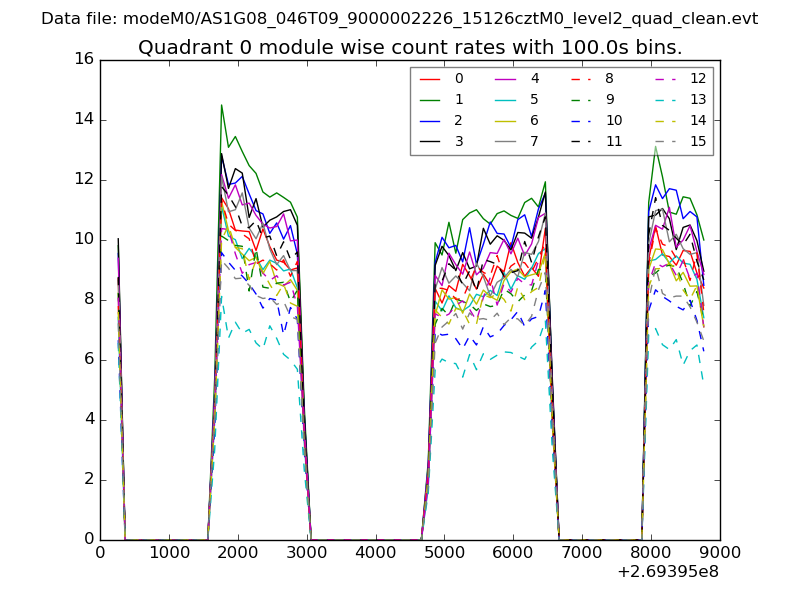 |
 |
| Module-wise count rates for Quadrant B Data is divided into 100 sec bins |
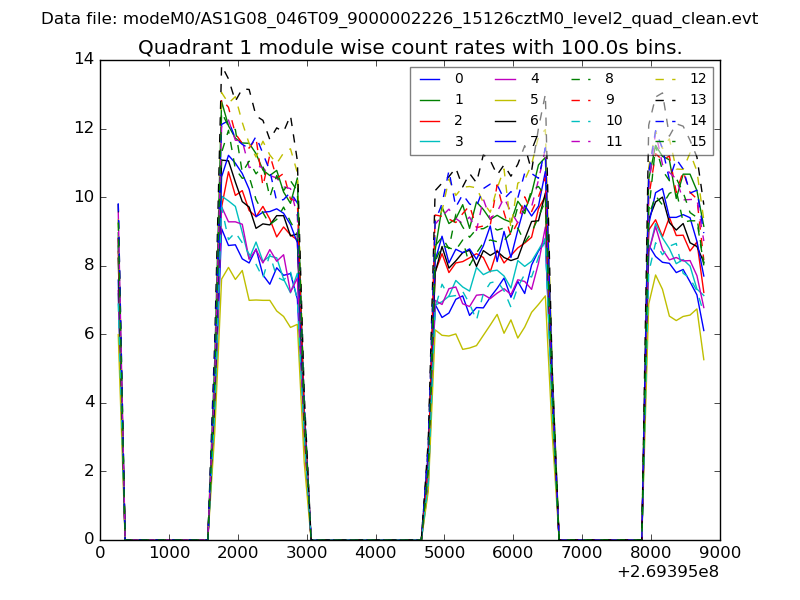 |
 |
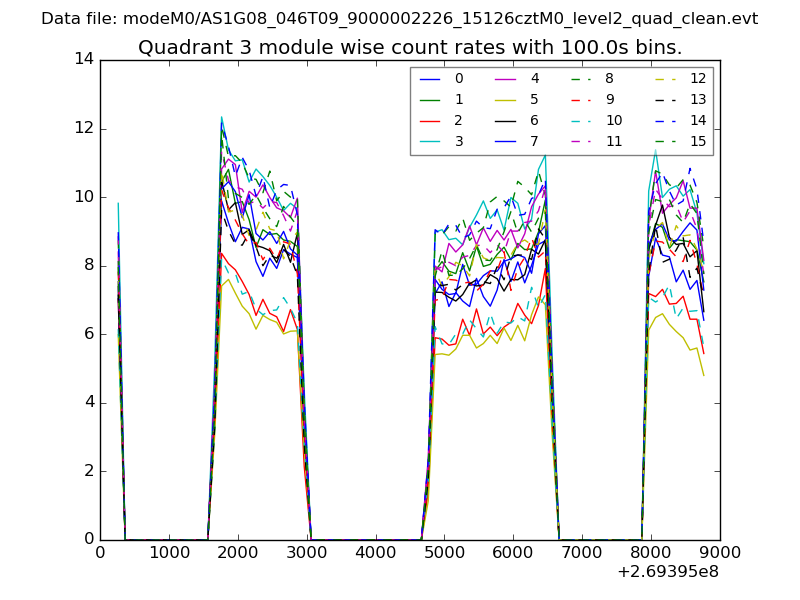
| Module-wise count rates for Quadrant C Data is divided into 100 sec bins |
 |
 |
| Module-wise count rates for Quadrant D Data is divided into 100 sec bins |
 |
 |
| Parameter | Plot |
|---|---|
| CZT HV Monitor | 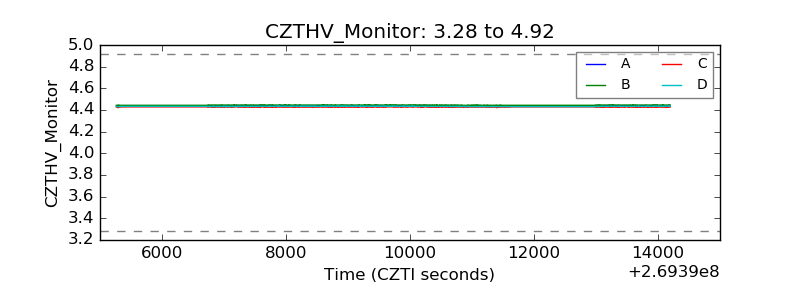 |
| D_VDD | 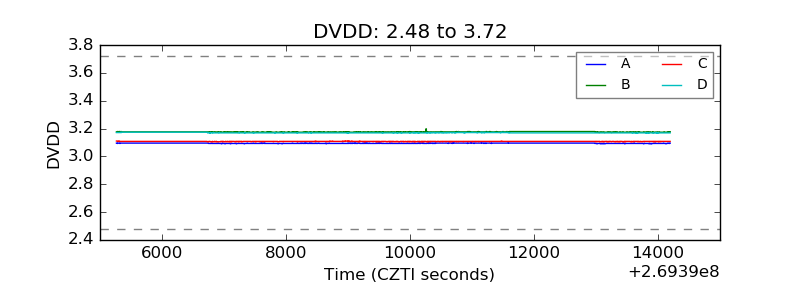 |
| Temperature 1 | 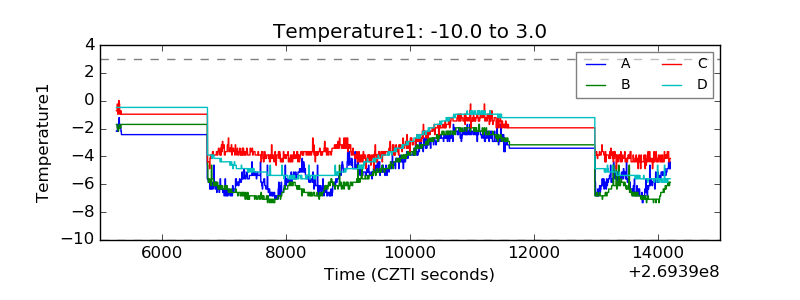 |
| Veto HV Monitor | 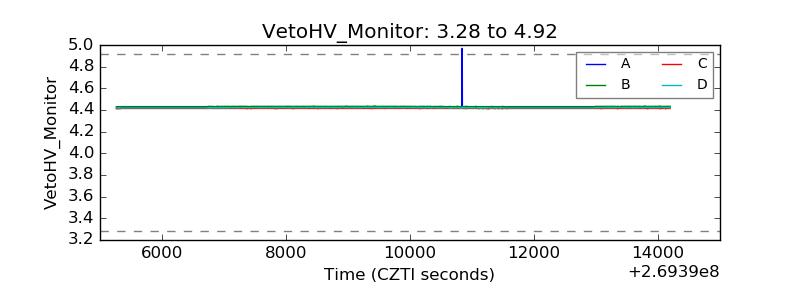 |
| Veto LLD | 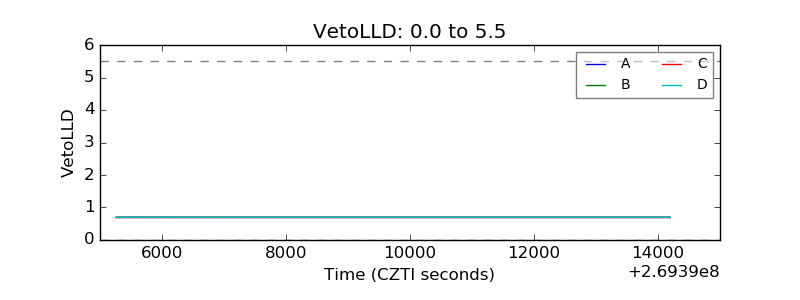 |
| Alpha Counter |  |
| _CPM_Rate | 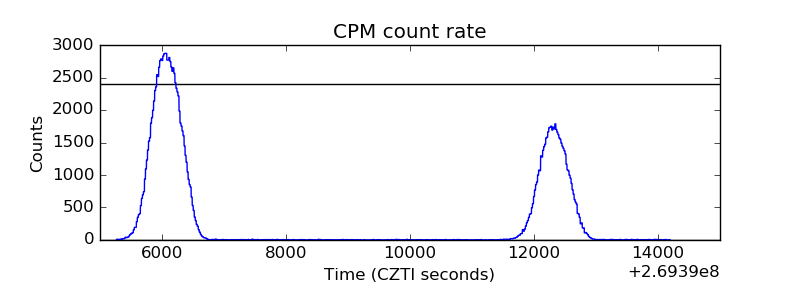 |
| CZT Counter | 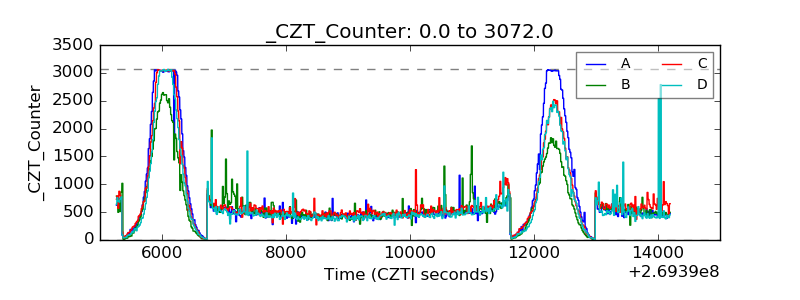 |
| +2.5 Volts monitor |  |
| +5 Volts monitor |  |
| _ROLL_ROT | 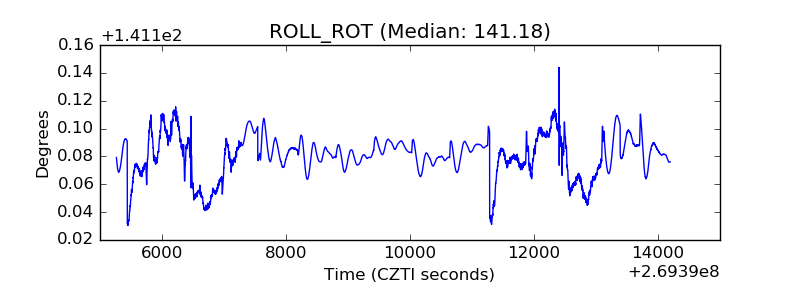 |
| _Roll_DEC | 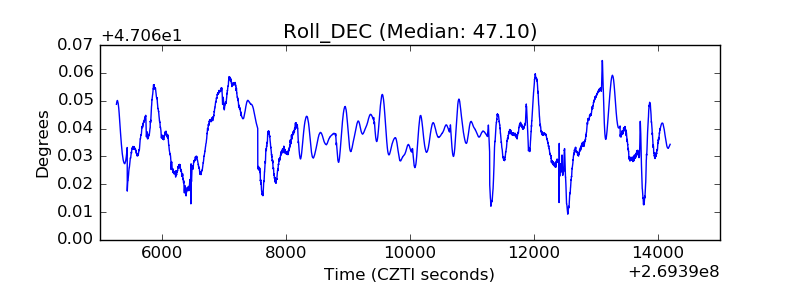 |
| _Roll_RA | 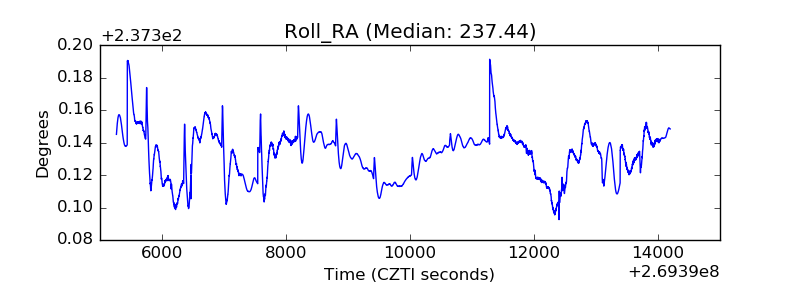 |
| Veto Counter | 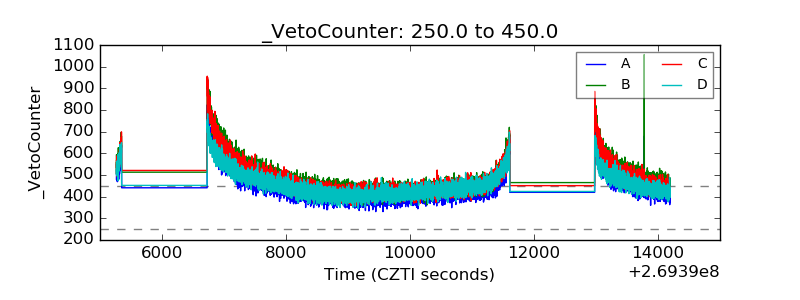 |