| Param | Original file | Final file |
|---|---|---|
| Filename | modeM0/AS1G08_046T09_9000002226_15128cztM0_level2.evt | modeM0/AS1G08_046T09_9000002226_15128cztM0_level2_quad_clean.evt |
| Size (bytes) | 480,015,360 | 78,108,480 |
| Size | 457.8 MB | 74.5 MB |
| Events in quadrant A | 3,207,919 | 483,552 |
| Events in quadrant B | 3,370,297 | 488,293 |
| Events in quadrant C | 3,690,082 | 473,937 |
| Events in quadrant D | 3,807,840 | 446,183 |
| Mode M0 | |||
|---|---|---|---|
| Quadrant | BADHDUFLAG | Total packets | Discarded packets |
| A | 0 | 13919 | 3 |
| B | 0 | 14181 | 2 |
| C | 0 | 14924 | 2 |
| D | 0 | 16134 | 2 |
| Mode M9 | |||
|---|---|---|---|
| Quadrant | BADHDUFLAG | Total packets | Discarded packets |
| A | 0 | 9 | 0 |
| B | 0 | 9 | 0 |
| C | 0 | 9 | 0 |
| D | 0 | 9 | 0 |
| Mode SS | |||
|---|---|---|---|
| Quadrant | BADHDUFLAG | Total packets | Discarded packets |
| A | 0 | 136 | 0 |
| B | 0 | 136 | 0 |
| C | 0 | 136 | 0 |
| D | 0 | 136 | 0 |
| Quadrant | Total seconds | Saturated seconds | Saturation percentage |
|---|---|---|---|
| A | 6794 | 72 | 1.059759% |
| B | 6794 | 99 | 1.457168% |
| C | 6794 | 55 | 0.809538% |
| D | 6794 | 332 | 4.886665% |
Noise dominated data is calculated using 1-second bins in cleaned event files. If a bin has >2000 counts, and if more than 50% of those come from <1% of pixels, then it is considered to be noise-dominated and hence unusable.
| Quadrant | # 1 sec bins | Bins with >0 counts | Bins with >2000 counts | High rate bins dominated by noise | Noise dominated (total time) | Noise dominated (detector-on time) | Marked lightcurve |
|---|---|---|---|---|---|---|---|
| A | 7635 | 6796 | 1 | 1 | 0.01% | 0.01% | 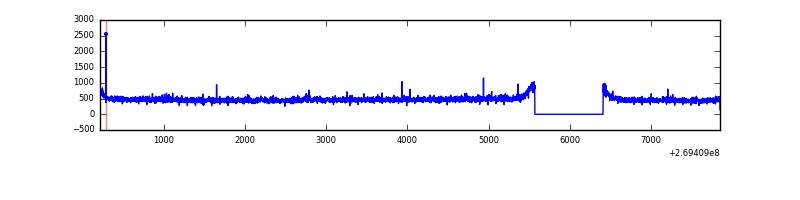 |
| B | 7635 | 6795 | 0 | 0 | 0.00% | 0.00% | 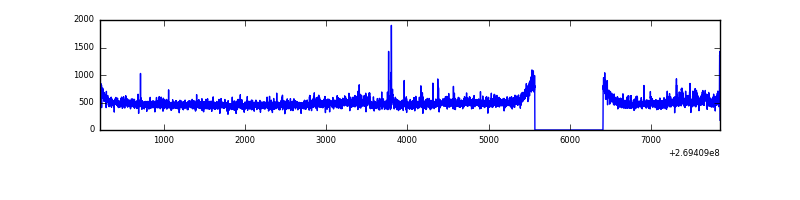 |
| C | 7635 | 6795 | 0 | 0 | 0.00% | 0.00% | 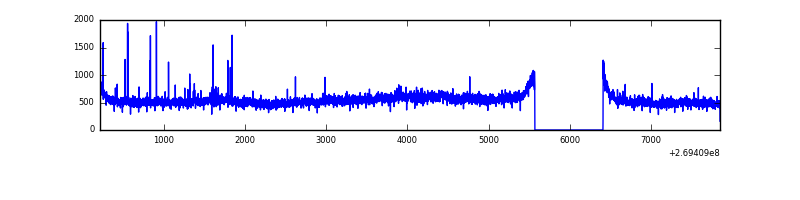 |
| D | 7635 | 6795 | 274 | 274 | 3.59% | 4.03% | 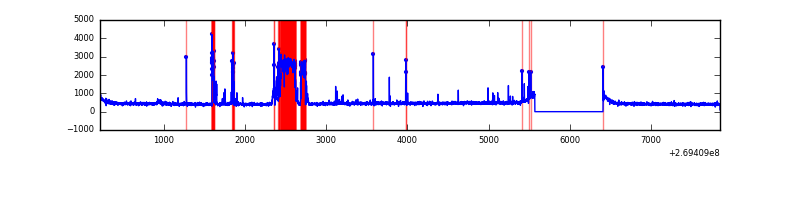 |
Top three noisy pixels from each quadrant. If the there are fewer than three noisy pixels in the level2.evt file, extra rows are filled as -1
| Pixel properties | Quadrant properties | ||||||
|---|---|---|---|---|---|---|---|
| Quadrant | DetID | PixID | Counts | Sigma | Mean | Median | Sigma |
| A | 12 | 189 | 53134 | 315.18 | 817 | 798 | 166.1 |
| A | 11 | 29 | 8474 | 46.22 | 817 | 798 | 166.1 |
| A | 0 | 226 | 7053 | 37.67 | 817 | 798 | 166.1 |
| B | 3 | 64 | 93806 | 597.76 | 820 | 799 | 155.6 |
| B | 4 | 173 | 19991 | 123.35 | 820 | 799 | 155.6 |
| B | 12 | 111 | 18336 | 112.71 | 820 | 799 | 155.6 |
| C | 3 | 233 | 564838 | 3081.8 | 793 | 796 | 183.0 |
| C | 0 | 207 | 23110 | 121.92 | 793 | 796 | 183.0 |
| C | 3 | 9 | 6174 | 29.38 | 793 | 796 | 183.0 |
| D | 2 | 33 | 775320 | 4128.48 | 770 | 747 | 187.6 |
| D | 10 | 70 | 48711 | 255.65 | 770 | 747 | 187.6 |
| D | 2 | 234 | 22675 | 116.88 | 770 | 747 | 187.6 |
Histogram calculated using DETX and DETY for each event in the final _common_clean file
| Quadrant A | 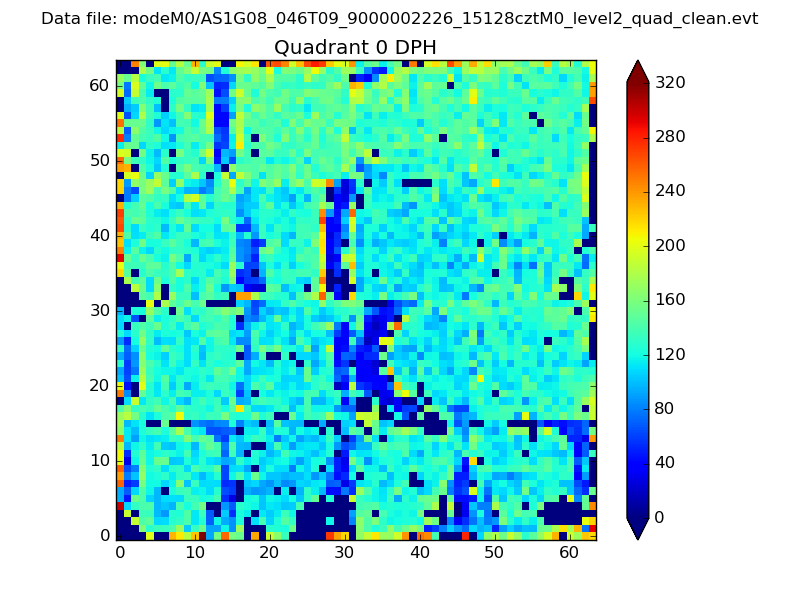 |
 |
Quadrant B |
|---|---|---|---|
| Quadrant D | 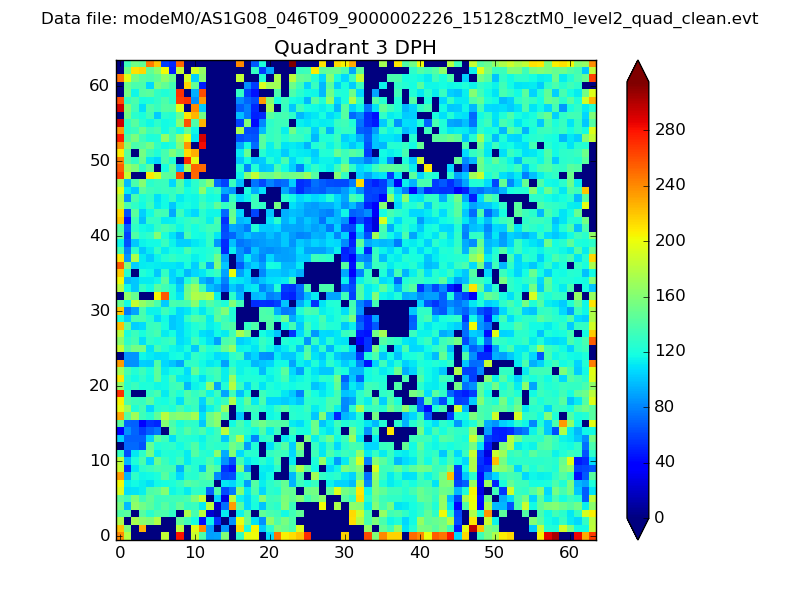 |
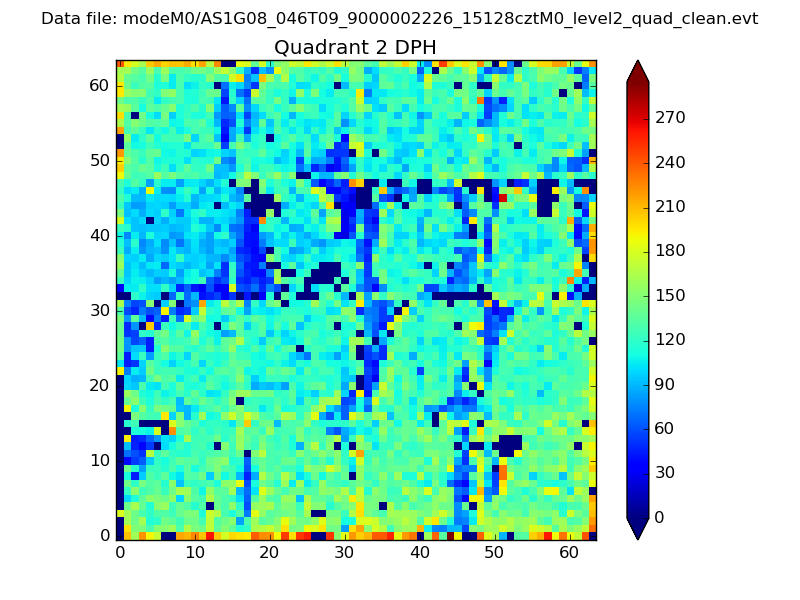 |
Quadrant C |
| Plot type | Count rate plots | Images |
|---|---|---|
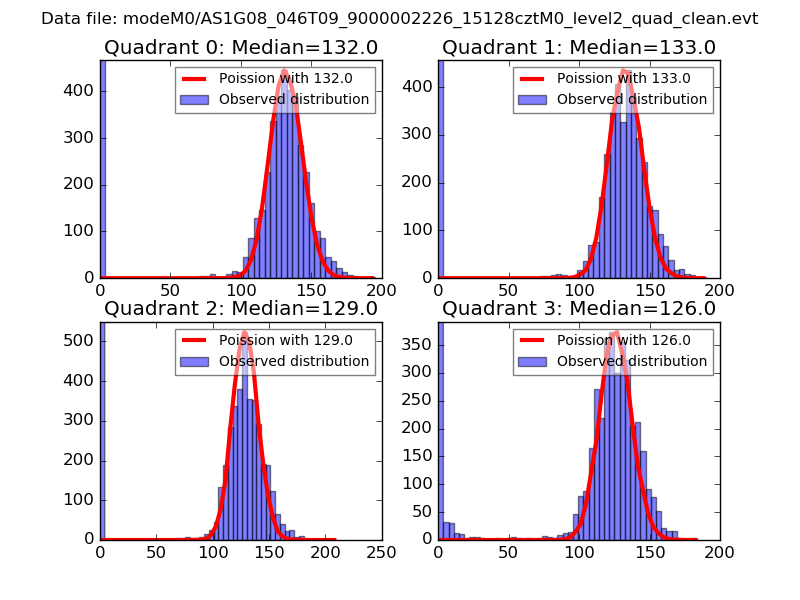
| Comparison with Poisson distribution Blue bars denote a histogram of data divided into 1 sec bins. Red curve is a Poisson curve with rate = median count rate of data. |
 |
 |
| Quadrant-wise count rates Data is divided into 100 sec bins |
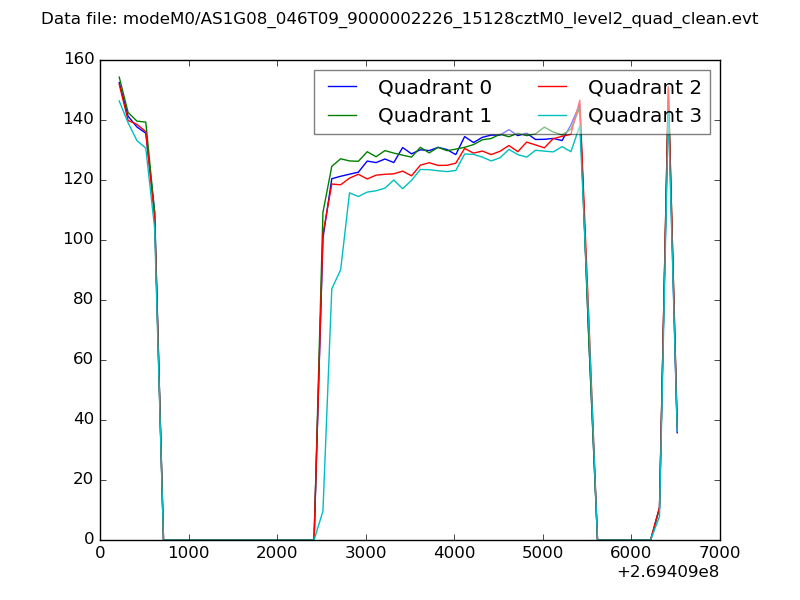 |
|
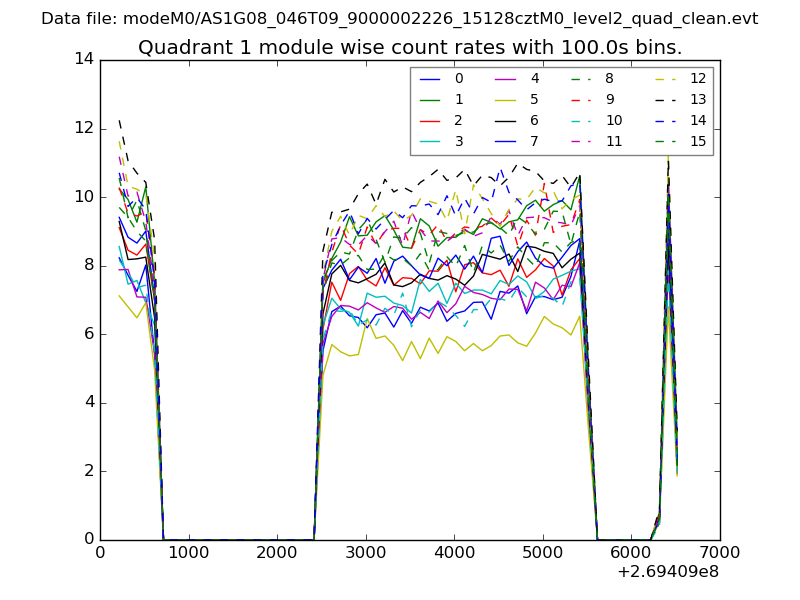
| Module-wise count rates for Quadrant A Data is divided into 100 sec bins |
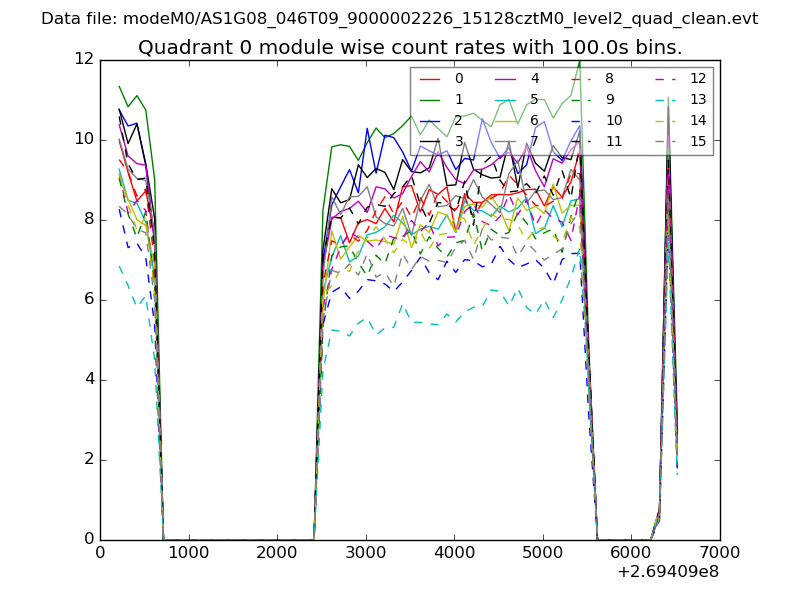 |
 |
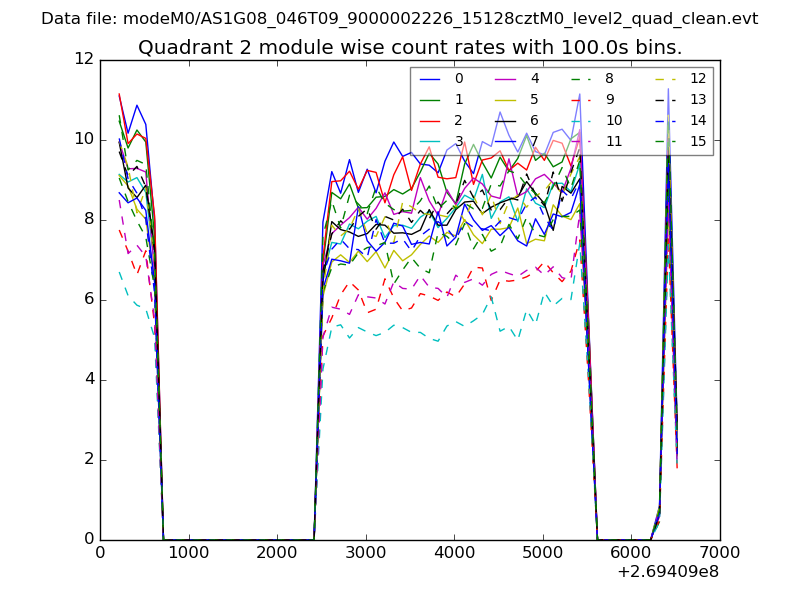
| Module-wise count rates for Quadrant B Data is divided into 100 sec bins |
 |
 |
| Module-wise count rates for Quadrant C Data is divided into 100 sec bins |
 |
 |
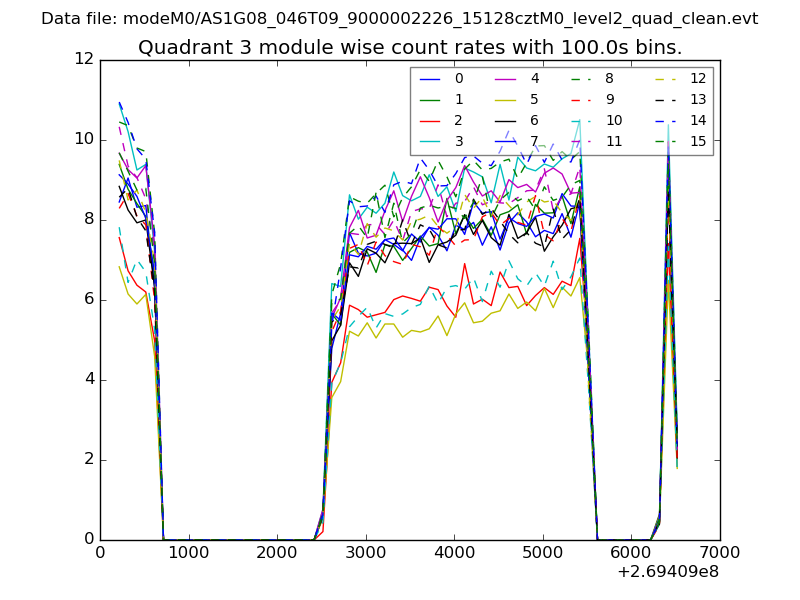
| Module-wise count rates for Quadrant D Data is divided into 100 sec bins |
 |
 |
| Parameter | Plot |
|---|---|
| CZT HV Monitor | 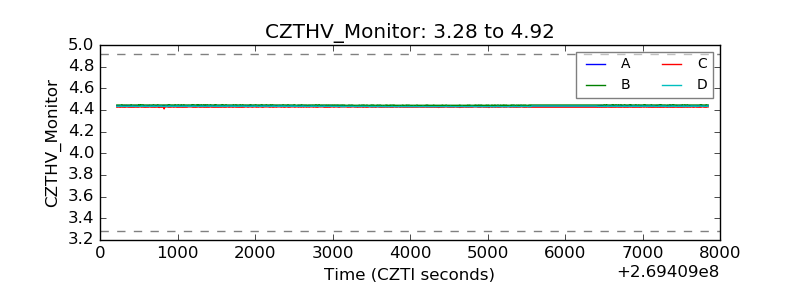 |
| D_VDD | 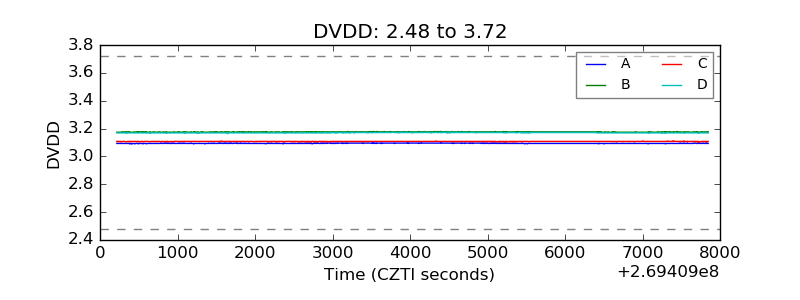 |
| Temperature 1 | 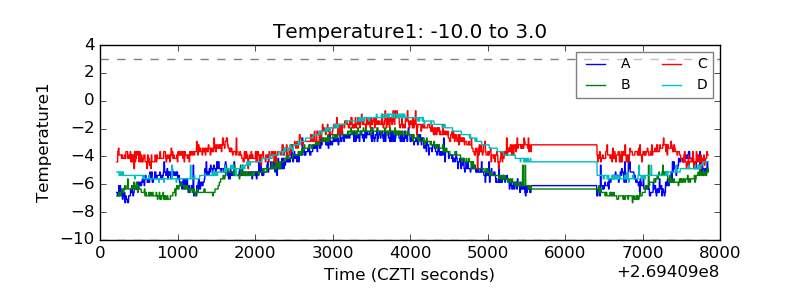 |
| Veto HV Monitor |  |
| Veto LLD | 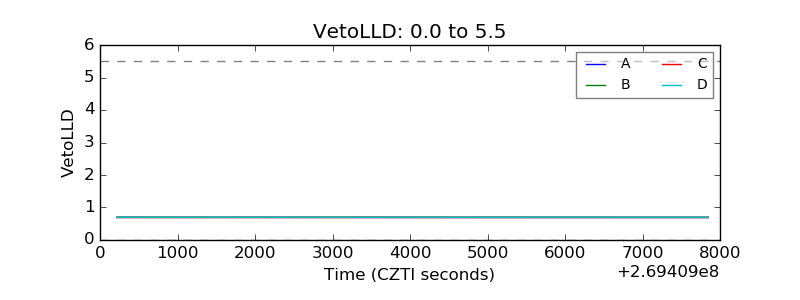 |
| Alpha Counter | 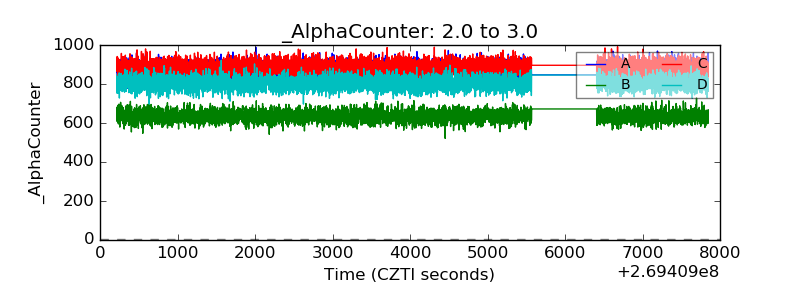 |
| _CPM_Rate | 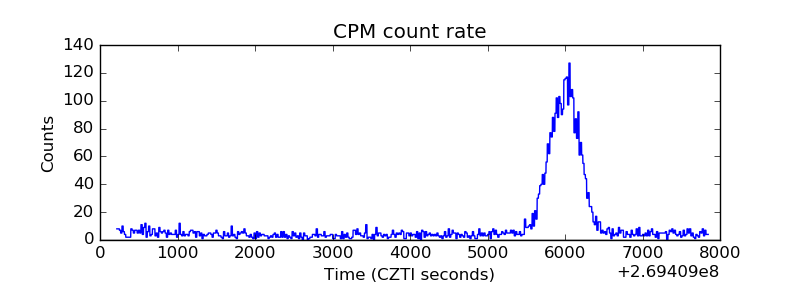 |
| CZT Counter | 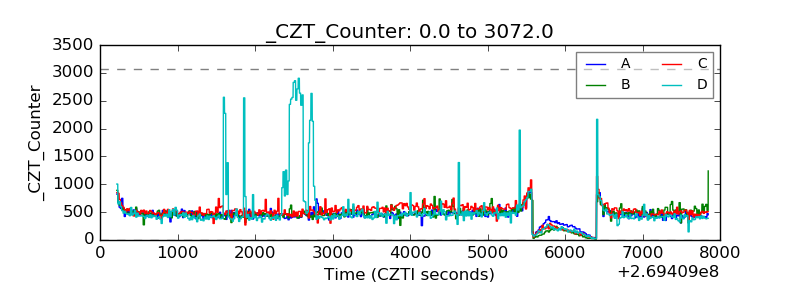 |
| +2.5 Volts monitor |  |
| +5 Volts monitor |  |
| _ROLL_ROT | 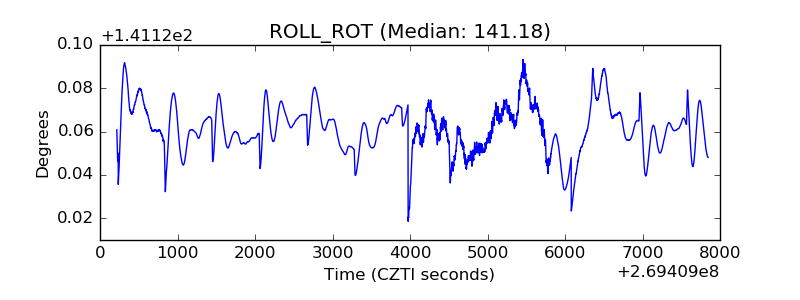 |
| _Roll_DEC | 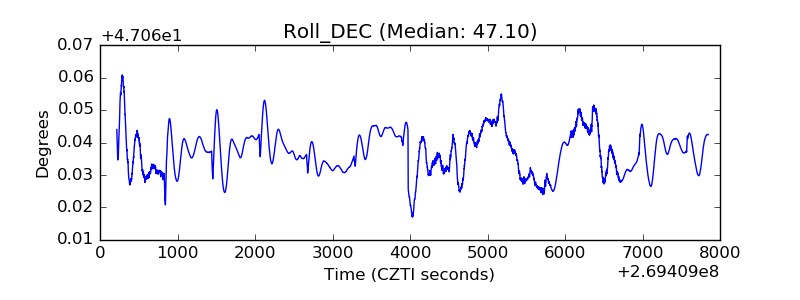 |
| _Roll_RA | 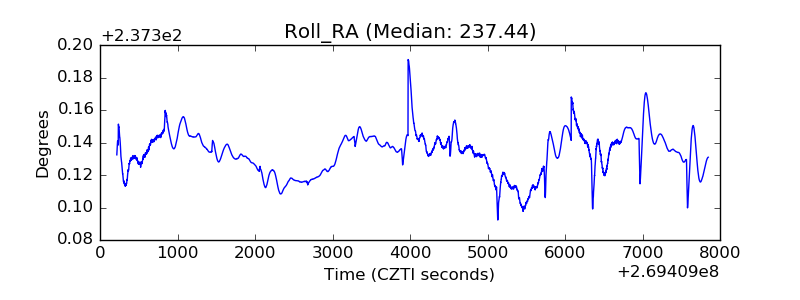 |
| Veto Counter | 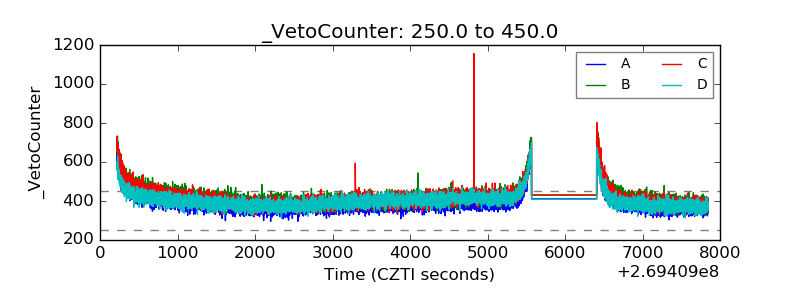 |