| Param | Original file | Final file |
|---|---|---|
| Filename | modeM0/AS1G08_046T09_9000002226_15129cztM0_level2.evt | modeM0/AS1G08_046T09_9000002226_15129cztM0_level2_quad_clean.evt |
| Size (bytes) | 597,813,120 | 98,173,440 |
| Size | 570.1 MB | 93.6 MB |
| Events in quadrant A | 3,888,869 | 610,934 |
| Events in quadrant B | 4,184,615 | 614,462 |
| Events in quadrant C | 5,695,192 | 593,427 |
| Events in quadrant D | 3,782,438 | 586,500 |
| Mode M0 | |||
|---|---|---|---|
| Quadrant | BADHDUFLAG | Total packets | Discarded packets |
| A | 0 | 16963 | 4 |
| B | 0 | 17498 | 3 |
| C | 0 | 22533 | 3 |
| D | 0 | 17068 | 3 |
| Mode M9 | |||
|---|---|---|---|
| Quadrant | BADHDUFLAG | Total packets | Discarded packets |
| A | 0 | 12 | 0 |
| B | 0 | 12 | 0 |
| C | 0 | 12 | 0 |
| D | 0 | 12 | 0 |
| Mode SS | |||
|---|---|---|---|
| Quadrant | BADHDUFLAG | Total packets | Discarded packets |
| A | 0 | 168 | 0 |
| B | 0 | 168 | 0 |
| C | 0 | 168 | 0 |
| D | 0 | 168 | 0 |
| Quadrant | Total seconds | Saturated seconds | Saturation percentage |
|---|---|---|---|
| A | 8161 | 225 | 2.757015% |
| B | 8161 | 277 | 3.394192% |
| C | 8161 | 323 | 3.957848% |
| D | 8161 | 165 | 2.021811% |
Noise dominated data is calculated using 1-second bins in cleaned event files. If a bin has >2000 counts, and if more than 50% of those come from <1% of pixels, then it is considered to be noise-dominated and hence unusable.
| Quadrant | # 1 sec bins | Bins with >0 counts | Bins with >2000 counts | High rate bins dominated by noise | Noise dominated (total time) | Noise dominated (detector-on time) | Marked lightcurve |
|---|---|---|---|---|---|---|---|
| A | 9355 | 8157 | 0 | 0 | 0.00% | 0.00% | 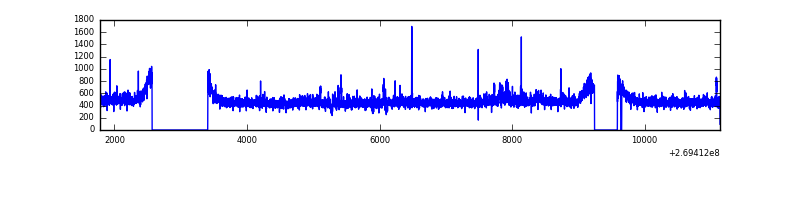 |
| B | 9355 | 8156 | 5 | 5 | 0.05% | 0.06% | 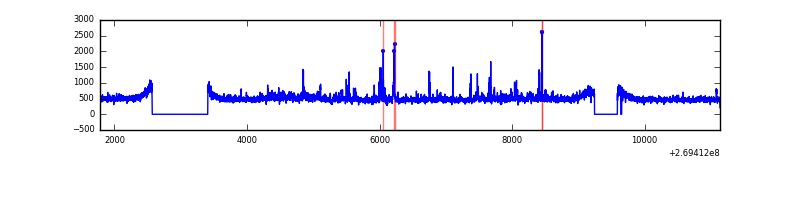 |
| C | 9355 | 8156 | 117 | 117 | 1.25% | 1.43% | 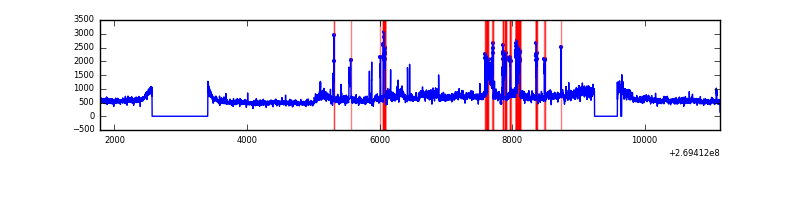 |
| D | 9355 | 8156 | 5 | 5 | 0.05% | 0.06% | 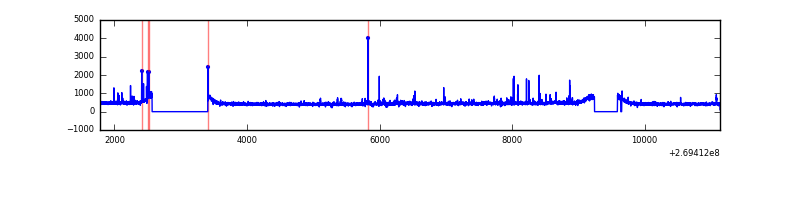 |
Top three noisy pixels from each quadrant. If the there are fewer than three noisy pixels in the level2.evt file, extra rows are filled as -1
| Pixel properties | Quadrant properties | ||||||
|---|---|---|---|---|---|---|---|
| Quadrant | DetID | PixID | Counts | Sigma | Mean | Median | Sigma |
| A | 12 | 189 | 78892 | 388.05 | 987 | 962 | 200.8 |
| A | 9 | 143 | 11615 | 53.05 | 987 | 962 | 200.8 |
| A | 0 | 226 | 8782 | 38.94 | 987 | 962 | 200.8 |
| B | 3 | 64 | 175682 | 922.66 | 990 | 963 | 189.4 |
| B | 4 | 48 | 30741 | 157.25 | 990 | 963 | 189.4 |
| B | 3 | 209 | 28951 | 147.8 | 990 | 963 | 189.4 |
| C | 3 | 233 | 1838047 | 8195.3 | 961 | 962 | 224.2 |
| C | 3 | 9 | 102266 | 451.92 | 961 | 962 | 224.2 |
| C | 7 | 247 | 7889 | 30.9 | 961 | 962 | 224.2 |
| D | 2 | 120 | 33104 | 137.36 | 962 | 929 | 234.2 |
| D | 2 | 234 | 29301 | 121.12 | 962 | 929 | 234.2 |
| D | 8 | 195 | 28488 | 117.65 | 962 | 929 | 234.2 |
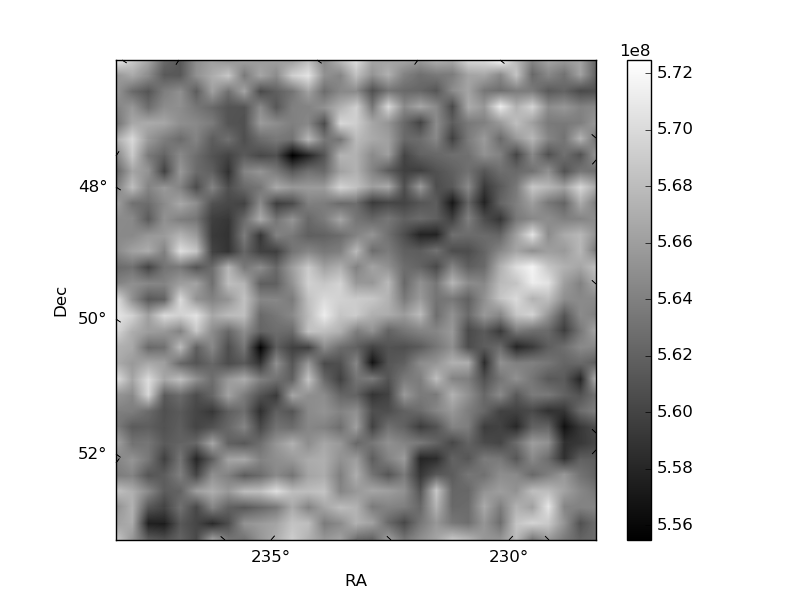
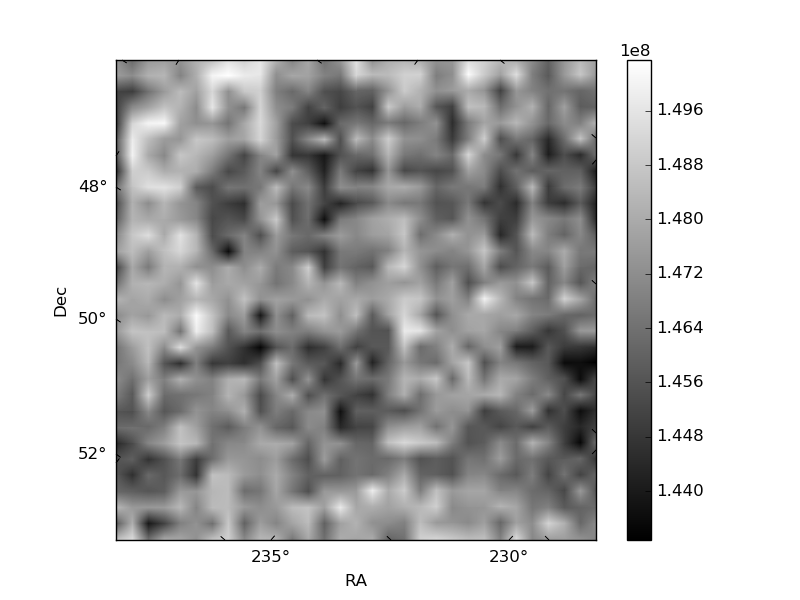
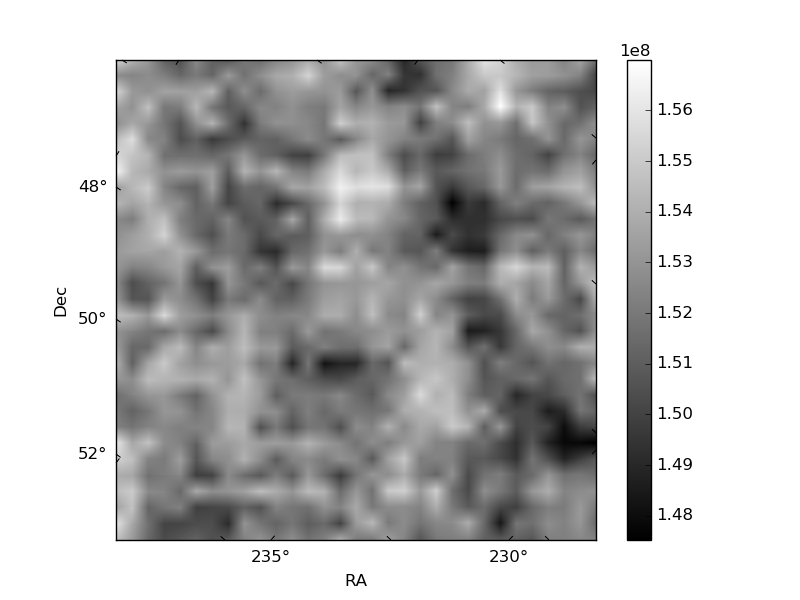
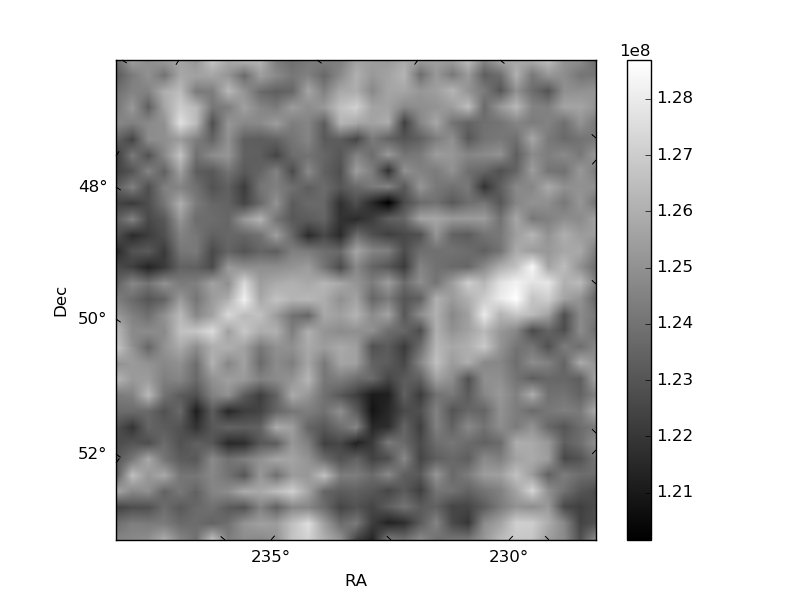
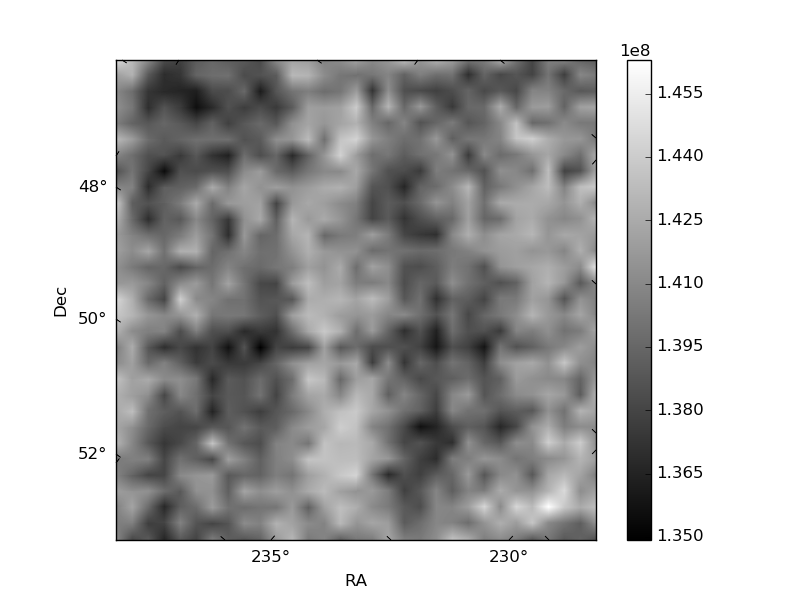
Histogram calculated using DETX and DETY for each event in the final _common_clean file
| Quadrant A | 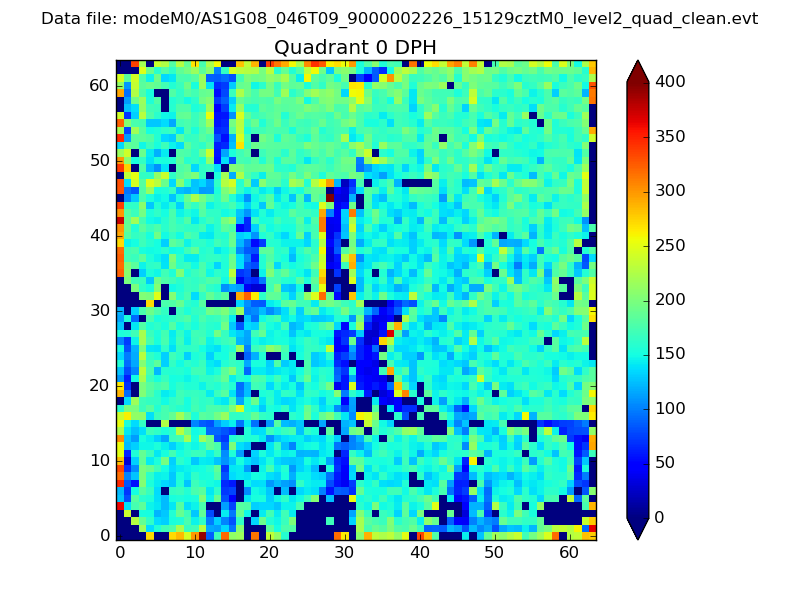 |
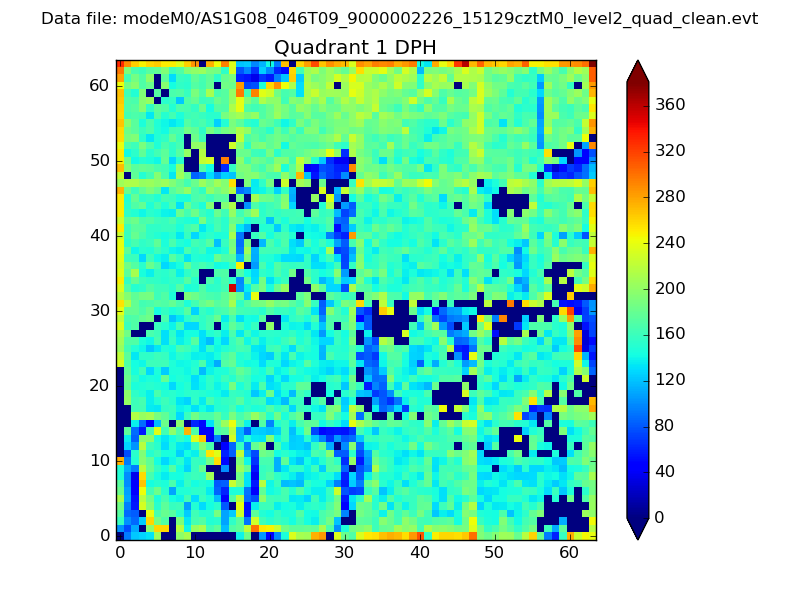 |
Quadrant B |
|---|---|---|---|
| Quadrant D | 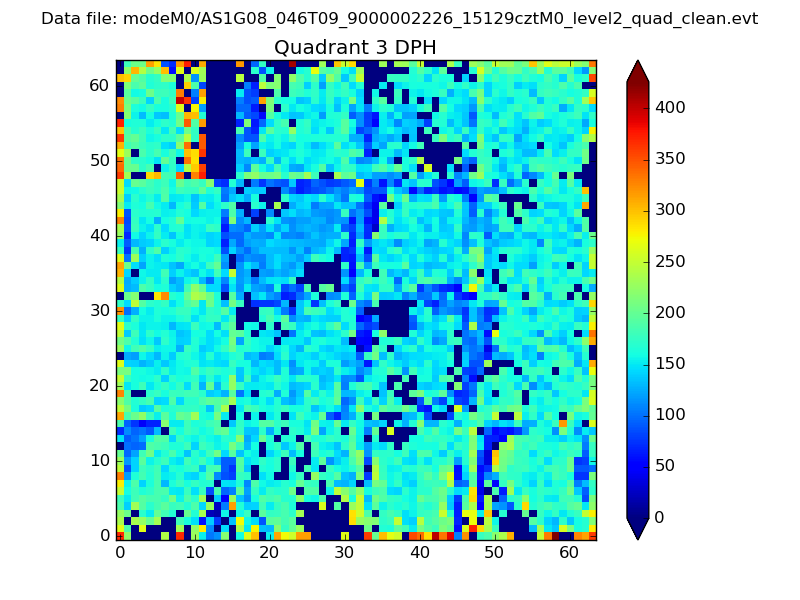 |
 |
Quadrant C |
| Plot type | Count rate plots | Images |
|---|---|---|
| Comparison with Poisson distribution Blue bars denote a histogram of data divided into 1 sec bins. Red curve is a Poisson curve with rate = median count rate of data. |
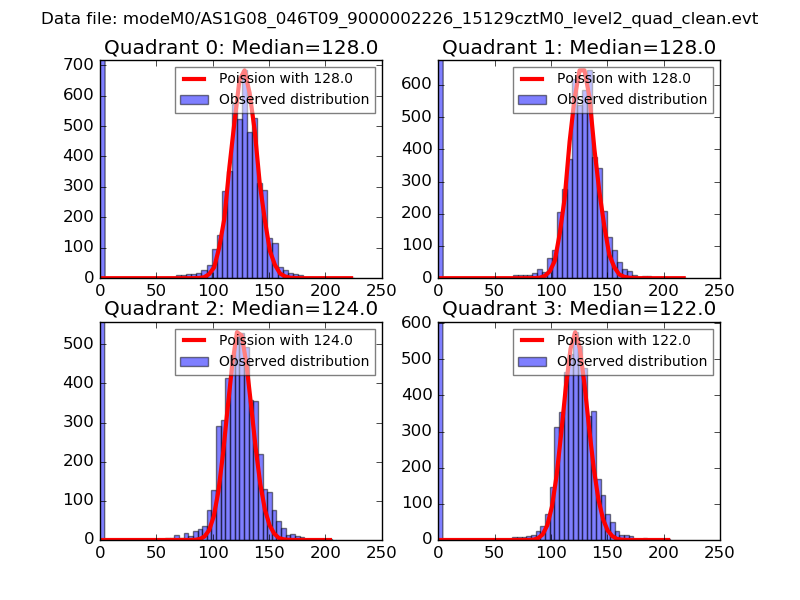 |
 |
| Quadrant-wise count rates Data is divided into 100 sec bins |
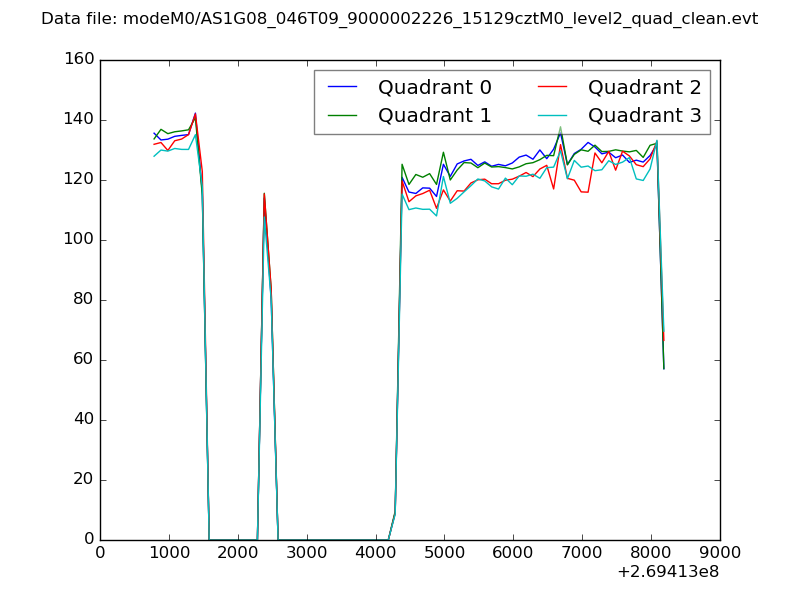 |
|
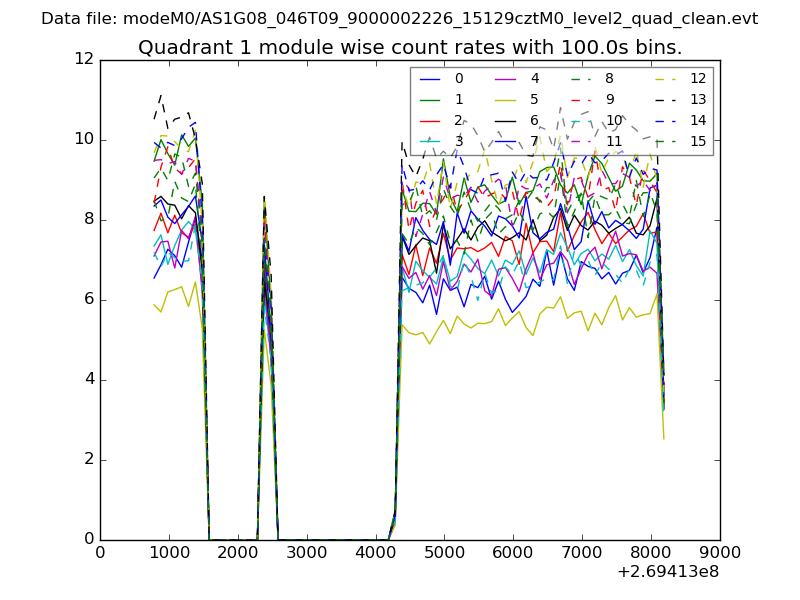
| Module-wise count rates for Quadrant A Data is divided into 100 sec bins |
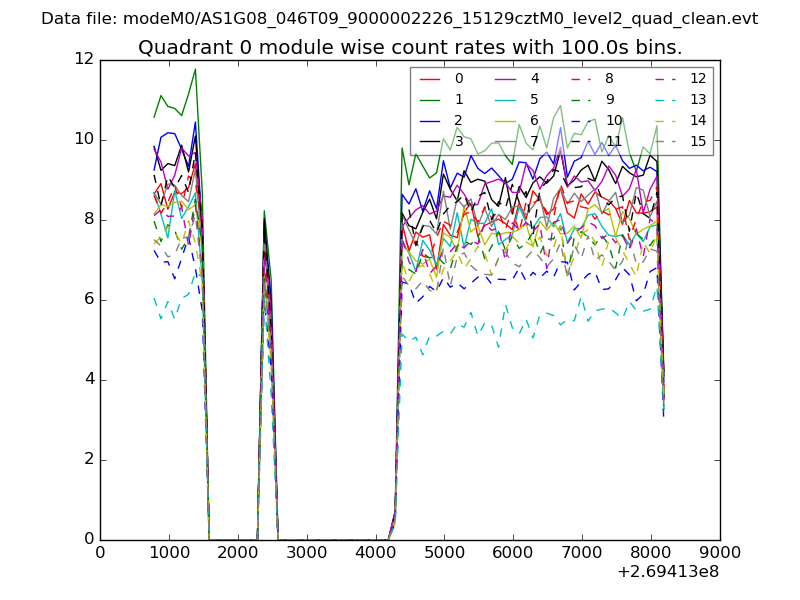 |
 |
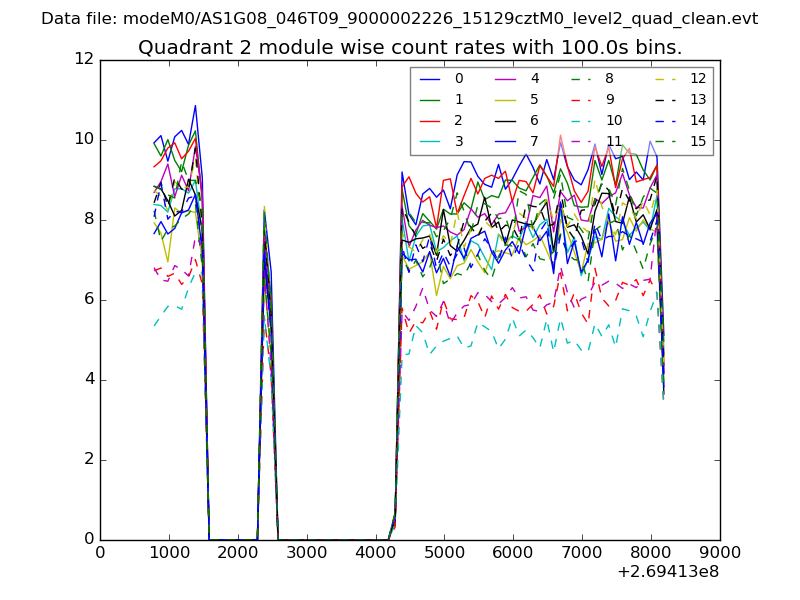
| Module-wise count rates for Quadrant B Data is divided into 100 sec bins |
 |
 |
| Module-wise count rates for Quadrant C Data is divided into 100 sec bins |
 |
 |
| Module-wise count rates for Quadrant D Data is divided into 100 sec bins |
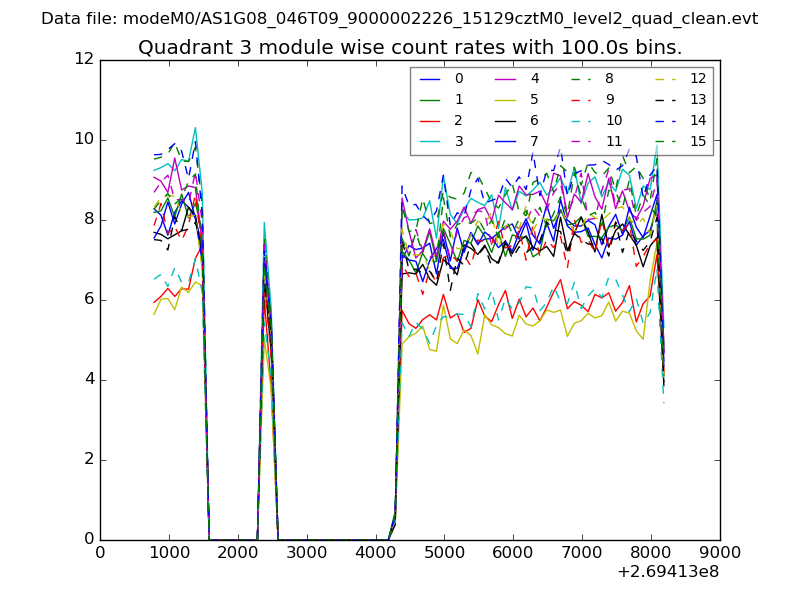 |
 |
| Parameter | Plot |
|---|---|
| CZT HV Monitor | 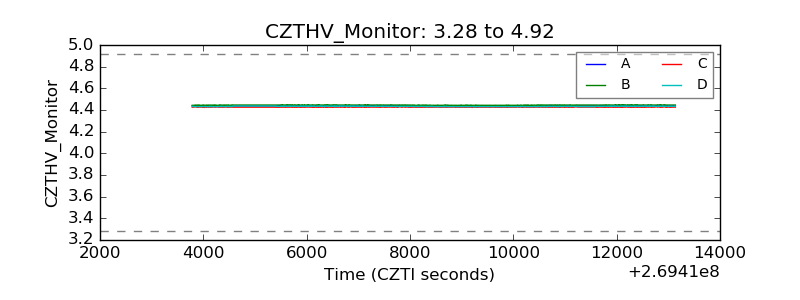 |
| D_VDD | 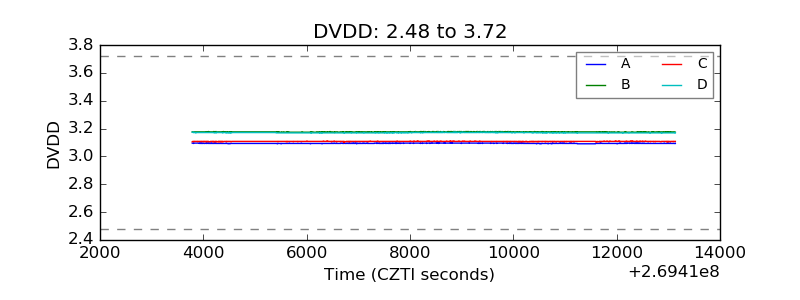 |
| Temperature 1 | 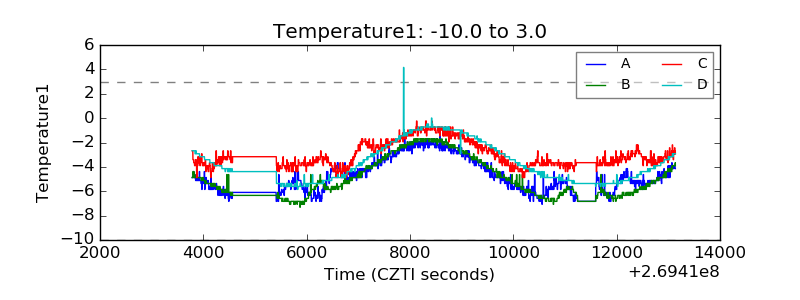 |
| Veto HV Monitor | 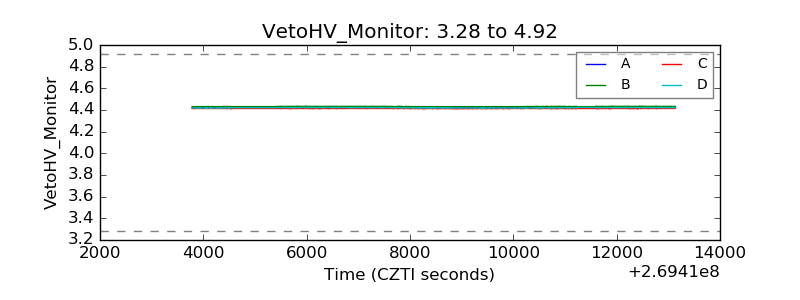 |
| Veto LLD | 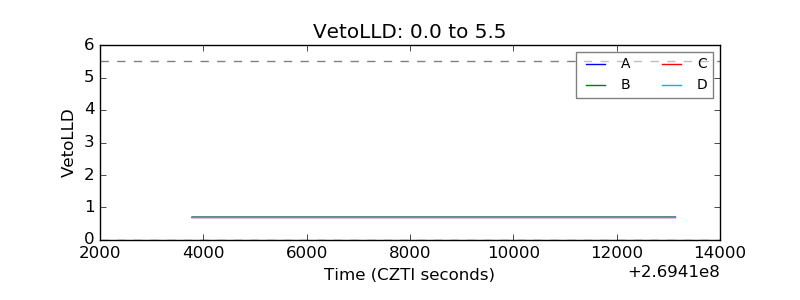 |
| Alpha Counter | 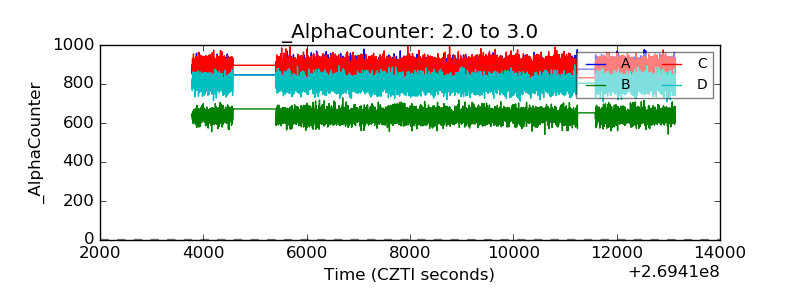 |
| _CPM_Rate | 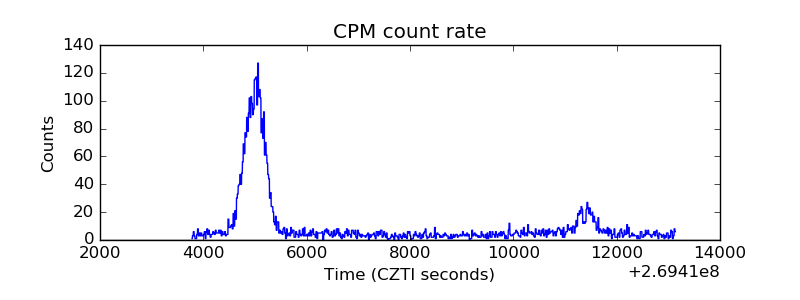 |
| CZT Counter | 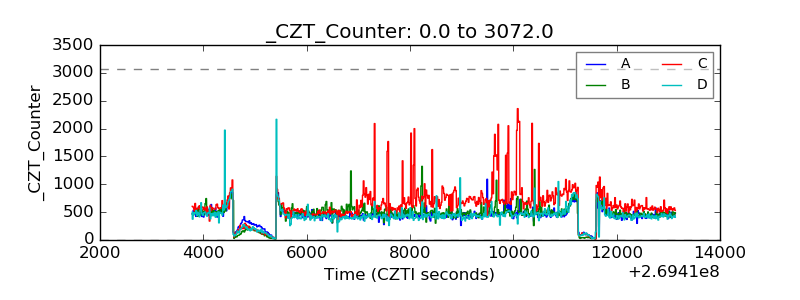 |
| +2.5 Volts monitor |  |
| +5 Volts monitor |  |
| _ROLL_ROT | 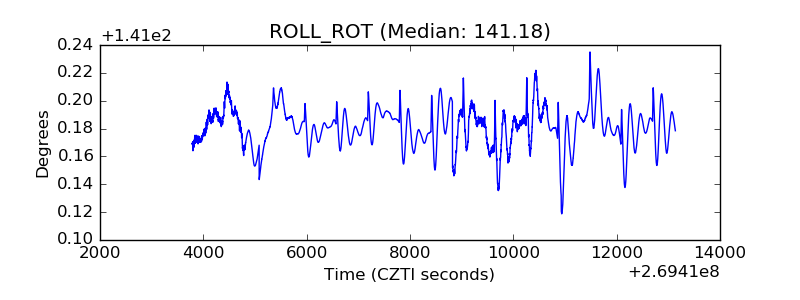 |
| _Roll_DEC |  |
| _Roll_RA | 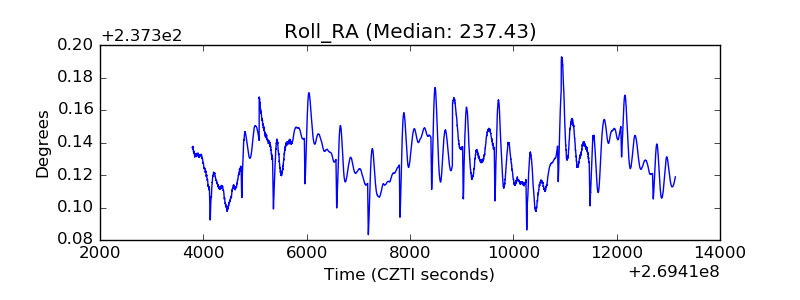 |
| Veto Counter |  |