| Param | Original file | Final file |
|---|---|---|
| Filename | modeM0/AS1A04_218T03_9000002232cztM0_level2.fits | modeM0/AS1A04_218T03_9000002232cztM0_level2_quad_clean.evt |
| Size (bytes) | 652,775,040 | 542,975,040 |
| Size | 622.5 MB | 517.8 MB |
| Events in quadrant A | 3,976,570 | 3,079,786 |
| Events in quadrant B | 3,820,710 | 3,094,986 |
| Events in quadrant C | 3,965,458 | 2,946,123 |
| Events in quadrant D | 3,387,938 | 2,704,001 |
| Mode M0 | |||
|---|---|---|---|
| Quadrant | BADHDUFLAG | Total packets | Discarded packets |
| A | 0 | 147027 | 0 |
| B | 0 | 149403 | 0 |
| C | 0 | 143456 | 0 |
| D | 0 | 154893 | 0 |
| Mode SS | |||
|---|---|---|---|
| Quadrant | BADHDUFLAG | Total packets | Discarded packets |
| A | 0 | 1372 | 0 |
| B | 0 | 1372 | 0 |
| C | 0 | 1372 | 0 |
| D | 0 | 1372 | 0 |
| Mode M9 | |||
|---|---|---|---|
| Quadrant | BADHDUFLAG | Total packets | Discarded packets |
| A | 0 | 102 | 0 |
| B | 0 | 102 | 0 |
| C | 0 | 102 | 0 |
| D | 0 | 102 | 0 |
| Quadrant | Total seconds | Saturated seconds | Saturation percentage |
|---|---|---|---|
| A | 67323 | 1064 | 1.580441% |
| B | 67323 | 2071 | 3.076215% |
| C | 67323 | 758 | 1.125915% |
| D | 67323 | 2401 | 3.566389% |
Noise dominated data is calculated using 1-second bins in cleaned event files. If a bin has >2000 counts, and if more than 50% of those come from <1% of pixels, then it is considered to be noise-dominated and hence unusable.
| Quadrant | # 1 sec bins | Bins with >0 counts | Bins with >2000 counts | High rate bins dominated by noise | Noise dominated (total time) | Noise dominated (detector-on time) | Marked lightcurve |
|---|---|---|---|---|---|---|---|
| A | 77708 | 67325 | 0 | 0 | 0.00% | 0.00% | 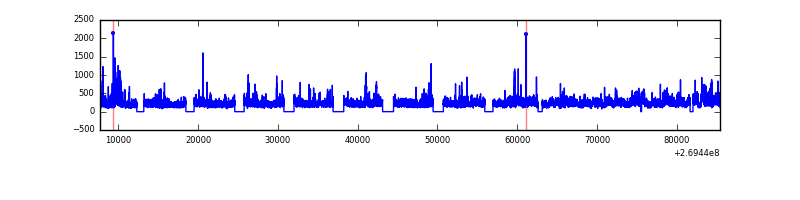 |
| B | 77708 | 67218 | 0 | 0 | 0.00% | 0.00% |  |
| C | 77708 | 67328 | 0 | 0 | 0.00% | 0.00% |  |
| D | 77708 | 67259 | 0 | 0 | 0.00% | 0.00% |  |
Top three noisy pixels from each quadrant. If the there are fewer than three noisy pixels in the level2.evt file, extra rows are filled as -1
| Pixel properties | Quadrant properties | ||||||
|---|---|---|---|---|---|---|---|
| Quadrant | DetID | PixID | Counts | Sigma | Mean | Median | Sigma |
| A | 0 | 29 | 3862 | 11.29 | 1033 | 965 | 256.6 |
| A | 7 | 110 | 3218 | 8.78 | 1033 | 965 | 256.6 |
| A | 15 | 236 | 3058 | 8.16 | 1033 | 965 | 256.6 |
| B | 2 | 9 | 3338 | 11.88 | 1009 | 960 | 200.2 |
| B | 3 | 17 | 2550 | 7.94 | 1009 | 960 | 200.2 |
| B | 14 | 254 | 2537 | 7.88 | 1009 | 960 | 200.2 |
| C | 1 | 80 | 2889 | 7.1 | 1046 | 974 | 269.8 |
| C | 1 | 81 | 2830 | 6.88 | 1046 | 974 | 269.8 |
| C | 12 | 241 | 2805 | 6.79 | 1046 | 974 | 269.8 |
| D | 3 | 14 | 2475 | 6.17 | 967 | 877 | 259.0 |
| D | 6 | 231 | 2442 | 6.04 | 967 | 877 | 259.0 |
| D | 7 | 3 | 2377 | 5.79 | 967 | 877 | 259.0 |
Histogram calculated using DETX and DETY for each event in the final _common_clean file
| Quadrant A |  |
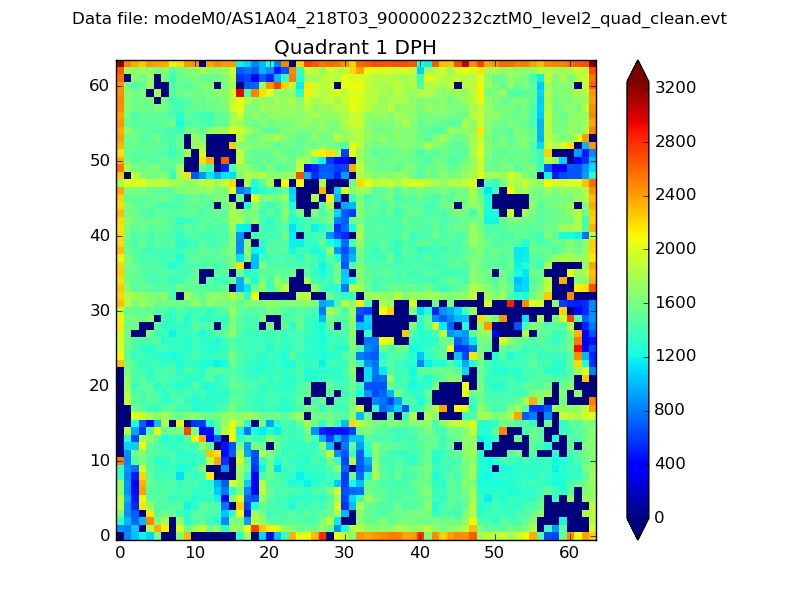 |
Quadrant B |
|---|---|---|---|
| Quadrant D |  |
 |
Quadrant C |
| Plot type | Count rate plots | Images |
|---|---|---|
| Comparison with Poisson distribution Blue bars denote a histogram of data divided into 1 sec bins. Red curve is a Poisson curve with rate = median count rate of data. |
 |
 |
| Quadrant-wise count rates Data is divided into 100 sec bins |
 |
|
| Module-wise count rates for Quadrant A Data is divided into 100 sec bins |
 |
 |
| Module-wise count rates for Quadrant B Data is divided into 100 sec bins |
 |
 |
| Module-wise count rates for Quadrant C Data is divided into 100 sec bins |
 |
 |
| Module-wise count rates for Quadrant D Data is divided into 100 sec bins |
 |
 |
| Parameter | Plot |
|---|---|
| CZT HV Monitor |  |
| D_VDD | 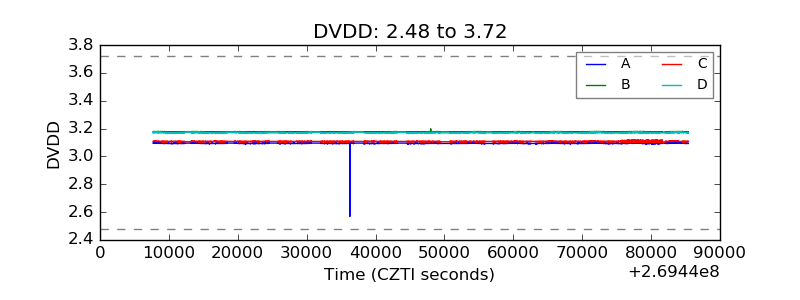 |
| Temperature 1 |  |
| Veto HV Monitor |  |
| Veto LLD |  |
| Alpha Counter |  |
| _CPM_Rate | 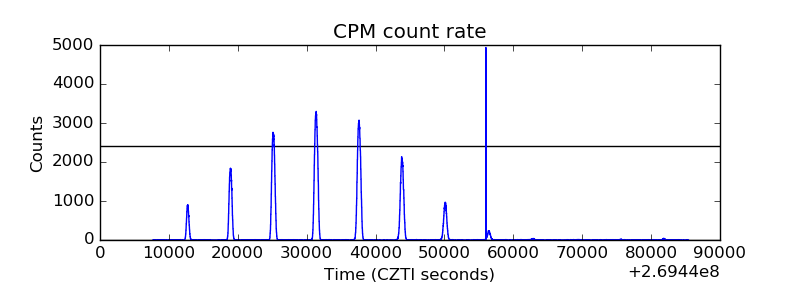 |
| CZT Counter |  |
| +2.5 Volts monitor | 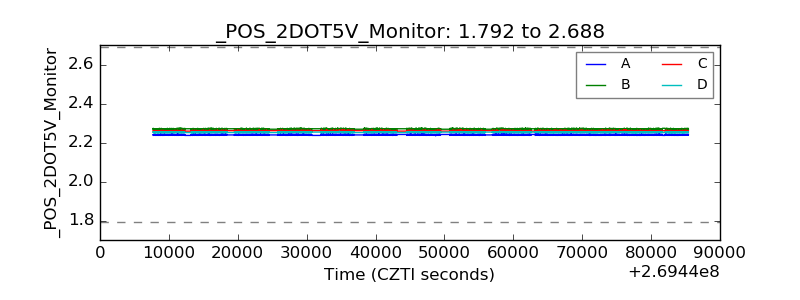 |
| +5 Volts monitor |  |
| _ROLL_ROT |  |
| _Roll_DEC |  |
| _Roll_RA |  |
| Veto Counter |  |