| Param | Original file | Final file |
|---|---|---|
| Filename | modeM0/AS1A04_218T03_9000002232_15134cztM0_level2.evt | modeM0/AS1A04_218T03_9000002232_15134cztM0_level2_quad_clean.evt |
| Size (bytes) | 414,146,880 | 73,702,080 |
| Size | 395.0 MB | 70.3 MB |
| Events in quadrant A | 3,069,530 | 460,442 |
| Events in quadrant B | 3,089,100 | 462,607 |
| Events in quadrant C | 3,155,552 | 454,124 |
| Events in quadrant D | 2,825,636 | 440,900 |
| Mode M0 | |||
|---|---|---|---|
| Quadrant | BADHDUFLAG | Total packets | Discarded packets |
| A | 0 | 12923 | 2 |
| B | 0 | 12978 | 1 |
| C | 0 | 12821 | 1 |
| D | 0 | 12555 | 1 |
| Mode SS | |||
|---|---|---|---|
| Quadrant | BADHDUFLAG | Total packets | Discarded packets |
| A | 0 | 122 | 0 |
| B | 0 | 122 | 0 |
| C | 0 | 122 | 0 |
| D | 0 | 122 | 0 |
| Mode M9 | |||
|---|---|---|---|
| Quadrant | BADHDUFLAG | Total packets | Discarded packets |
| A | 0 | 8 | 0 |
| B | 0 | 8 | 0 |
| C | 0 | 8 | 0 |
| D | 0 | 8 | 0 |
| Quadrant | Total seconds | Saturated seconds | Saturation percentage |
|---|---|---|---|
| A | 5916 | 33 | 0.557809% |
| B | 5916 | 86 | 1.453685% |
| C | 5916 | 28 | 0.473293% |
| D | 5916 | 59 | 0.997295% |
Noise dominated data is calculated using 1-second bins in cleaned event files. If a bin has >2000 counts, and if more than 50% of those come from <1% of pixels, then it is considered to be noise-dominated and hence unusable.
| Quadrant | # 1 sec bins | Bins with >0 counts | Bins with >2000 counts | High rate bins dominated by noise | Noise dominated (total time) | Noise dominated (detector-on time) | Marked lightcurve |
|---|---|---|---|---|---|---|---|
| A | 6792 | 5917 | 1 | 1 | 0.01% | 0.02% | 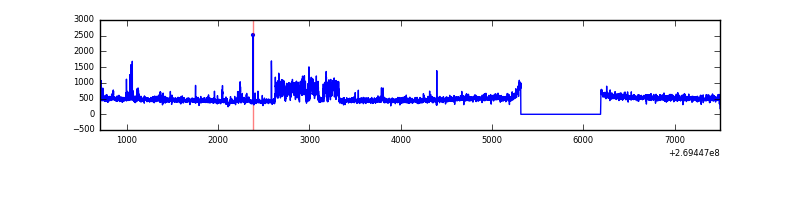 |
| B | 6792 | 5918 | 29 | 29 | 0.43% | 0.49% | 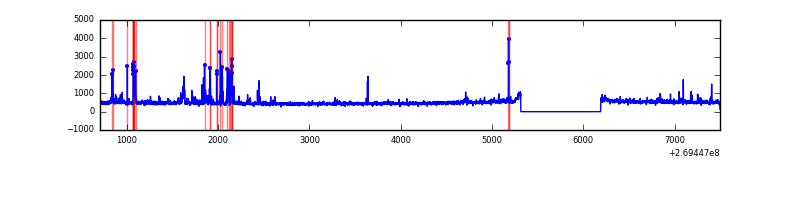 |
| C | 6792 | 5918 | 4 | 4 | 0.06% | 0.07% | 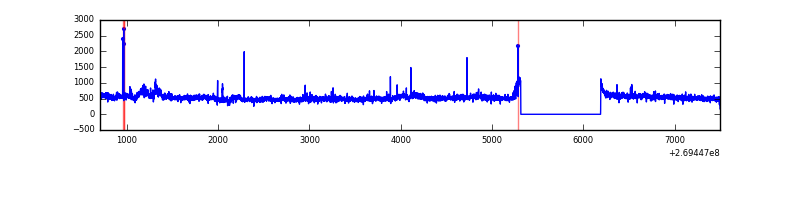 |
| D | 6792 | 5918 | 34 | 34 | 0.50% | 0.57% | 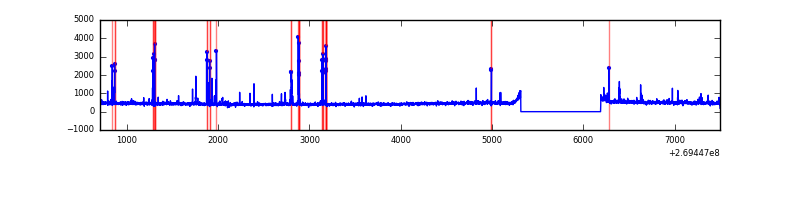 |
Top three noisy pixels from each quadrant. If the there are fewer than three noisy pixels in the level2.evt file, extra rows are filled as -1
| Pixel properties | Quadrant properties | ||||||
|---|---|---|---|---|---|---|---|
| Quadrant | DetID | PixID | Counts | Sigma | Mean | Median | Sigma |
| A | 11 | 29 | 256267 | 1758.64 | 706 | 690 | 145.3 |
| A | 12 | 189 | 42083 | 284.83 | 706 | 690 | 145.3 |
| A | 1 | 162 | 16824 | 111.02 | 706 | 690 | 145.3 |
| B | 3 | 64 | 203474 | 1498.87 | 706 | 688 | 135.3 |
| B | 0 | 190 | 40466 | 294.02 | 706 | 688 | 135.3 |
| B | 0 | 230 | 17629 | 125.22 | 706 | 688 | 135.3 |
| C | 3 | 233 | 450556 | 2823.14 | 686 | 689 | 159.3 |
| C | 0 | 207 | 19253 | 116.5 | 686 | 689 | 159.3 |
| C | 10 | 22 | 8226 | 47.3 | 686 | 689 | 159.3 |
| D | 7 | 38 | 46396 | 268.02 | 687 | 665 | 170.6 |
| D | 13 | 172 | 41211 | 237.63 | 687 | 665 | 170.6 |
| D | 10 | 70 | 40562 | 233.83 | 687 | 665 | 170.6 |
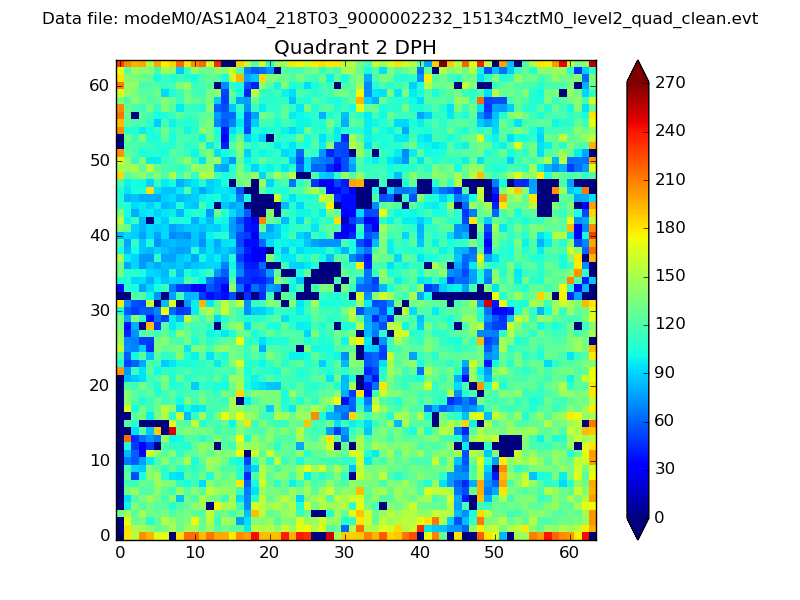
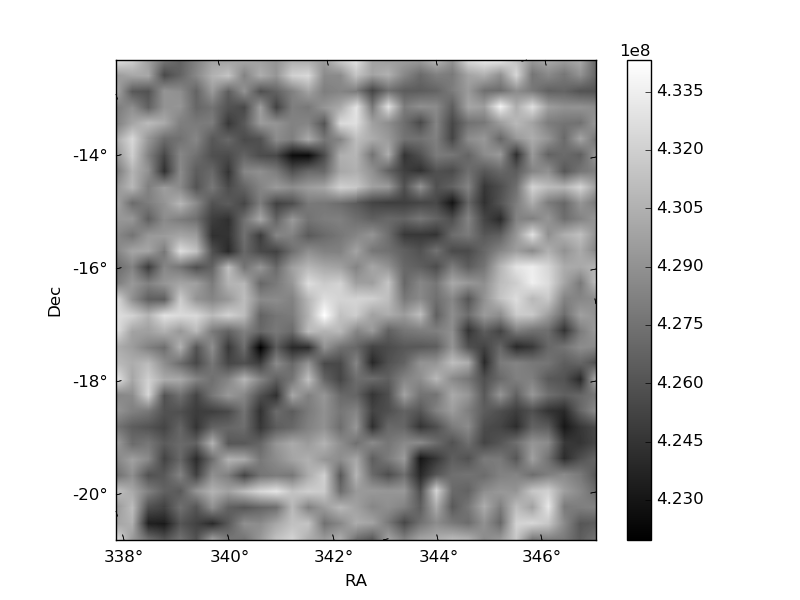
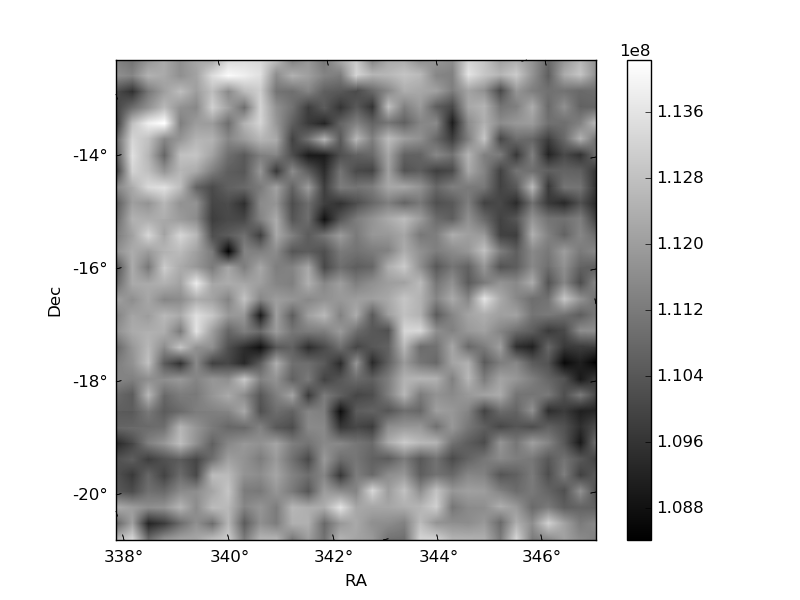
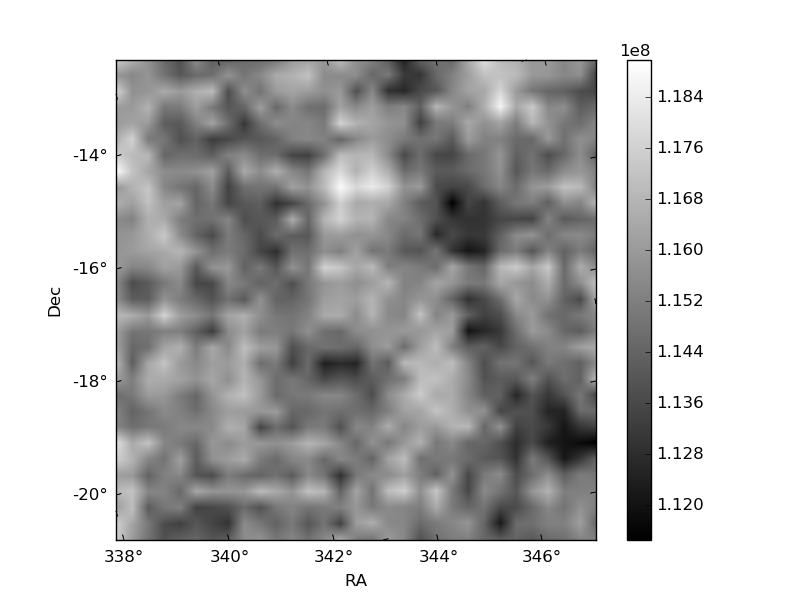
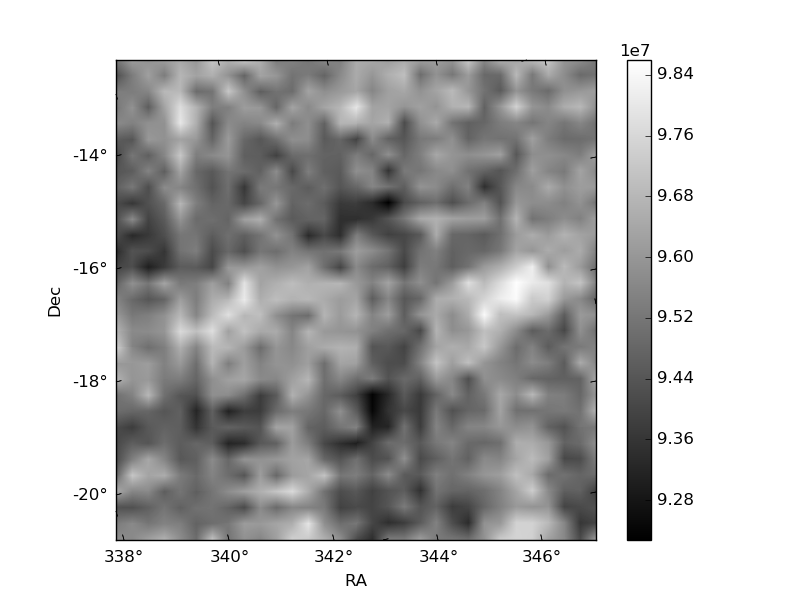
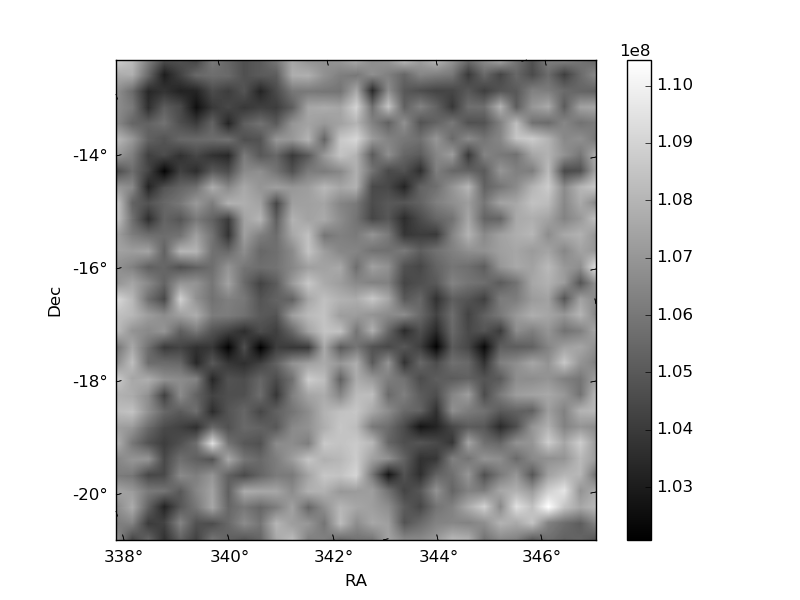
Histogram calculated using DETX and DETY for each event in the final _common_clean file
| Quadrant A | 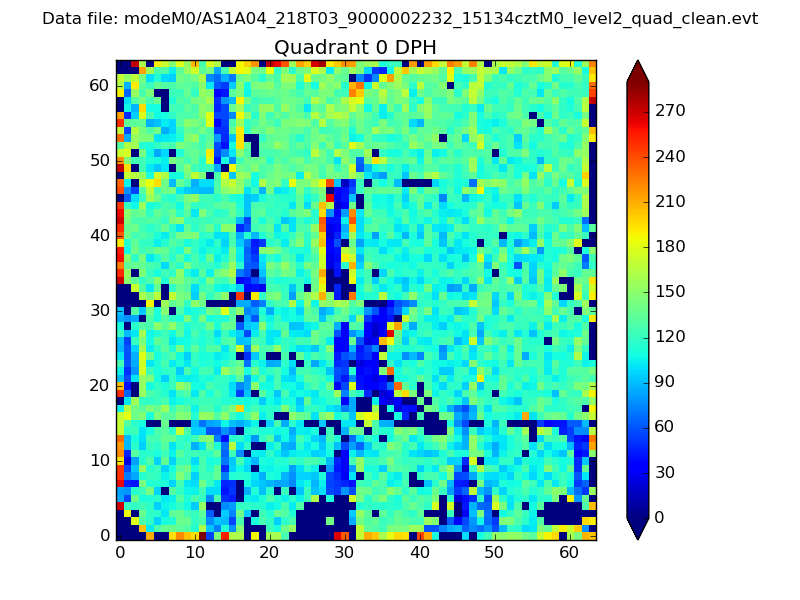 |
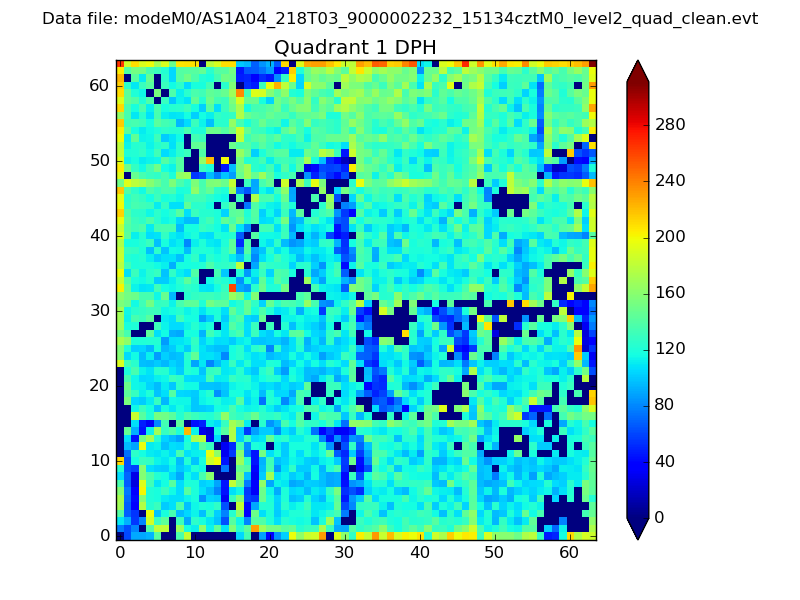 |
Quadrant B |
|---|---|---|---|
| Quadrant D | 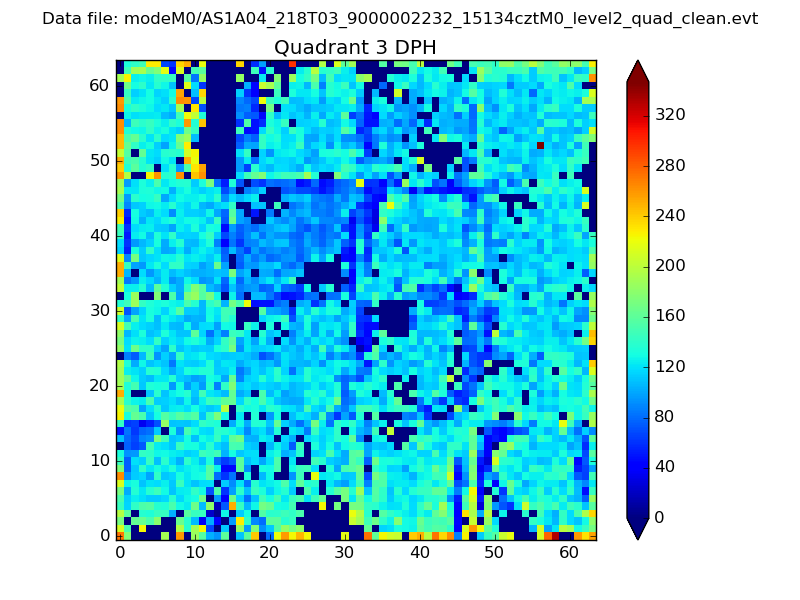 |
 |
Quadrant C |
| Plot type | Count rate plots | Images |
|---|---|---|
| Comparison with Poisson distribution Blue bars denote a histogram of data divided into 1 sec bins. Red curve is a Poisson curve with rate = median count rate of data. |
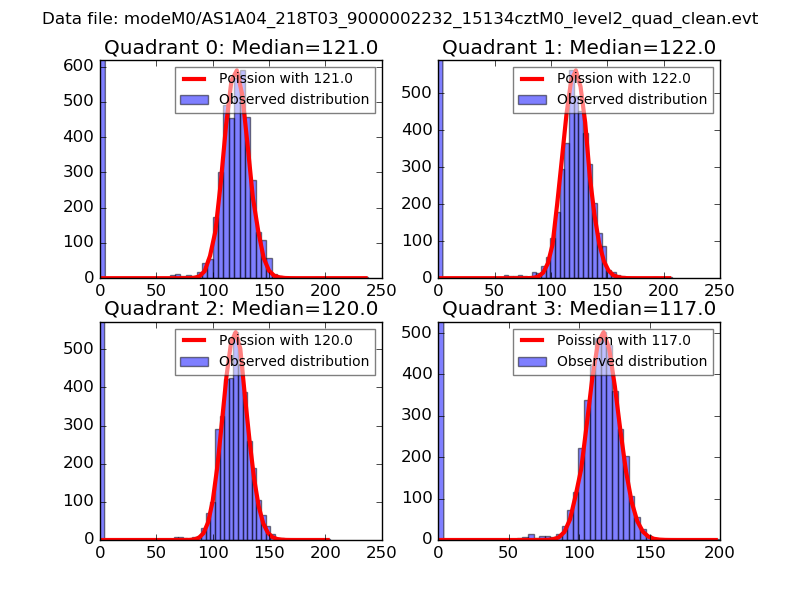 |
 |
| Quadrant-wise count rates Data is divided into 100 sec bins |
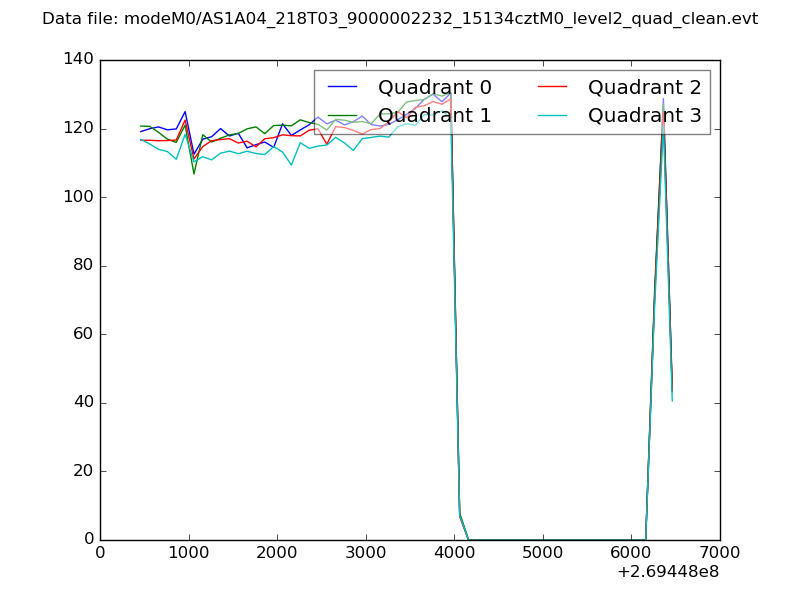 |
|
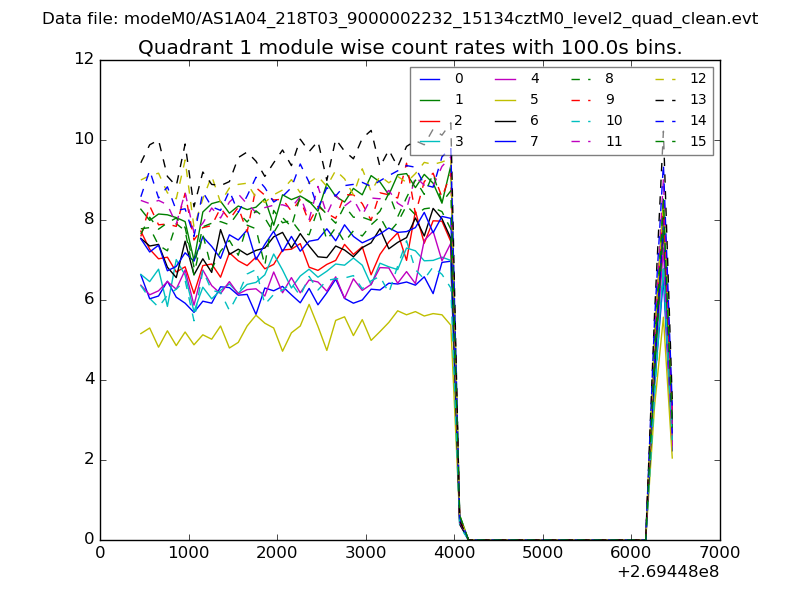
| Module-wise count rates for Quadrant A Data is divided into 100 sec bins |
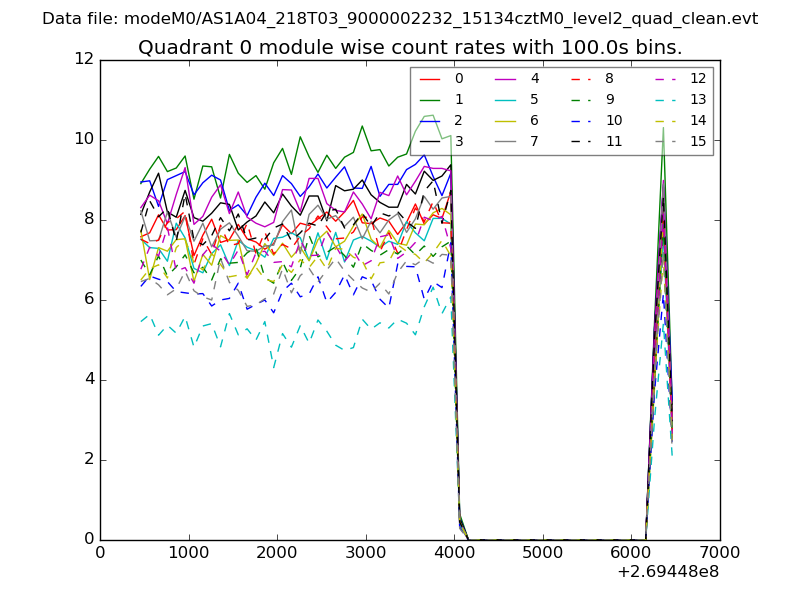 |
 |
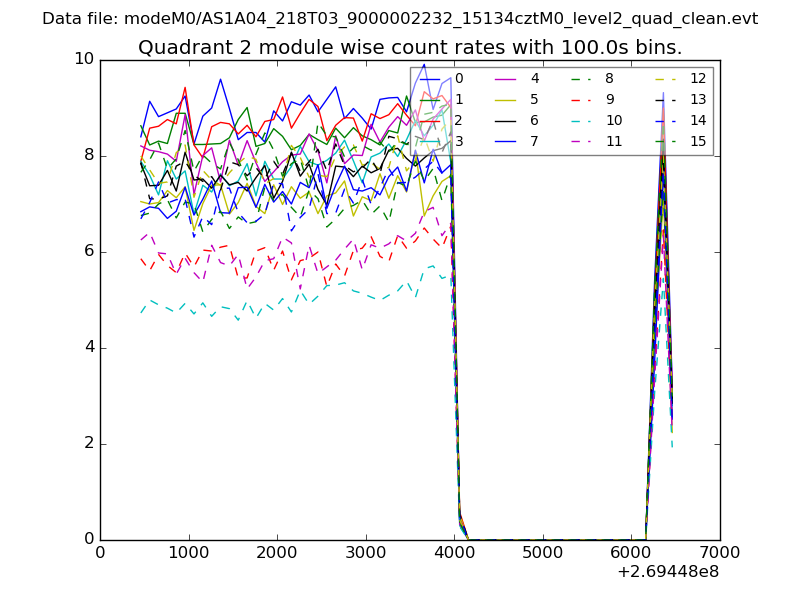
| Module-wise count rates for Quadrant B Data is divided into 100 sec bins |
 |
 |
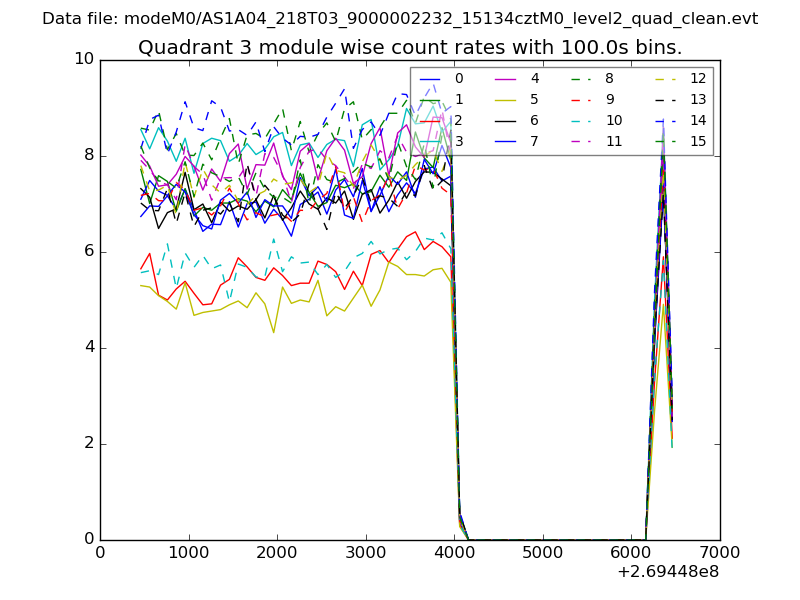
| Module-wise count rates for Quadrant C Data is divided into 100 sec bins |
 |
 |
| Module-wise count rates for Quadrant D Data is divided into 100 sec bins |
 |
 |
| Parameter | Plot |
|---|---|
| CZT HV Monitor | 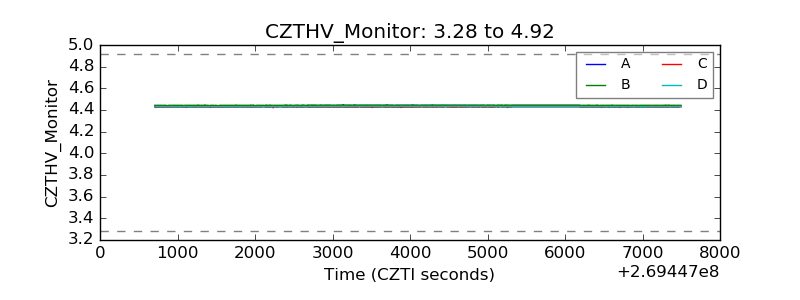 |
| D_VDD | 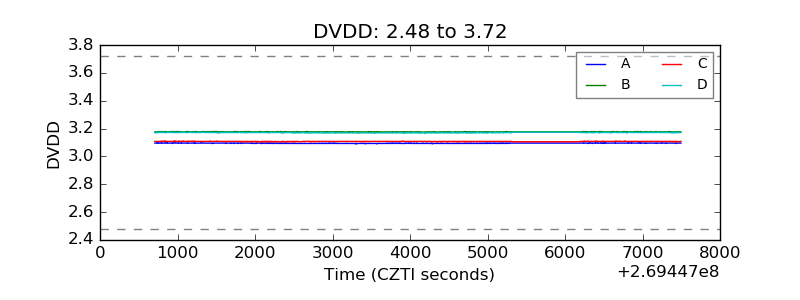 |
| Temperature 1 | 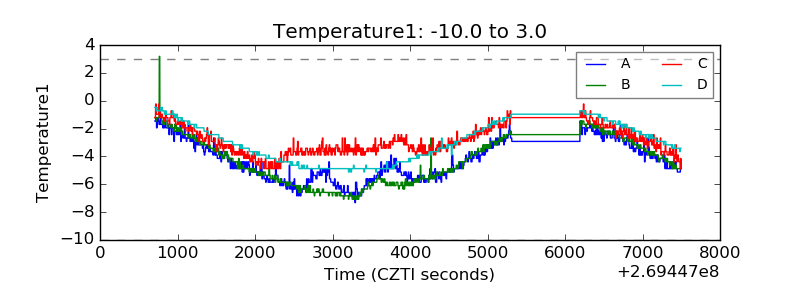 |
| Veto HV Monitor | 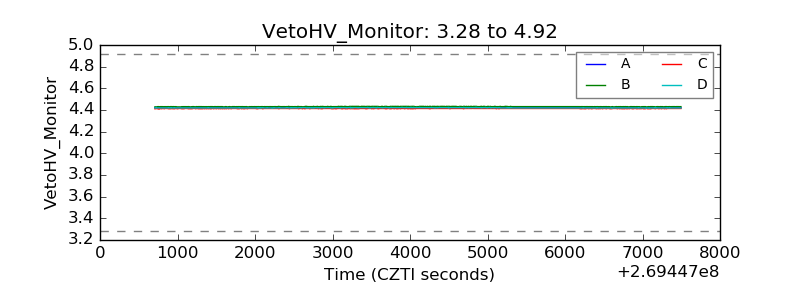 |
| Veto LLD | 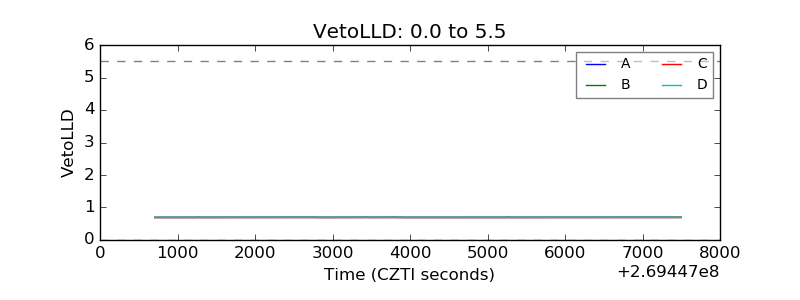 |
| Alpha Counter | 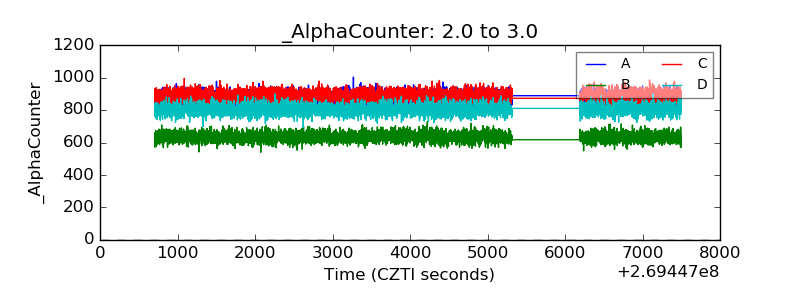 |
| _CPM_Rate | 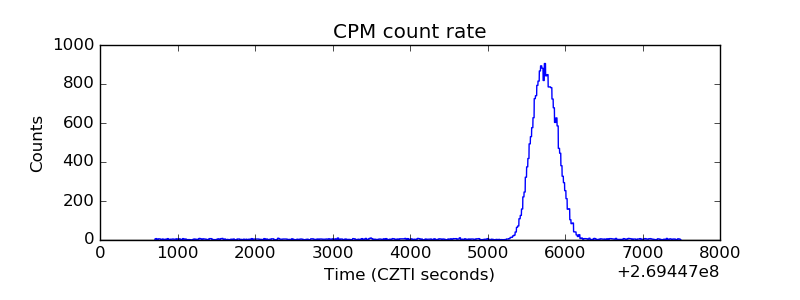 |
| CZT Counter | 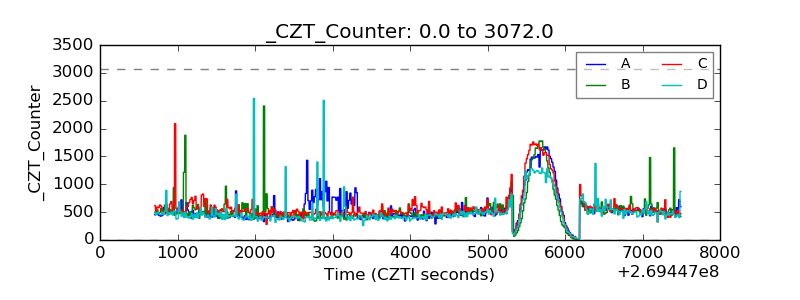 |
| +2.5 Volts monitor | 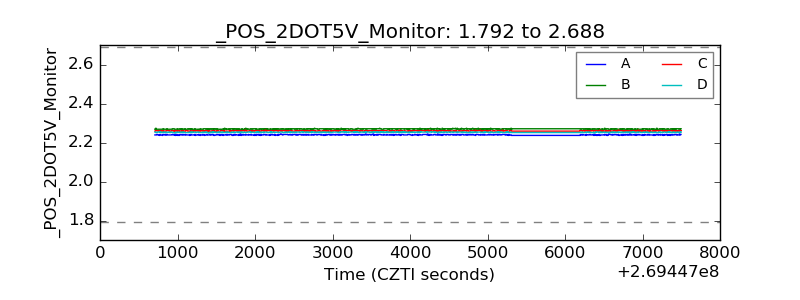 |
| +5 Volts monitor |  |
| _ROLL_ROT | 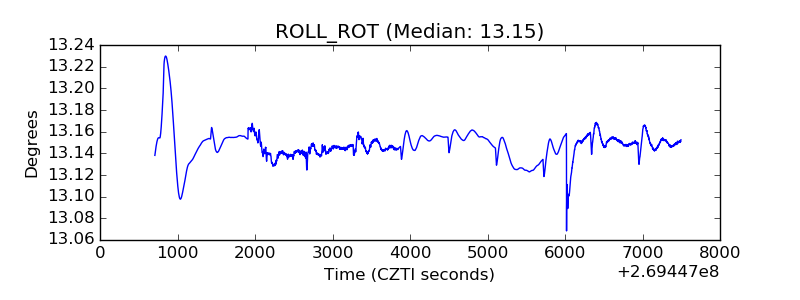 |
| _Roll_DEC | 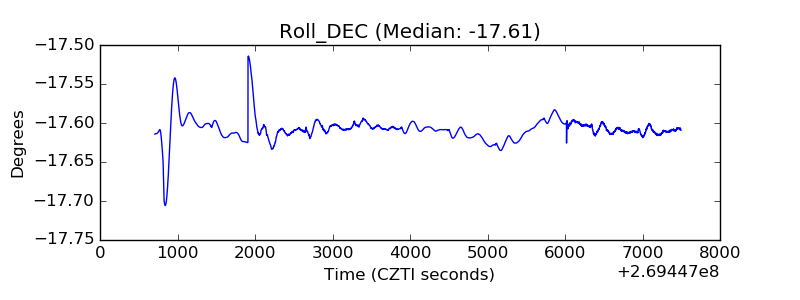 |
| _Roll_RA | 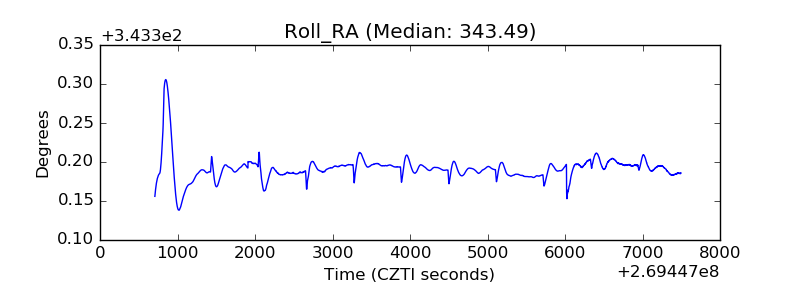 |
| Veto Counter | 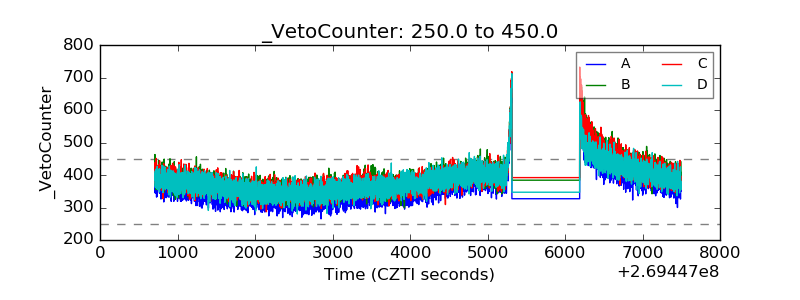 |