| Param | Original file | Final file |
|---|---|---|
| Filename | modeM0/AS1A04_218T03_9000002232_15136cztM0_level2.evt | modeM0/AS1A04_218T03_9000002232_15136cztM0_level2_quad_clean.evt |
| Size (bytes) | 501,523,200 | 98,213,760 |
| Size | 478.3 MB | 93.7 MB |
| Events in quadrant A | 3,615,728 | 622,970 |
| Events in quadrant B | 3,771,226 | 637,695 |
| Events in quadrant C | 3,719,800 | 625,774 |
| Events in quadrant D | 3,604,217 | 597,782 |
| Mode M0 | |||
|---|---|---|---|
| Quadrant | BADHDUFLAG | Total packets | Discarded packets |
| A | 0 | 15227 | 3 |
| B | 0 | 15681 | 2 |
| C | 0 | 15269 | 2 |
| D | 0 | 15415 | 2 |
| Mode SS | |||
|---|---|---|---|
| Quadrant | BADHDUFLAG | Total packets | Discarded packets |
| A | 0 | 146 | 0 |
| B | 0 | 146 | 0 |
| C | 0 | 146 | 0 |
| D | 0 | 146 | 0 |
| Mode M9 | |||
|---|---|---|---|
| Quadrant | BADHDUFLAG | Total packets | Discarded packets |
| A | 0 | 21 | 0 |
| B | 0 | 21 | 0 |
| C | 0 | 21 | 0 |
| D | 0 | 21 | 0 |
| Quadrant | Total seconds | Saturated seconds | Saturation percentage |
|---|---|---|---|
| A | 7033 | 75 | 1.066401% |
| B | 7033 | 131 | 1.862648% |
| C | 7033 | 44 | 0.625622% |
| D | 7033 | 99 | 1.407650% |
Noise dominated data is calculated using 1-second bins in cleaned event files. If a bin has >2000 counts, and if more than 50% of those come from <1% of pixels, then it is considered to be noise-dominated and hence unusable.
| Quadrant | # 1 sec bins | Bins with >0 counts | Bins with >2000 counts | High rate bins dominated by noise | Noise dominated (total time) | Noise dominated (detector-on time) | Marked lightcurve |
|---|---|---|---|---|---|---|---|
| A | 9234 | 7035 | 11 | 11 | 0.12% | 0.16% | 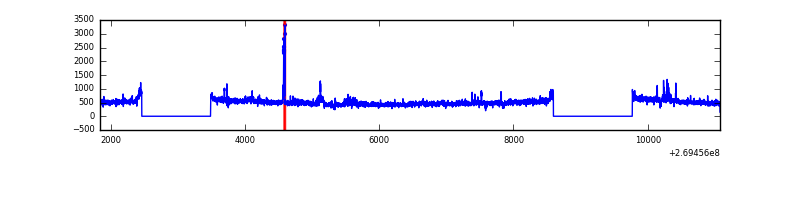 |
| B | 9234 | 7035 | 25 | 25 | 0.27% | 0.36% | 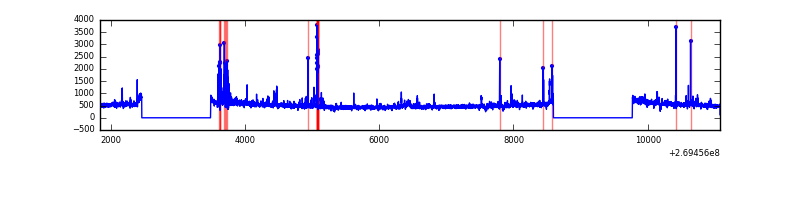 |
| C | 9234 | 7035 | 0 | 0 | 0.00% | 0.00% | 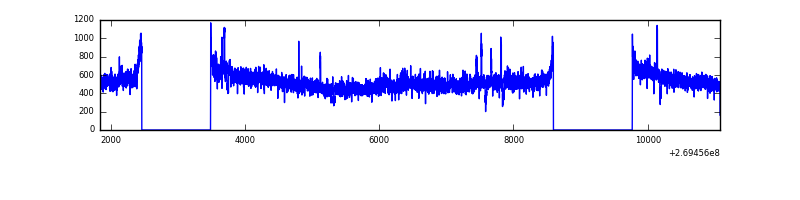 |
| D | 9234 | 7035 | 57 | 57 | 0.62% | 0.81% | 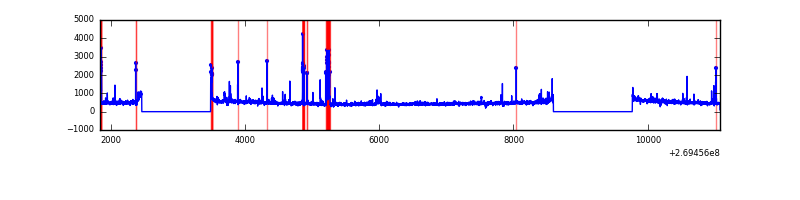 |
Top three noisy pixels from each quadrant. If the there are fewer than three noisy pixels in the level2.evt file, extra rows are filled as -1
| Pixel properties | Quadrant properties | ||||||
|---|---|---|---|---|---|---|---|
| Quadrant | DetID | PixID | Counts | Sigma | Mean | Median | Sigma |
| A | 12 | 189 | 117708 | 646.65 | 888 | 869 | 180.7 |
| A | 13 | 248 | 40943 | 221.79 | 888 | 869 | 180.7 |
| A | 1 | 162 | 15896 | 83.17 | 888 | 869 | 180.7 |
| B | 3 | 64 | 200811 | 1189.02 | 891 | 869 | 168.2 |
| B | 0 | 230 | 21380 | 121.98 | 891 | 869 | 168.2 |
| B | 0 | 197 | 20138 | 114.59 | 891 | 869 | 168.2 |
| C | 3 | 233 | 317888 | 1568.09 | 872 | 877 | 202.2 |
| C | 13 | 61 | 6078 | 25.73 | 872 | 877 | 202.2 |
| C | 7 | 247 | 2078 | 5.94 | 872 | 877 | 202.2 |
| D | 13 | 172 | 90803 | 427.33 | 867 | 842 | 210.5 |
| D | 13 | 122 | 65077 | 305.13 | 867 | 842 | 210.5 |
| D | 2 | 120 | 38085 | 176.91 | 867 | 842 | 210.5 |
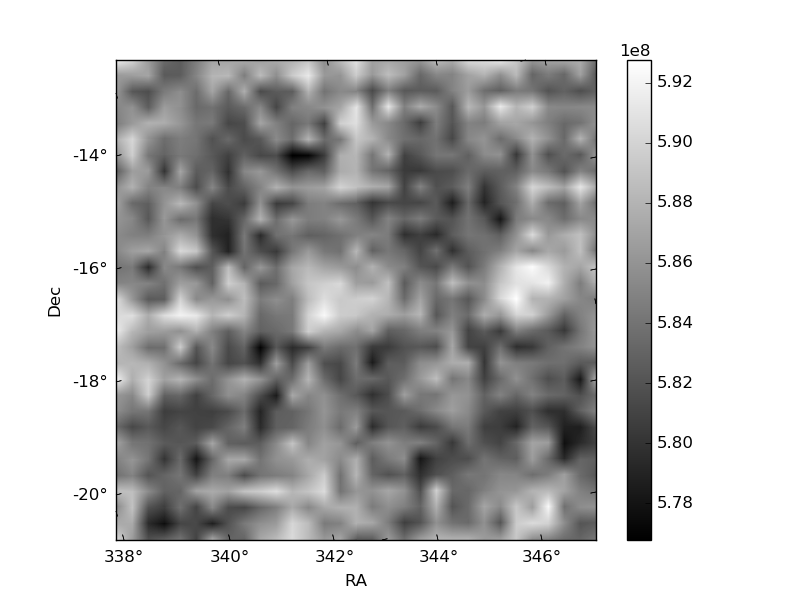
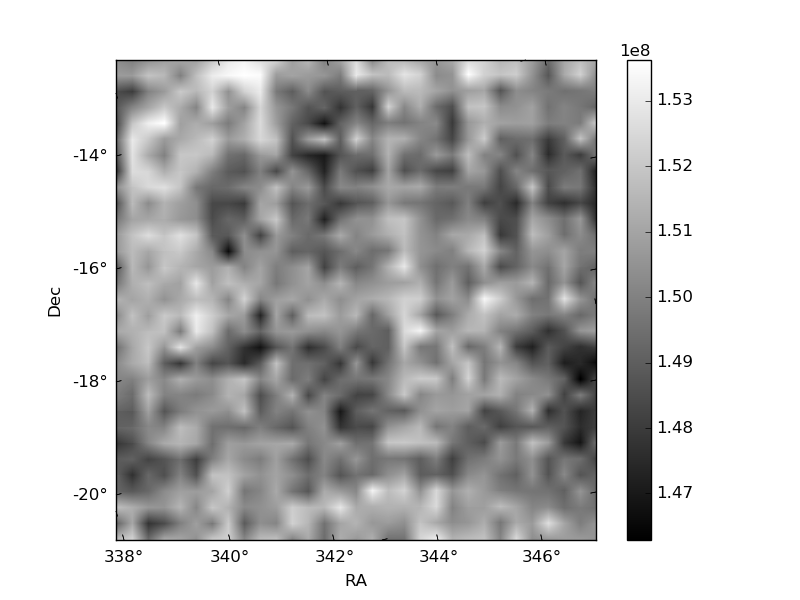
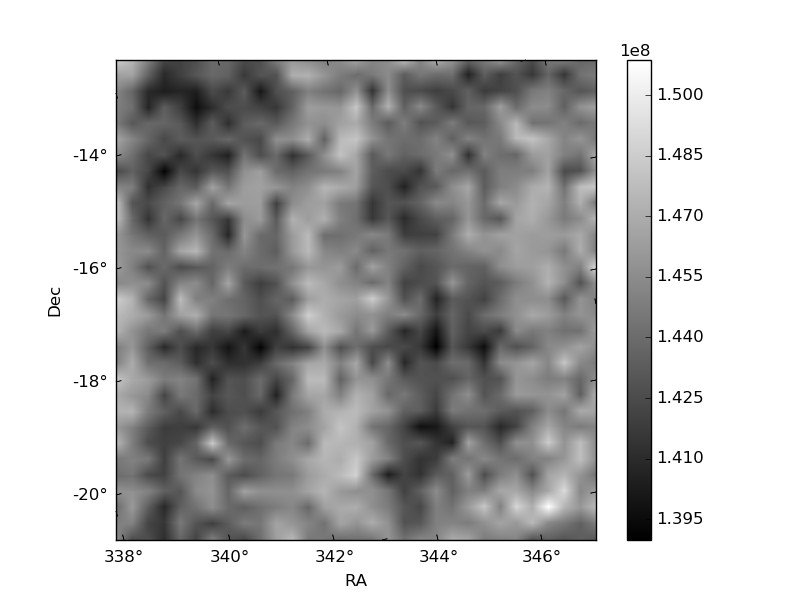
Histogram calculated using DETX and DETY for each event in the final _common_clean file
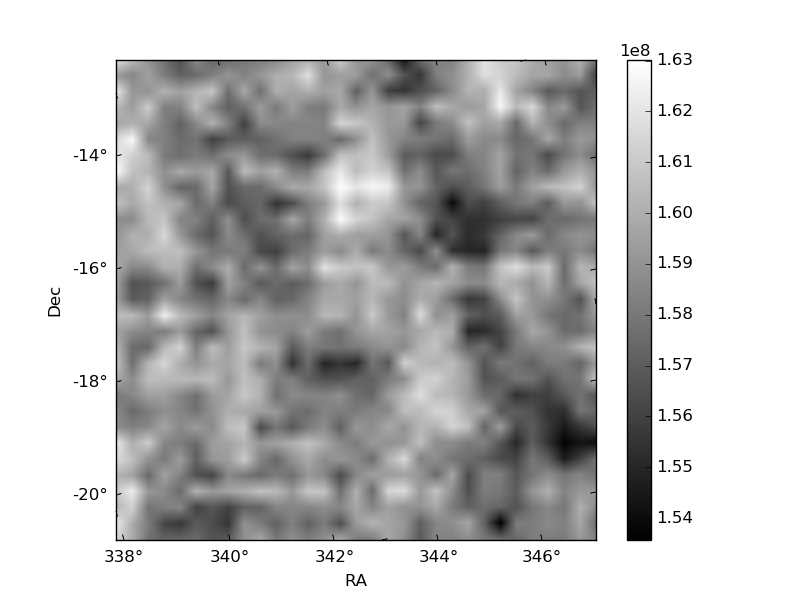
| Quadrant A | 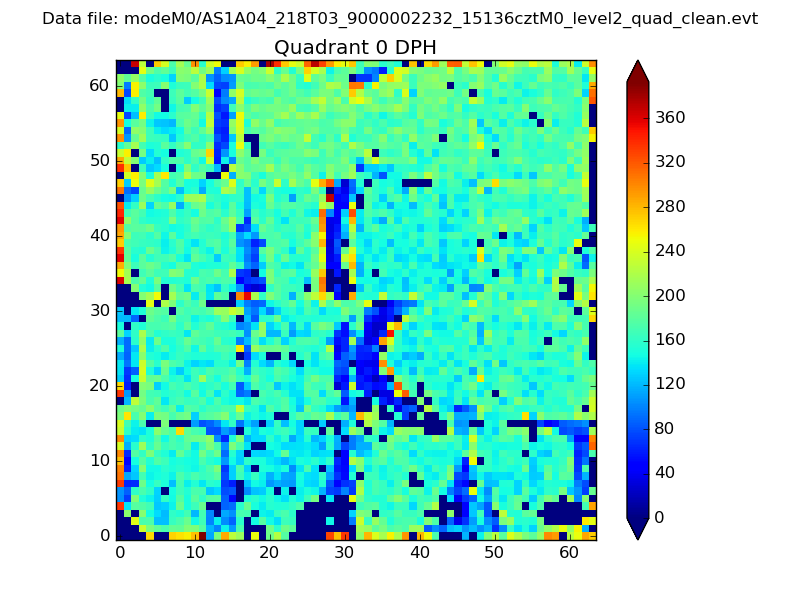 |
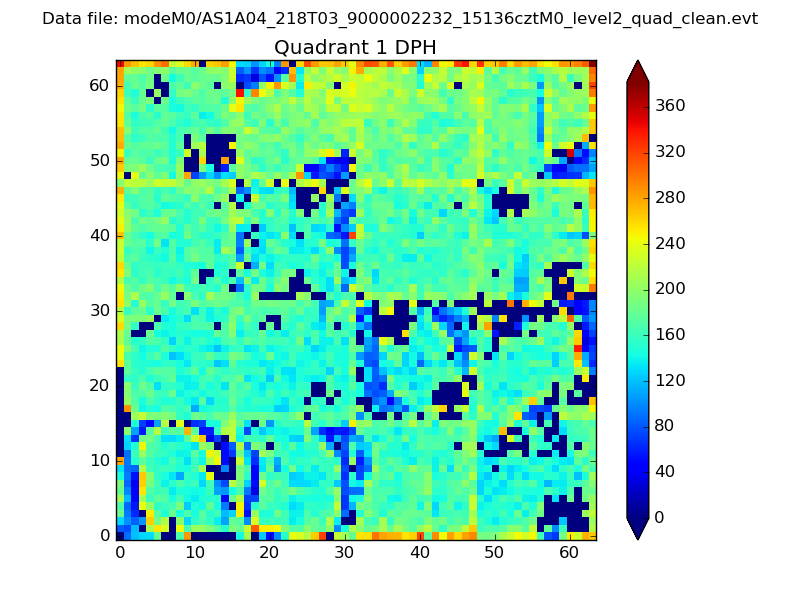 |
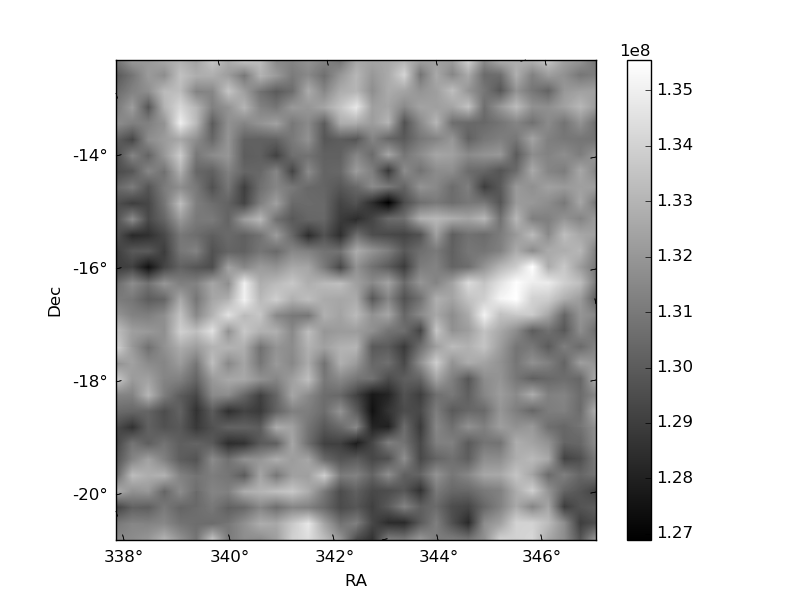
Quadrant B |
|---|---|---|---|
| Quadrant D | 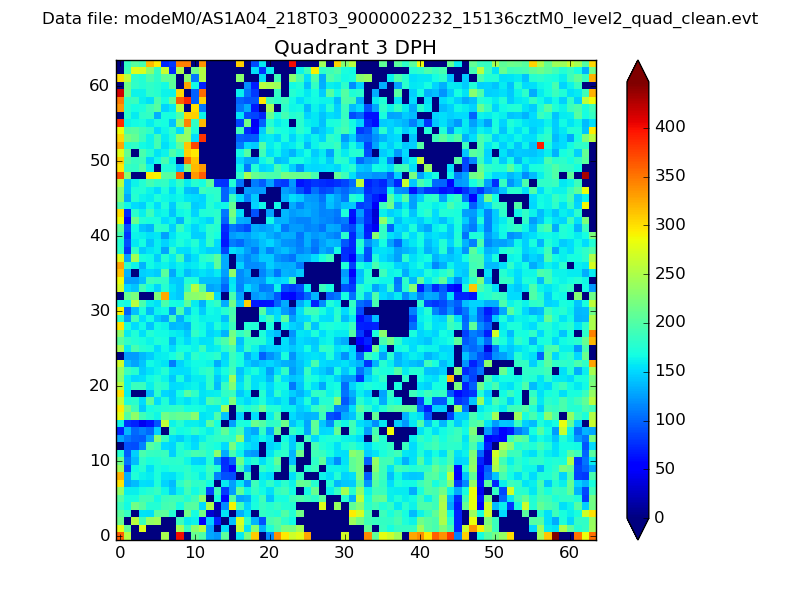 |
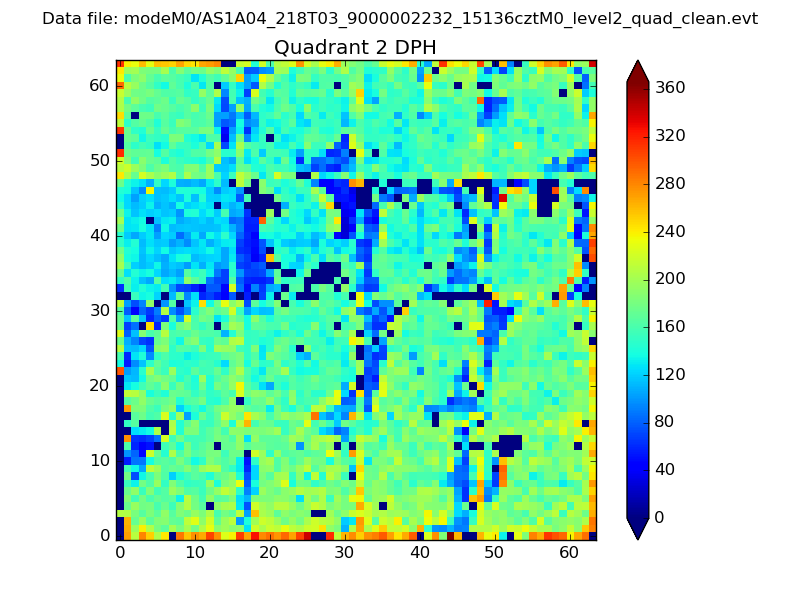 |
Quadrant C |
| Plot type | Count rate plots | Images |
|---|---|---|
| Comparison with Poisson distribution Blue bars denote a histogram of data divided into 1 sec bins. Red curve is a Poisson curve with rate = median count rate of data. |
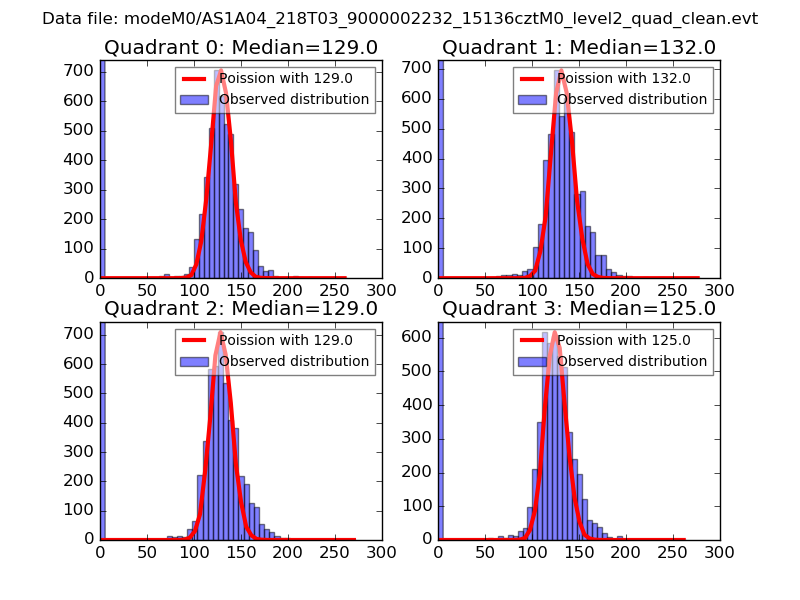 |
 |
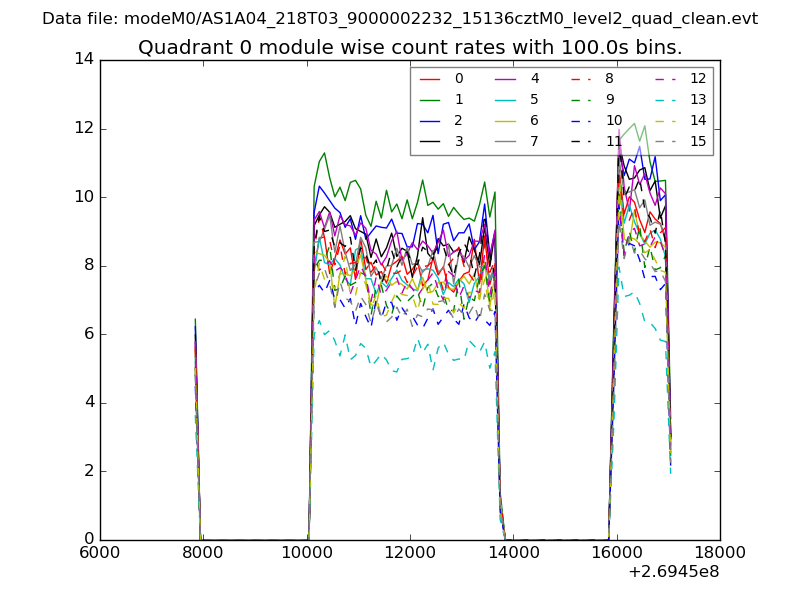
| Quadrant-wise count rates Data is divided into 100 sec bins |
 |
|
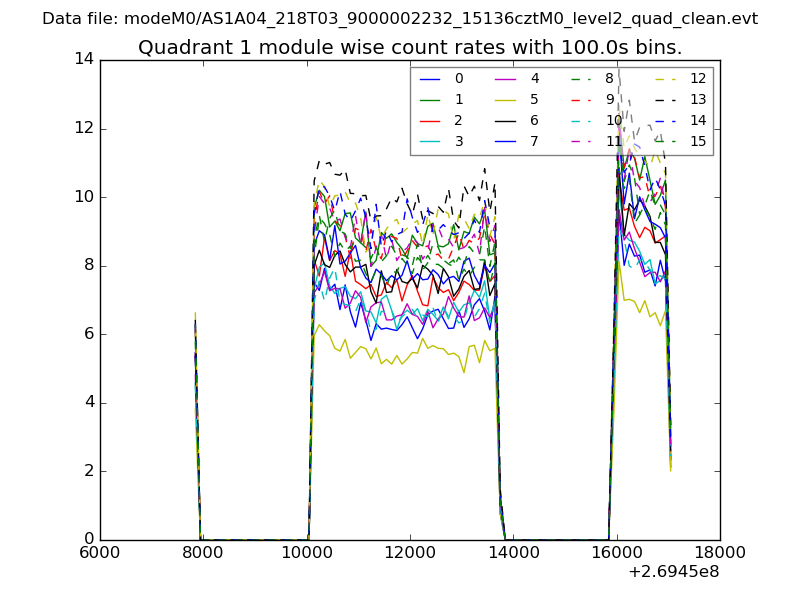
| Module-wise count rates for Quadrant A Data is divided into 100 sec bins |
 |
 |
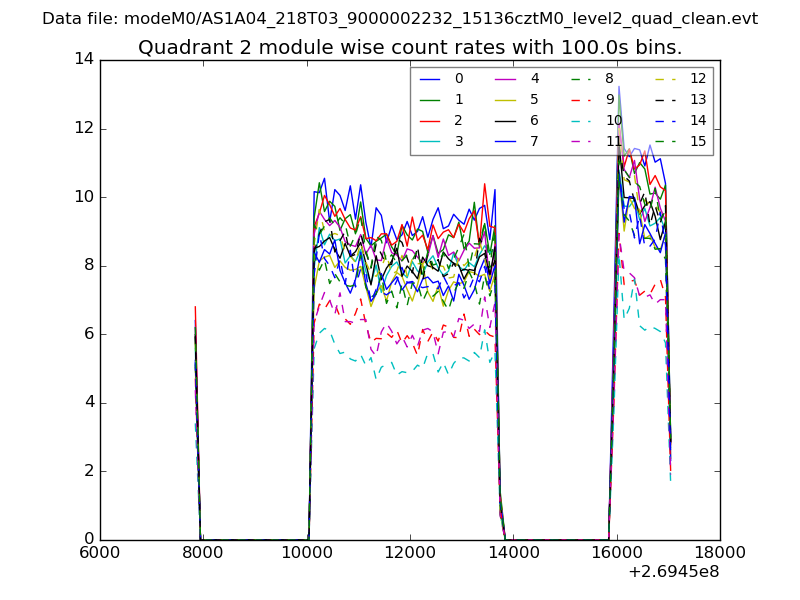
| Module-wise count rates for Quadrant B Data is divided into 100 sec bins |
 |
 |
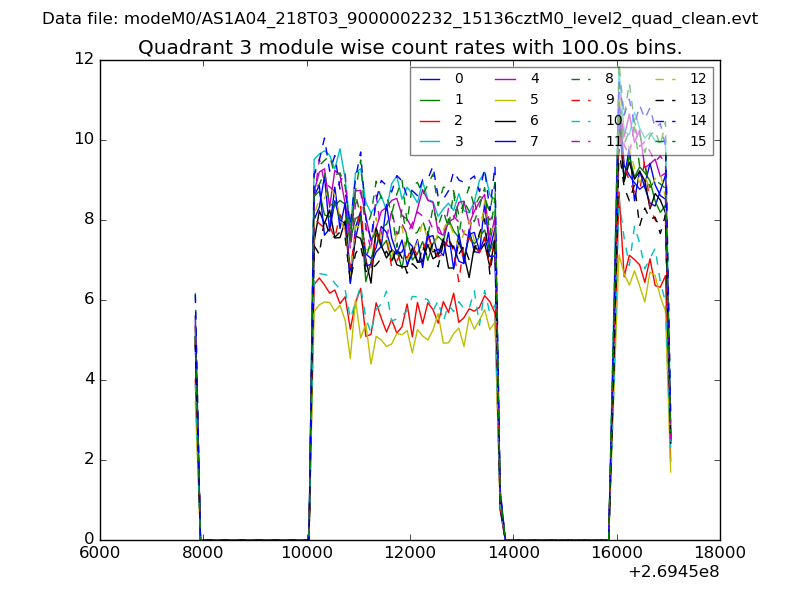
| Module-wise count rates for Quadrant C Data is divided into 100 sec bins |
 |
 |
| Module-wise count rates for Quadrant D Data is divided into 100 sec bins |
 |
 |
| Parameter | Plot |
|---|---|
| CZT HV Monitor | 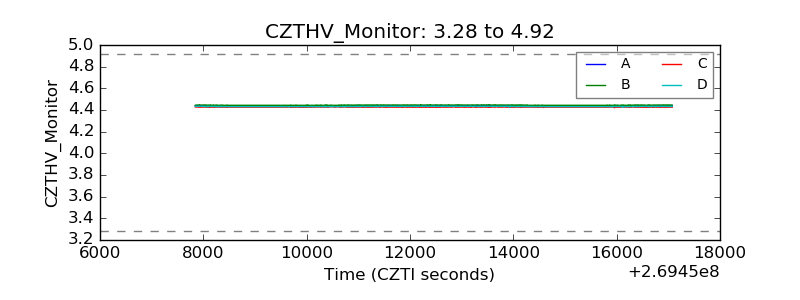 |
| D_VDD | 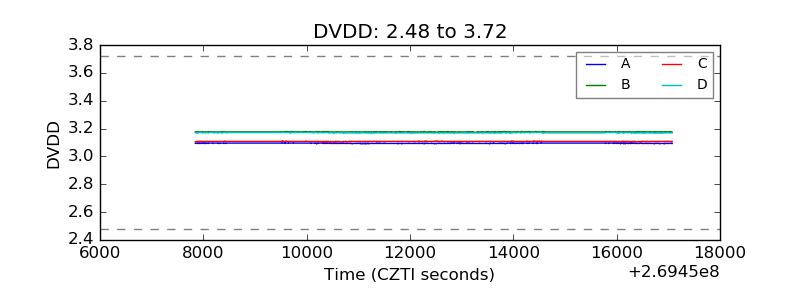 |
| Temperature 1 | 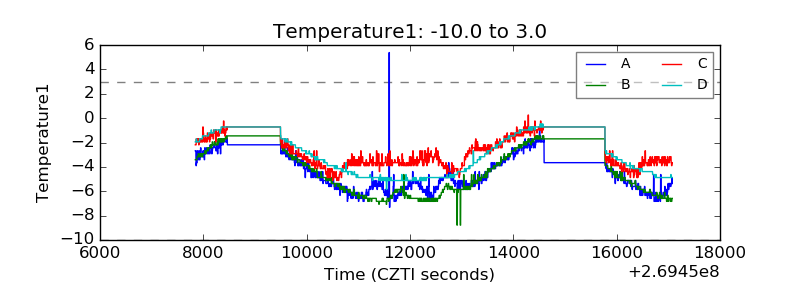 |
| Veto HV Monitor | 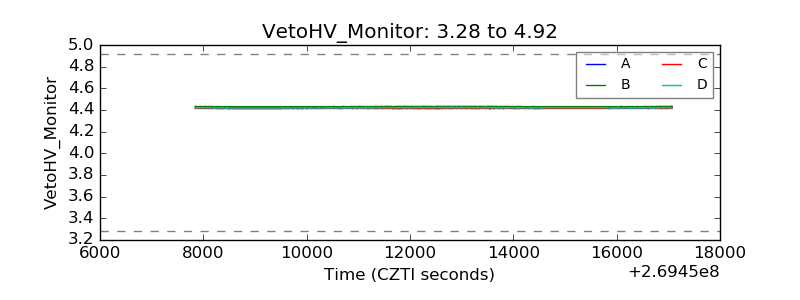 |
| Veto LLD | 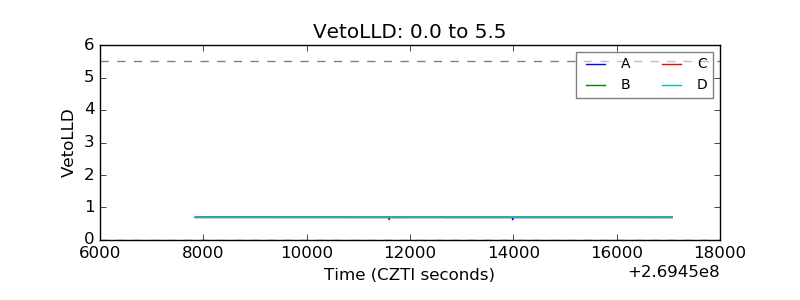 |
| Alpha Counter | 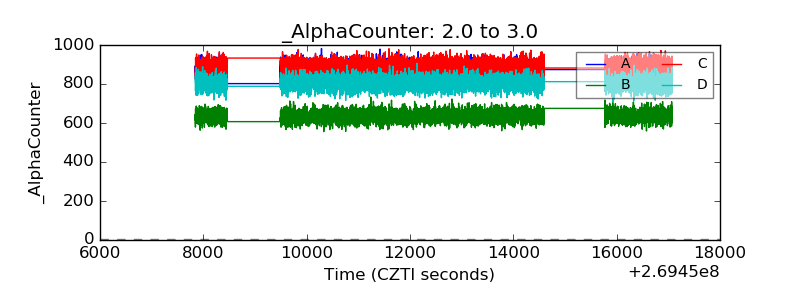 |
| _CPM_Rate | 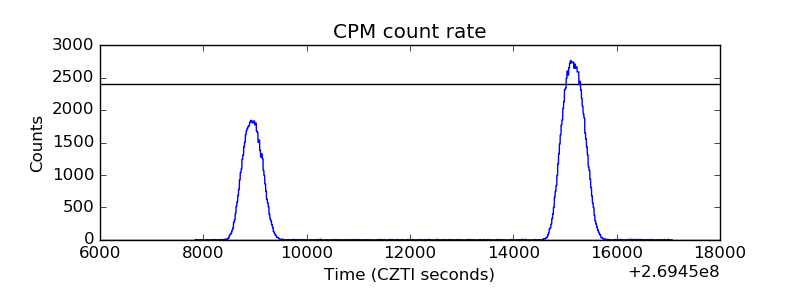 |
| CZT Counter | 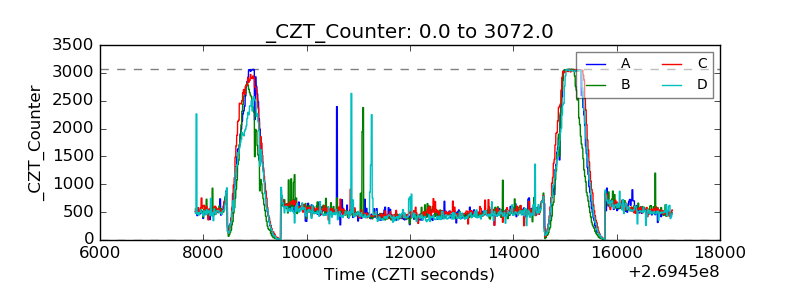 |
| +2.5 Volts monitor |  |
| +5 Volts monitor |  |
| _ROLL_ROT | 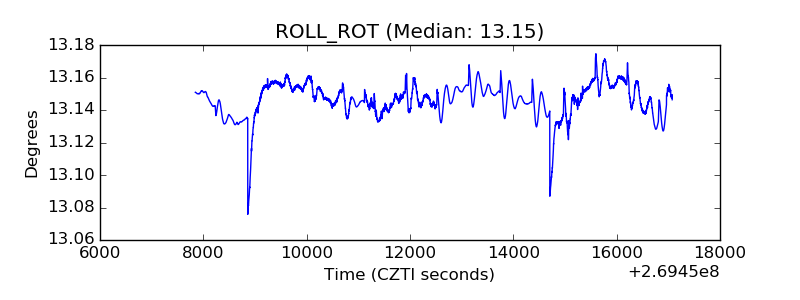 |
| _Roll_DEC | 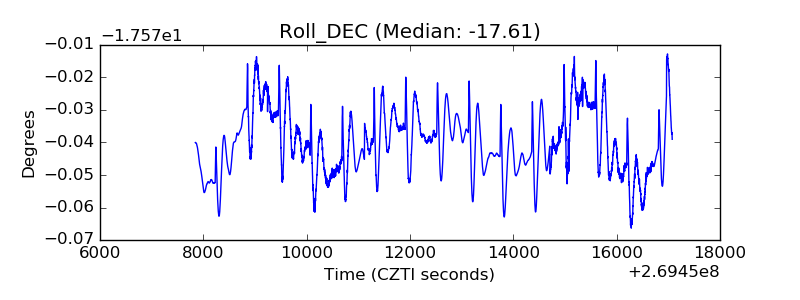 |
| _Roll_RA | 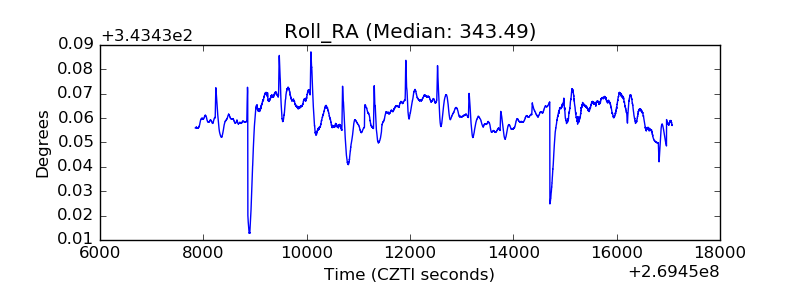 |
| Veto Counter | 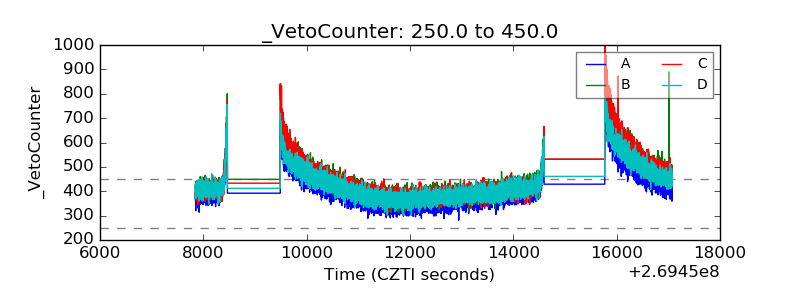 |