| Param | Original file | Final file |
|---|---|---|
| Filename | modeM0/AS1A04_218T03_9000002232_15141cztM0_level2.evt | modeM0/AS1A04_218T03_9000002232_15141cztM0_level2_quad_clean.evt |
| Size (bytes) | 486,408,960 | 99,432,000 |
| Size | 463.9 MB | 94.8 MB |
| Events in quadrant A | 3,445,755 | 637,574 |
| Events in quadrant B | 3,423,477 | 654,387 |
| Events in quadrant C | 3,841,522 | 641,165 |
| Events in quadrant D | 3,564,549 | 610,244 |
| Mode M0 | |||
|---|---|---|---|
| Quadrant | BADHDUFLAG | Total packets | Discarded packets |
| A | 0 | 14314 | 3 |
| B | 0 | 14339 | 2 |
| C | 0 | 15720 | 2 |
| D | 0 | 14975 | 2 |
| Mode SS | |||
|---|---|---|---|
| Quadrant | BADHDUFLAG | Total packets | Discarded packets |
| A | 0 | 136 | 0 |
| B | 0 | 136 | 0 |
| C | 0 | 136 | 0 |
| D | 0 | 136 | 0 |
| Mode M9 | |||
|---|---|---|---|
| Quadrant | BADHDUFLAG | Total packets | Discarded packets |
| A | 0 | 21 | 0 |
| B | 0 | 21 | 0 |
| C | 0 | 21 | 0 |
| D | 0 | 22 | 0 |
| Quadrant | Total seconds | Saturated seconds | Saturation percentage |
|---|---|---|---|
| A | 6714 | 51 | 0.759607% |
| B | 6714 | 70 | 1.042598% |
| C | 6714 | 51 | 0.759607% |
| D | 6714 | 102 | 1.519214% |
Noise dominated data is calculated using 1-second bins in cleaned event files. If a bin has >2000 counts, and if more than 50% of those come from <1% of pixels, then it is considered to be noise-dominated and hence unusable.
| Quadrant | # 1 sec bins | Bins with >0 counts | Bins with >2000 counts | High rate bins dominated by noise | Noise dominated (total time) | Noise dominated (detector-on time) | Marked lightcurve |
|---|---|---|---|---|---|---|---|
| A | 8020 | 6723 | 0 | 0 | 0.00% | 0.00% | 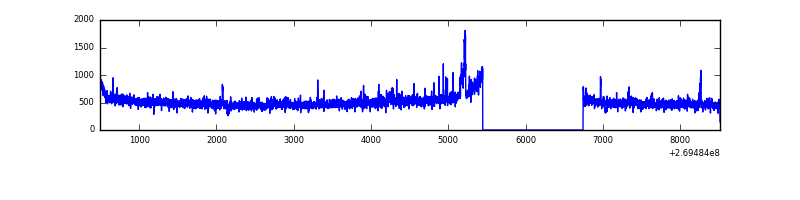 |
| B | 8020 | 6723 | 5 | 5 | 0.06% | 0.07% | 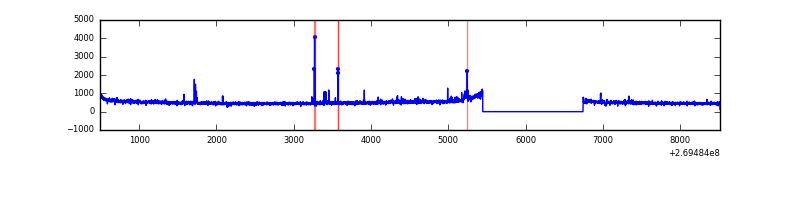 |
| C | 8020 | 6723 | 0 | 0 | 0.00% | 0.00% | 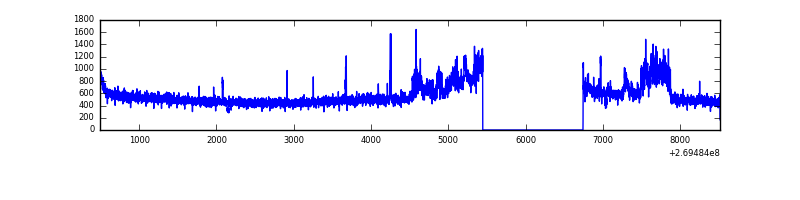 |
| D | 8020 | 6723 | 66 | 66 | 0.82% | 0.98% | 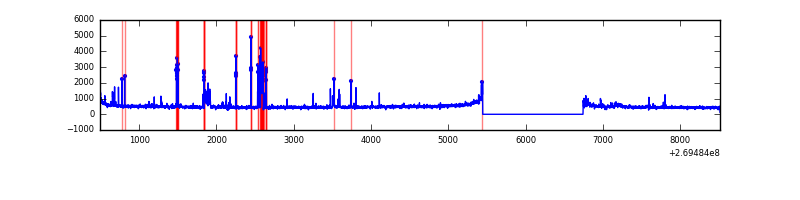 |
Top three noisy pixels from each quadrant. If the there are fewer than three noisy pixels in the level2.evt file, extra rows are filled as -1
| Pixel properties | Quadrant properties | ||||||
|---|---|---|---|---|---|---|---|
| Quadrant | DetID | PixID | Counts | Sigma | Mean | Median | Sigma |
| A | 12 | 189 | 116321 | 673.84 | 855 | 838 | 171.4 |
| A | 1 | 162 | 25700 | 145.07 | 855 | 838 | 171.4 |
| A | 1 | 178 | 8446 | 44.39 | 855 | 838 | 171.4 |
| B | 3 | 64 | 38295 | 231.7 | 856 | 834 | 161.7 |
| B | 12 | 111 | 18795 | 111.09 | 856 | 834 | 161.7 |
| B | 11 | 111 | 16123 | 94.56 | 856 | 834 | 161.7 |
| C | 3 | 233 | 563944 | 2925.51 | 839 | 846 | 192.5 |
| C | 7 | 247 | 7640 | 35.3 | 839 | 846 | 192.5 |
| C | 13 | 61 | 5883 | 26.17 | 839 | 846 | 192.5 |
| D | 7 | 223 | 206921 | 1008.68 | 839 | 819 | 204.3 |
| D | 10 | 70 | 71430 | 345.57 | 839 | 819 | 204.3 |
| D | 13 | 122 | 33930 | 162.05 | 839 | 819 | 204.3 |
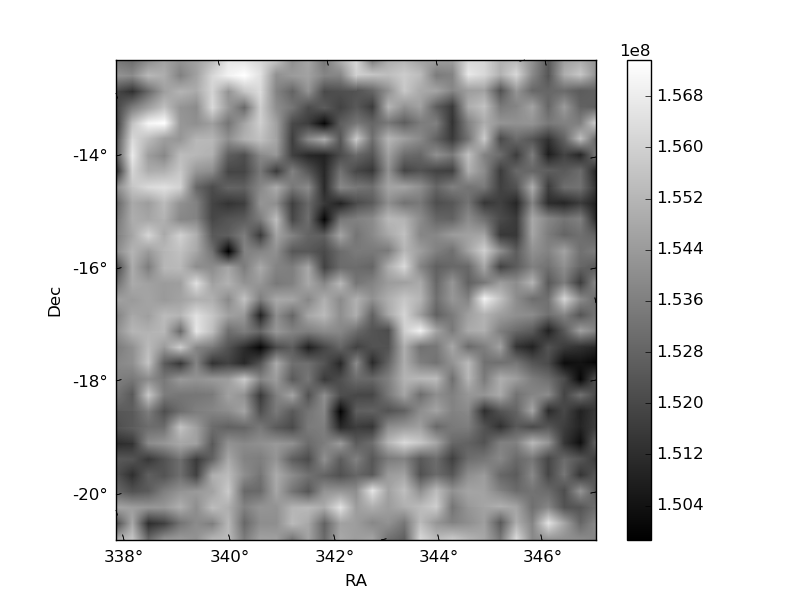
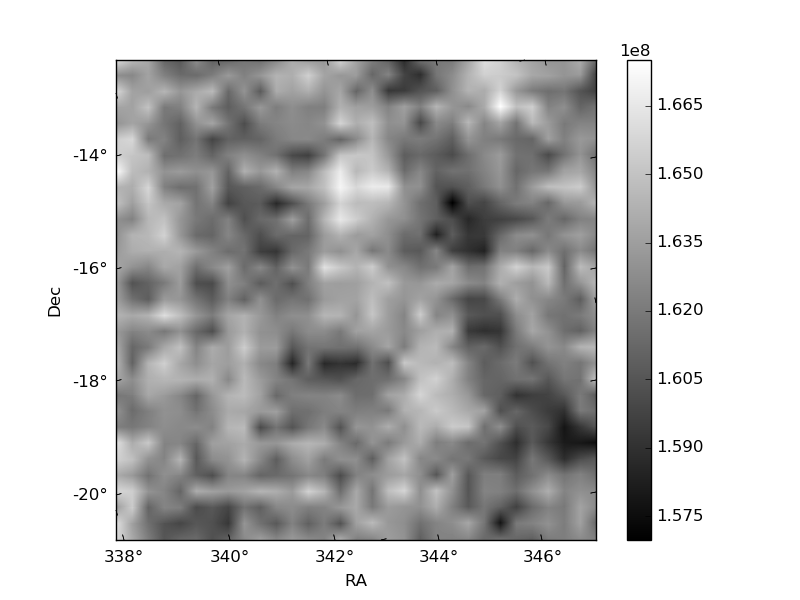
Histogram calculated using DETX and DETY for each event in the final _common_clean file
| Quadrant A | 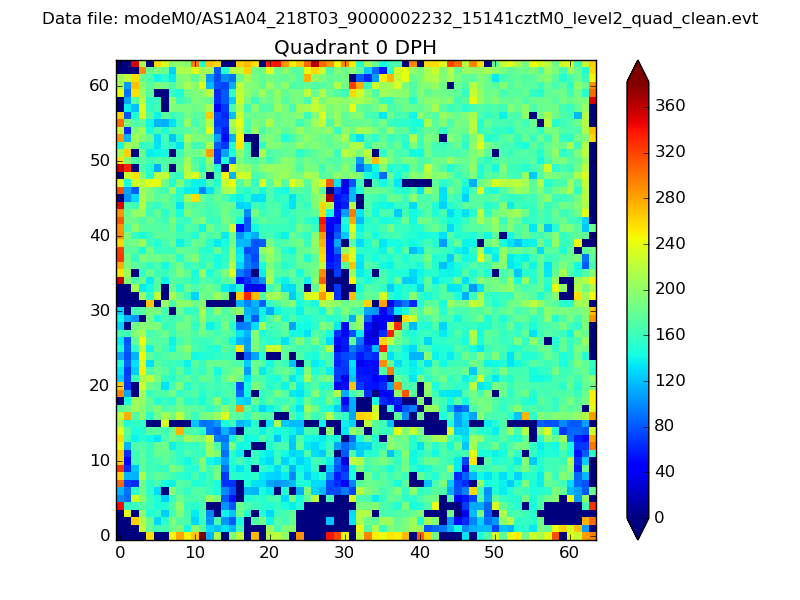 |
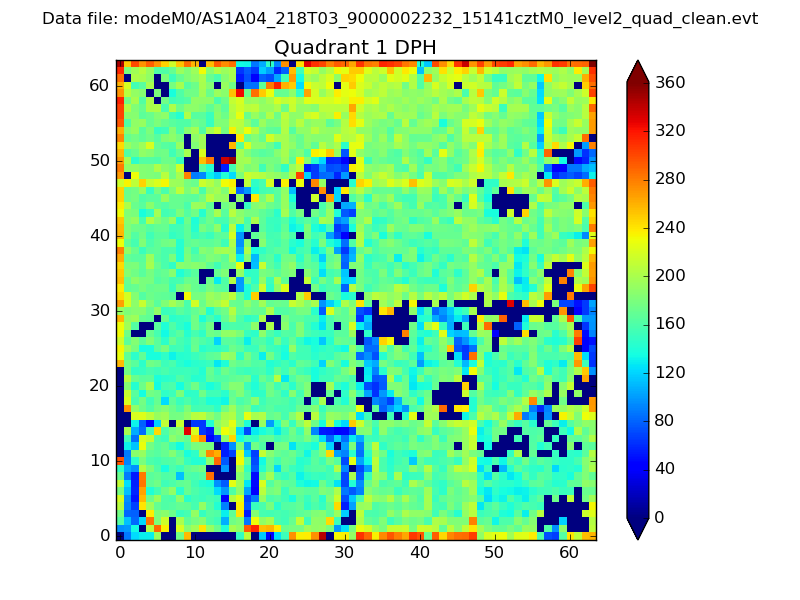 |
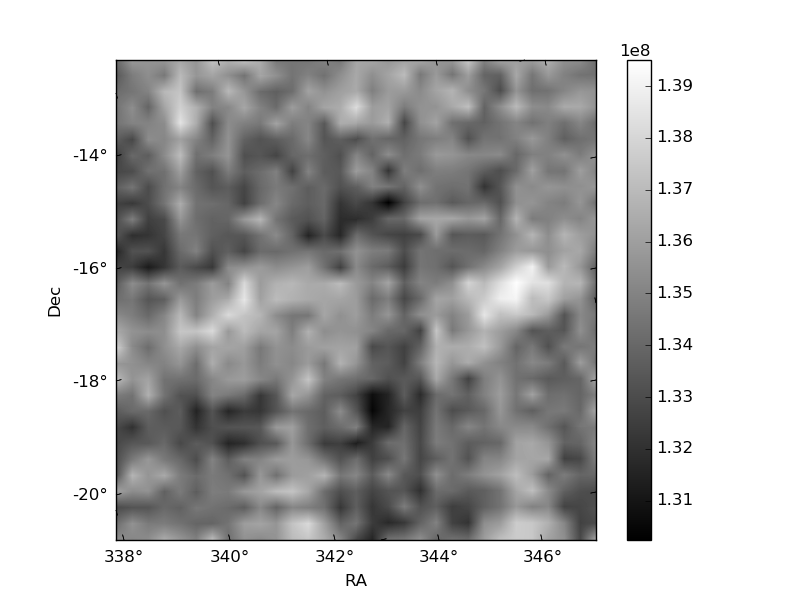
Quadrant B |
|---|---|---|---|
| Quadrant D | 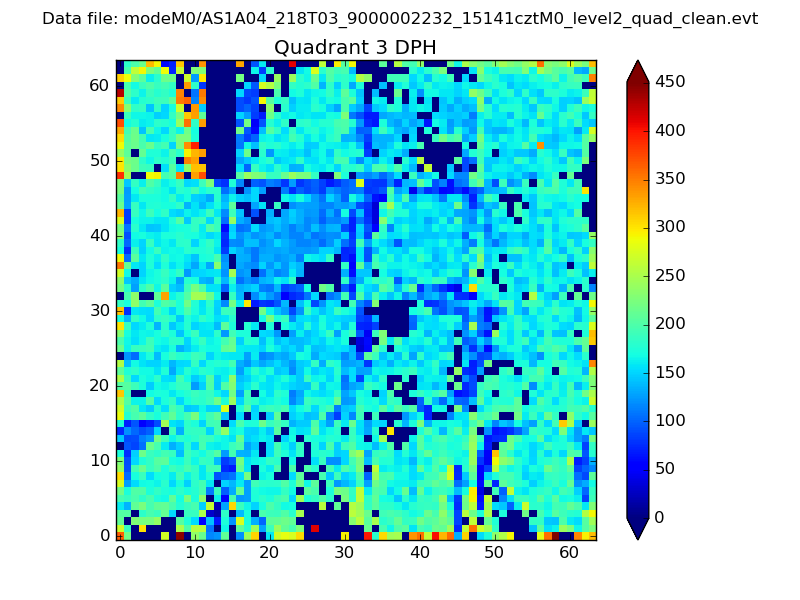 |
 |
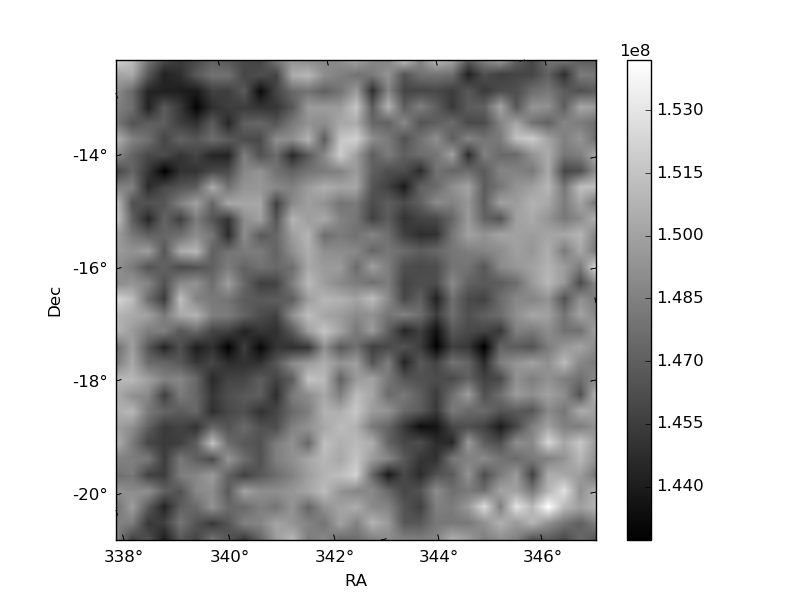
Quadrant C |
| Plot type | Count rate plots | Images |
|---|---|---|
| Comparison with Poisson distribution Blue bars denote a histogram of data divided into 1 sec bins. Red curve is a Poisson curve with rate = median count rate of data. |
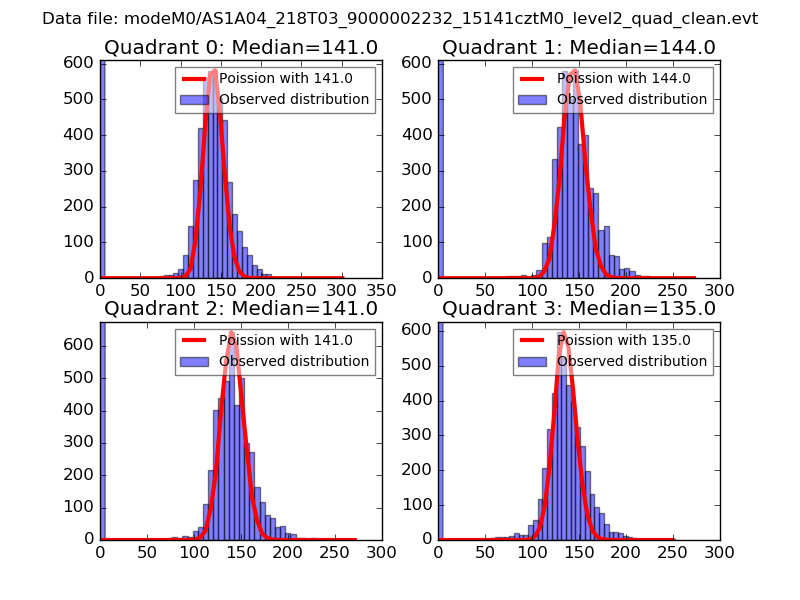 |
 |
| Quadrant-wise count rates Data is divided into 100 sec bins |
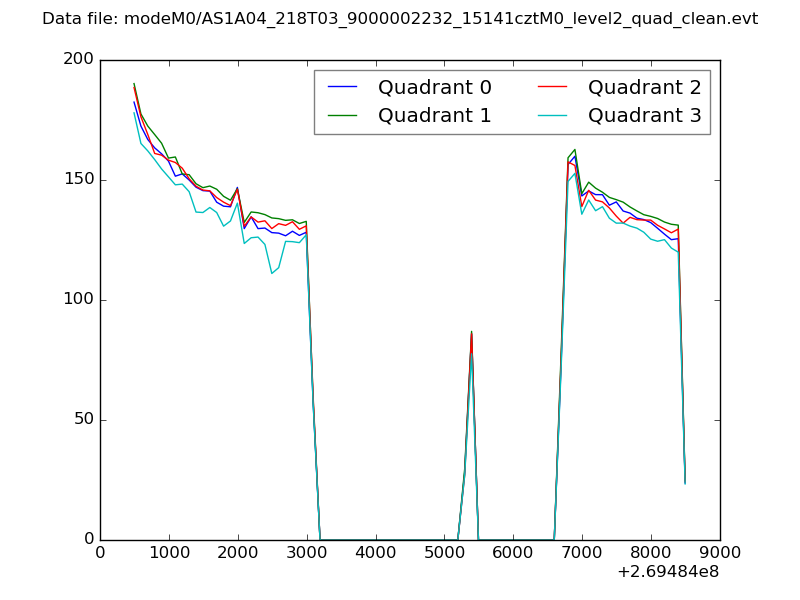 |
|
| Module-wise count rates for Quadrant A Data is divided into 100 sec bins |
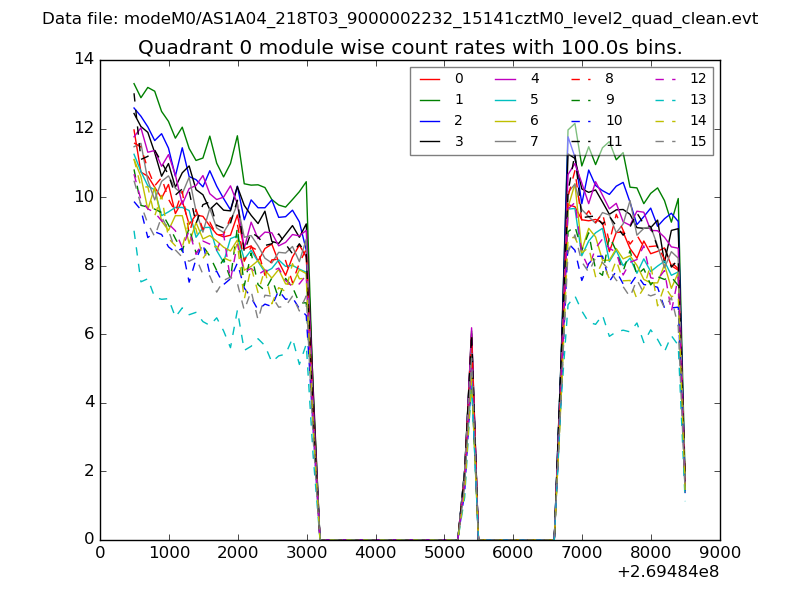 |
 |
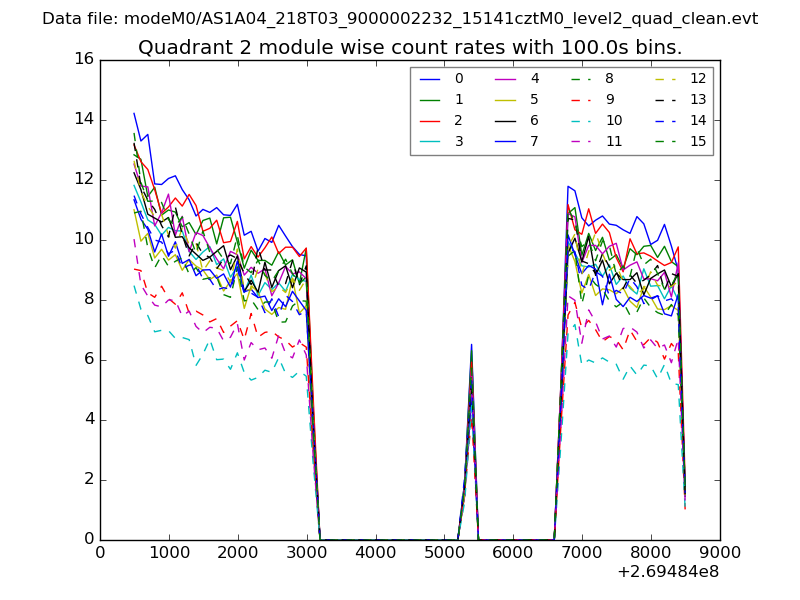
| Module-wise count rates for Quadrant B Data is divided into 100 sec bins |
 |
 |
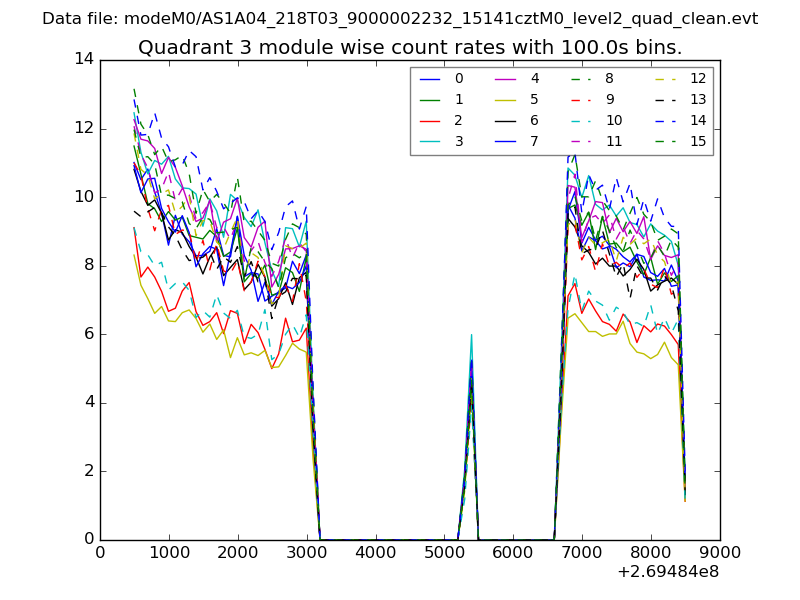
| Module-wise count rates for Quadrant C Data is divided into 100 sec bins |
 |
 |
| Module-wise count rates for Quadrant D Data is divided into 100 sec bins |
 |
 |
| Parameter | Plot |
|---|---|
| CZT HV Monitor | 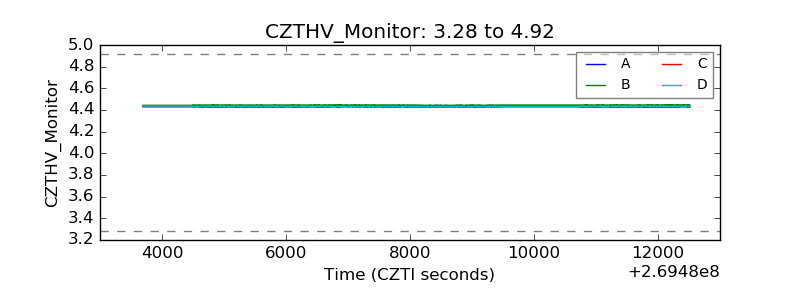 |
| D_VDD | 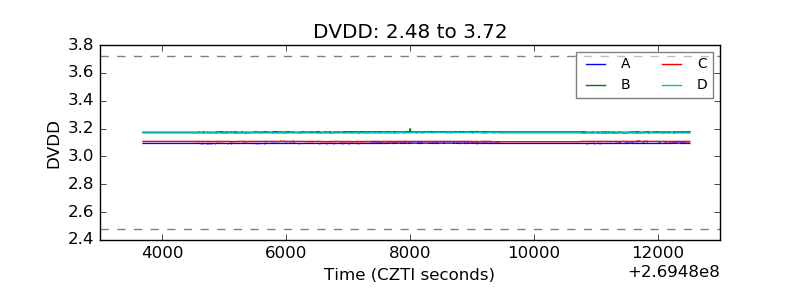 |
| Temperature 1 | 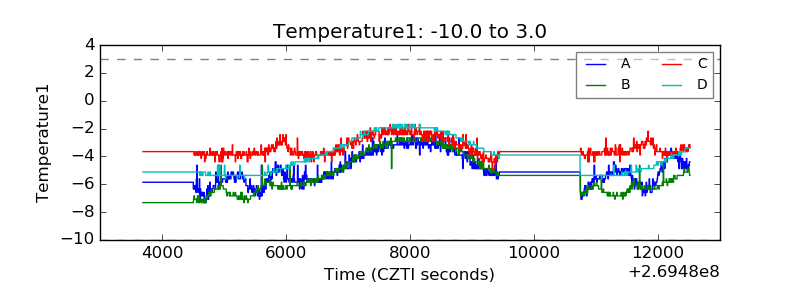 |
| Veto HV Monitor | 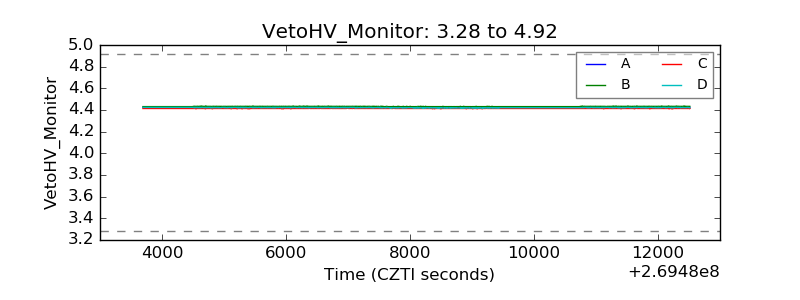 |
| Veto LLD | 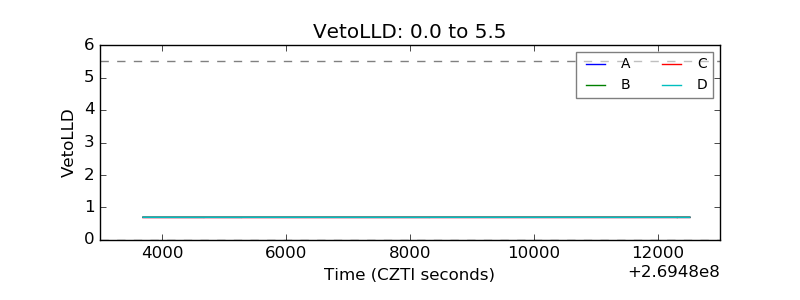 |
| Alpha Counter |  |
| _CPM_Rate | 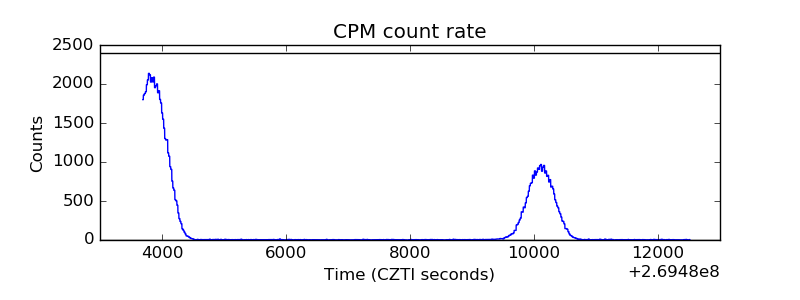 |
| CZT Counter |  |
| +2.5 Volts monitor |  |
| +5 Volts monitor |  |
| _ROLL_ROT | 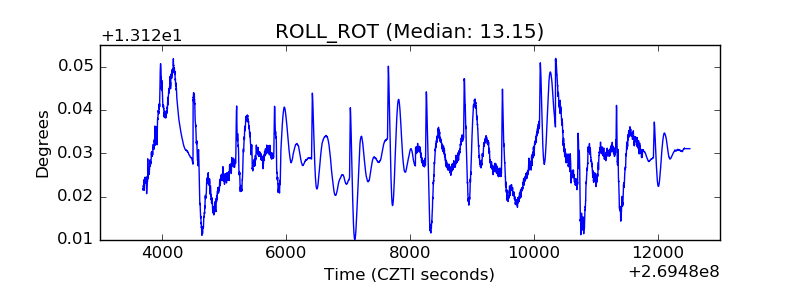 |
| _Roll_DEC | 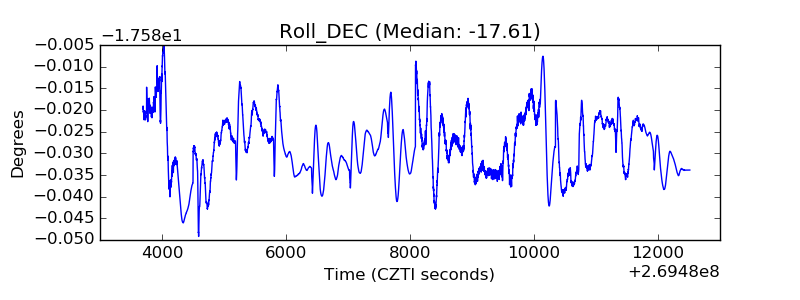 |
| _Roll_RA | 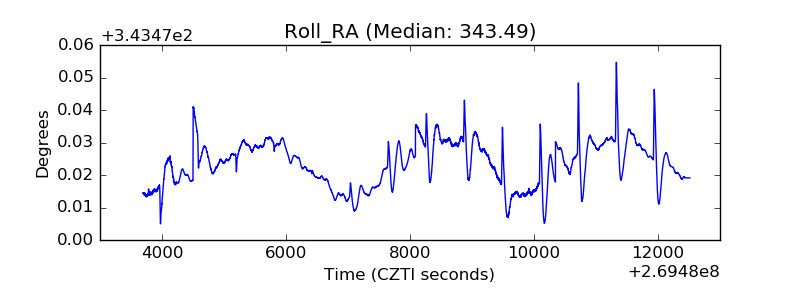 |
| Veto Counter | 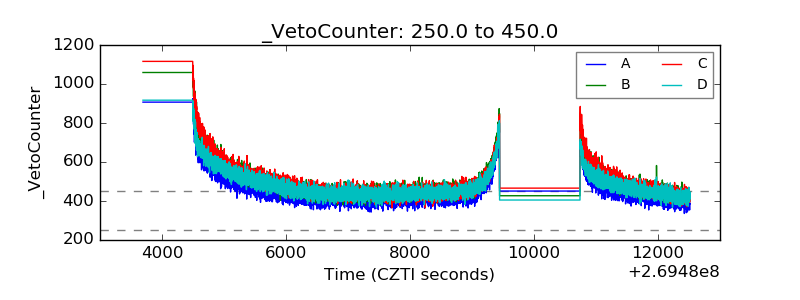 |