| Param | Original file | Final file |
|---|---|---|
| Filename | modeM0/AS1A04_218T03_9000002232_15143cztM0_level2.evt | modeM0/AS1A04_218T03_9000002232_15143cztM0_level2_quad_clean.evt |
| Size (bytes) | 810,397,440 | 145,264,320 |
| Size | 772.9 MB | 138.5 MB |
| Events in quadrant A | 6,022,750 | 900,895 |
| Events in quadrant B | 6,029,564 | 922,239 |
| Events in quadrant C | 5,988,254 | 907,622 |
| Events in quadrant D | 5,714,753 | 863,860 |
| Mode M0 | |||
|---|---|---|---|
| Quadrant | BADHDUFLAG | Total packets | Discarded packets |
| A | 0 | 25121 | 3 |
| B | 0 | 25308 | 2 |
| C | 0 | 24772 | 2 |
| D | 0 | 24936 | 2 |
| Mode SS | |||
|---|---|---|---|
| Quadrant | BADHDUFLAG | Total packets | Discarded packets |
| A | 0 | 238 | 0 |
| B | 0 | 238 | 0 |
| C | 0 | 238 | 0 |
| D | 0 | 238 | 0 |
| Mode M9 | |||
|---|---|---|---|
| Quadrant | BADHDUFLAG | Total packets | Discarded packets |
| A | 0 | 15 | 0 |
| B | 0 | 15 | 0 |
| C | 0 | 15 | 0 |
| D | 0 | 15 | 0 |
| Quadrant | Total seconds | Saturated seconds | Saturation percentage |
|---|---|---|---|
| A | 11625 | 169 | 1.453763% |
| B | 11625 | 262 | 2.253763% |
| C | 11625 | 119 | 1.023656% |
| D | 11625 | 230 | 1.978495% |
Noise dominated data is calculated using 1-second bins in cleaned event files. If a bin has >2000 counts, and if more than 50% of those come from <1% of pixels, then it is considered to be noise-dominated and hence unusable.
| Quadrant | # 1 sec bins | Bins with >0 counts | Bins with >2000 counts | High rate bins dominated by noise | Noise dominated (total time) | Noise dominated (detector-on time) | Marked lightcurve |
|---|---|---|---|---|---|---|---|
| A | 13181 | 11627 | 1 | 1 | 0.01% | 0.01% | 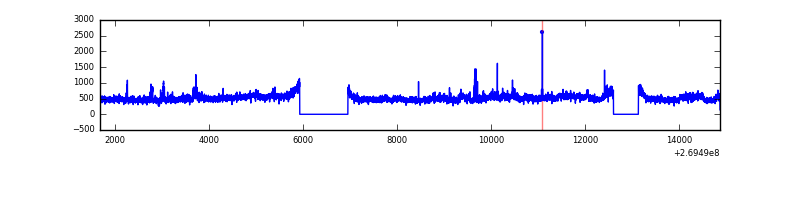 |
| B | 13181 | 11628 | 61 | 61 | 0.46% | 0.52% | 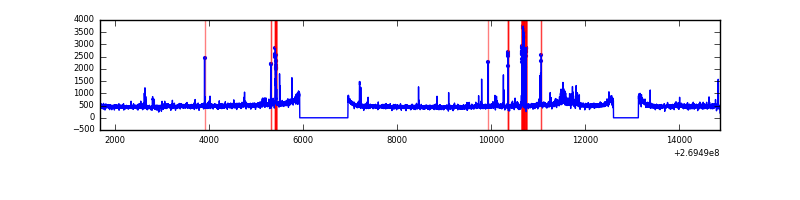 |
| C | 13181 | 11628 | 0 | 0 | 0.00% | 0.00% | 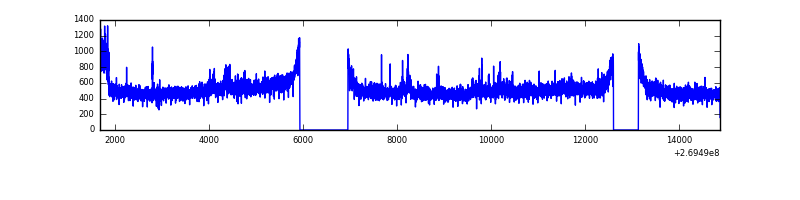 |
| D | 13181 | 11628 | 85 | 85 | 0.64% | 0.73% |  |
Top three noisy pixels from each quadrant. If the there are fewer than three noisy pixels in the level2.evt file, extra rows are filled as -1
| Pixel properties | Quadrant properties | ||||||
|---|---|---|---|---|---|---|---|
| Quadrant | DetID | PixID | Counts | Sigma | Mean | Median | Sigma |
| A | 15 | 239 | 242920 | 841.75 | 1424 | 1392 | 286.9 |
| A | 12 | 189 | 220987 | 765.31 | 1424 | 1392 | 286.9 |
| A | 1 | 162 | 38344 | 128.78 | 1424 | 1392 | 286.9 |
| B | 3 | 64 | 390967 | 1454.05 | 1415 | 1381 | 267.9 |
| B | 12 | 111 | 31969 | 114.16 | 1415 | 1381 | 267.9 |
| B | 11 | 111 | 27673 | 98.13 | 1415 | 1381 | 267.9 |
| C | 3 | 233 | 570436 | 1773.48 | 1387 | 1397 | 320.9 |
| C | 7 | 247 | 12691 | 35.2 | 1387 | 1397 | 320.9 |
| C | 13 | 61 | 9812 | 26.23 | 1387 | 1397 | 320.9 |
| D | 10 | 70 | 239207 | 687.87 | 1397 | 1354 | 345.8 |
| D | 5 | 222 | 51409 | 144.76 | 1397 | 1354 | 345.8 |
| D | 2 | 33 | 45030 | 126.31 | 1397 | 1354 | 345.8 |
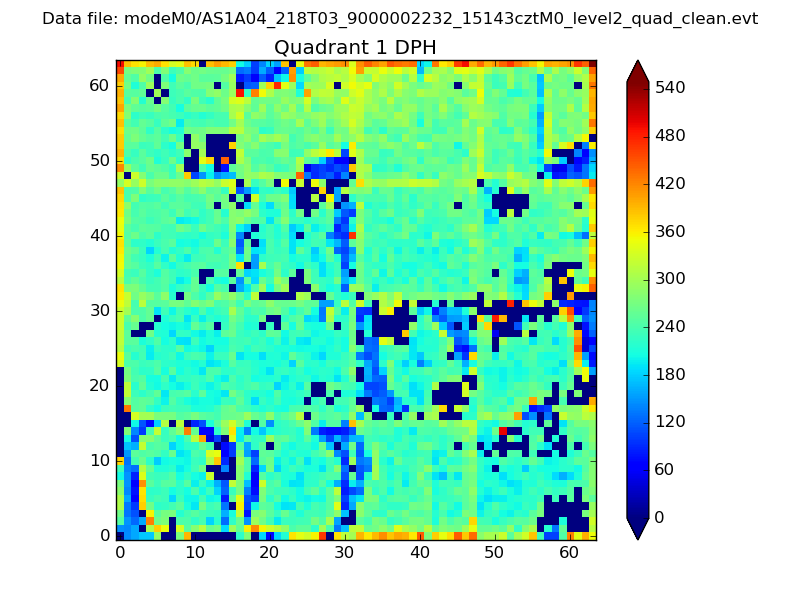
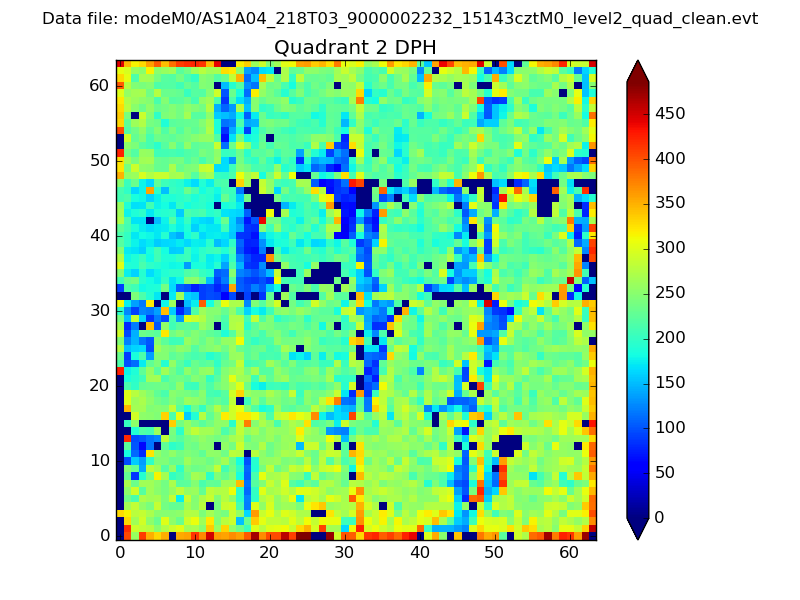
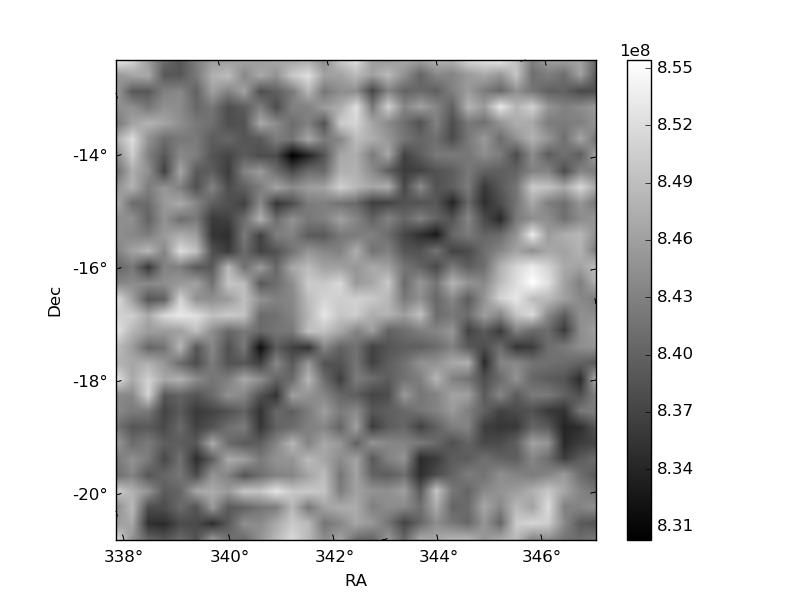
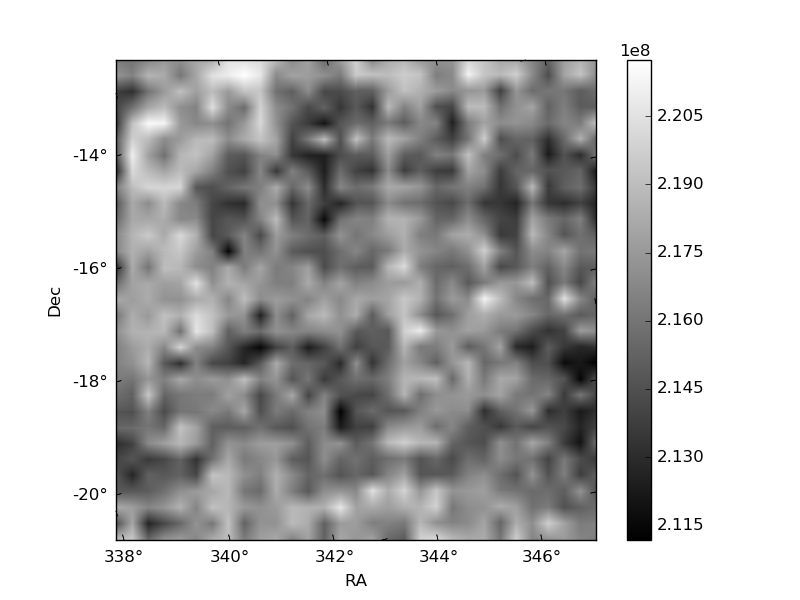
Histogram calculated using DETX and DETY for each event in the final _common_clean file
| Quadrant A | 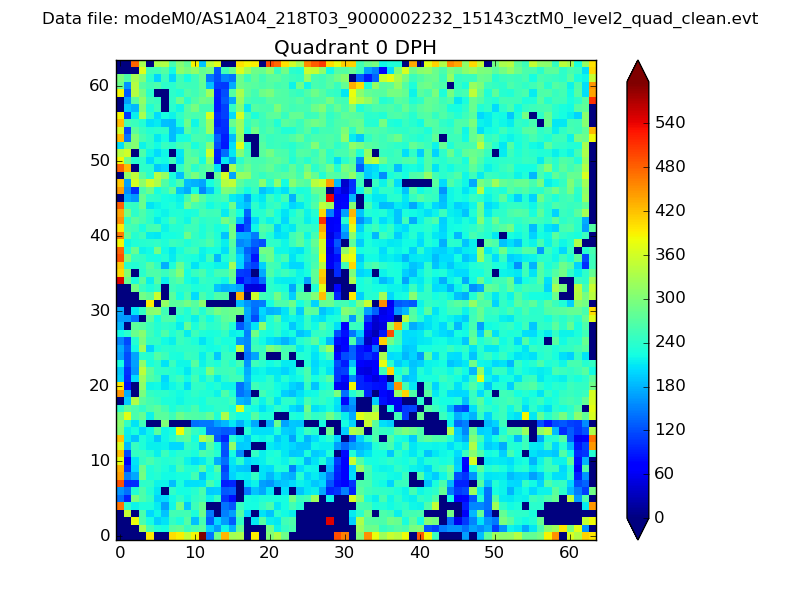 |
 |
Quadrant B |
|---|---|---|---|
| Quadrant D | 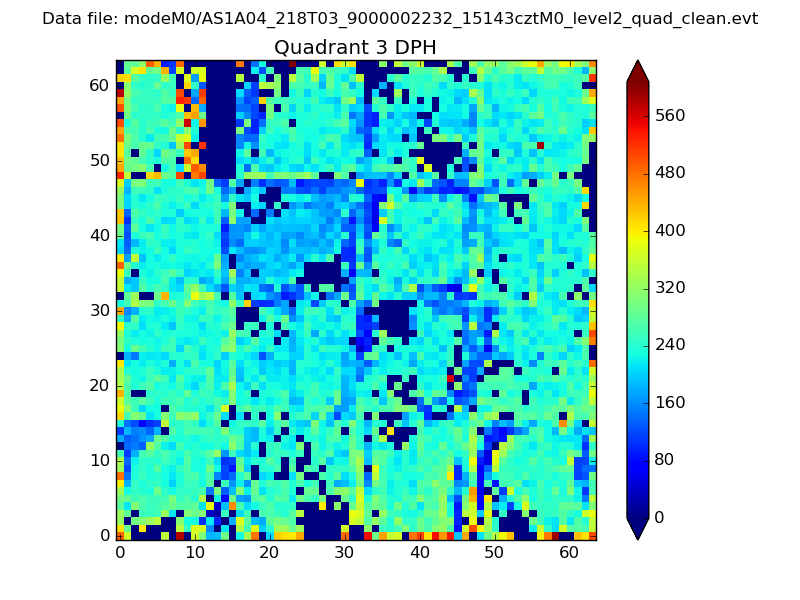 |
 |
Quadrant C |
| Plot type | Count rate plots | Images |
|---|---|---|
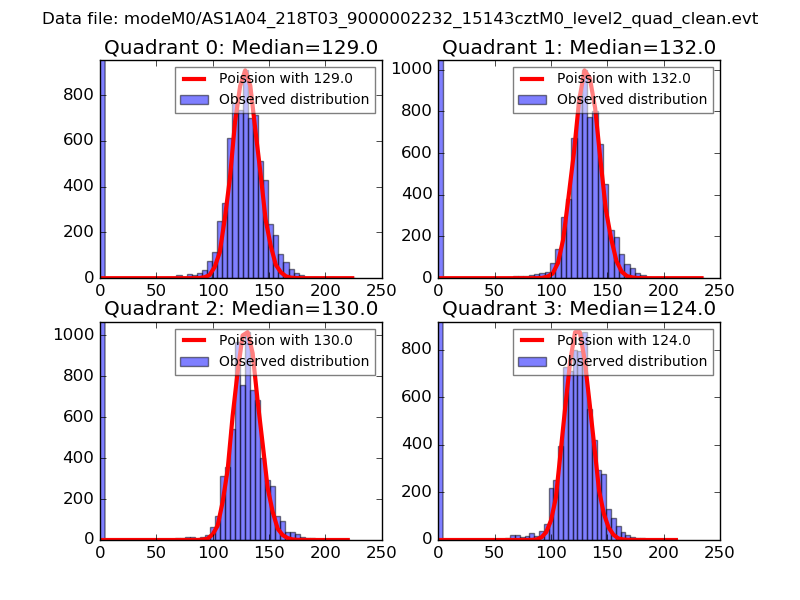
| Comparison with Poisson distribution Blue bars denote a histogram of data divided into 1 sec bins. Red curve is a Poisson curve with rate = median count rate of data. |
 |
 |
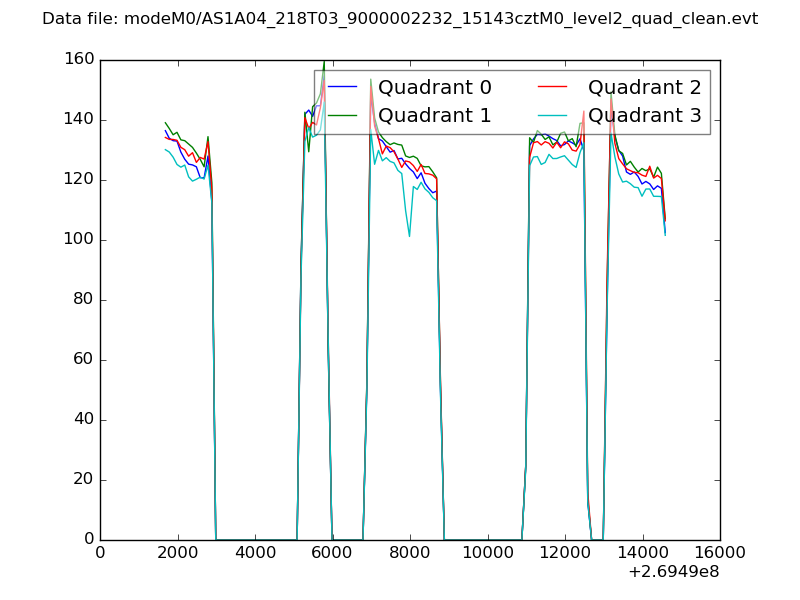
| Quadrant-wise count rates Data is divided into 100 sec bins |
 |
|
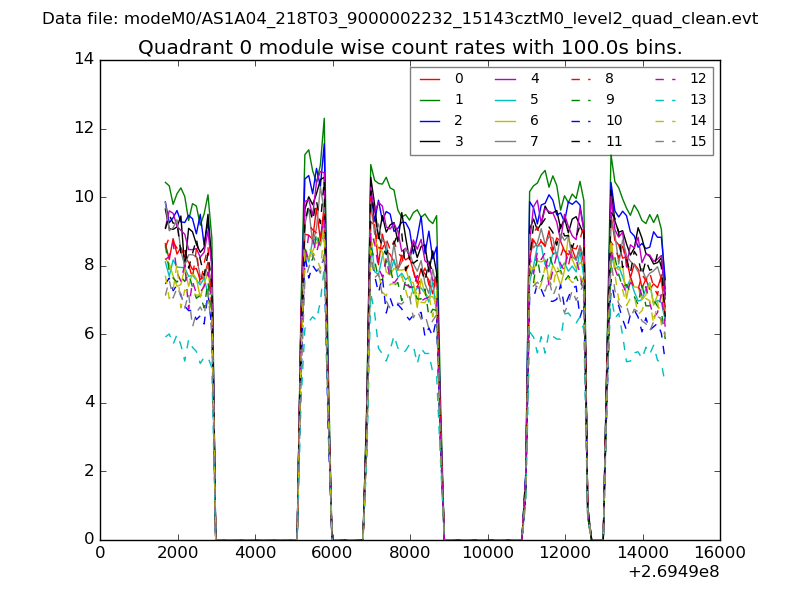
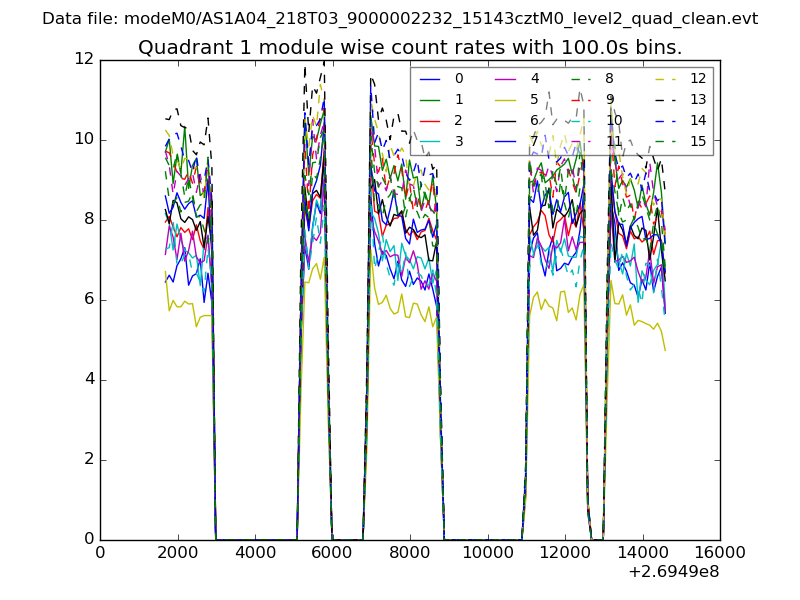
| Module-wise count rates for Quadrant A Data is divided into 100 sec bins |
 |
 |
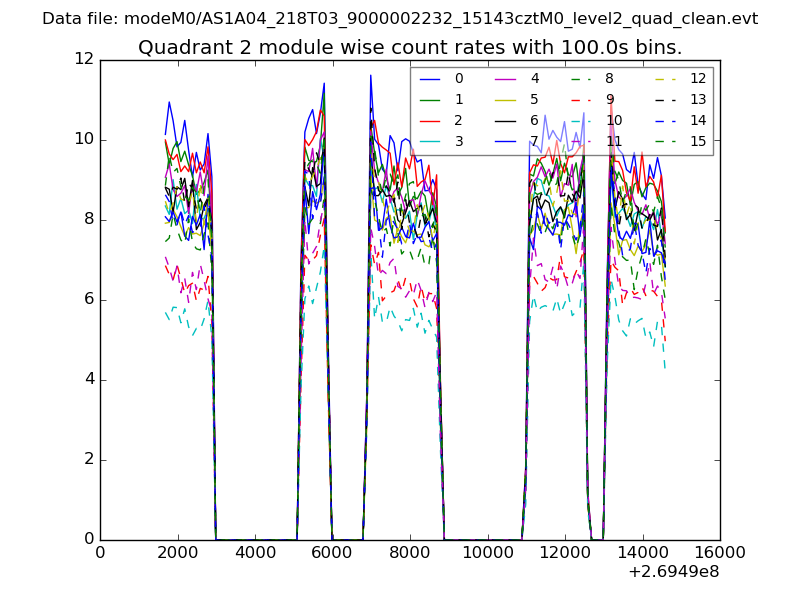
| Module-wise count rates for Quadrant B Data is divided into 100 sec bins |
 |
 |
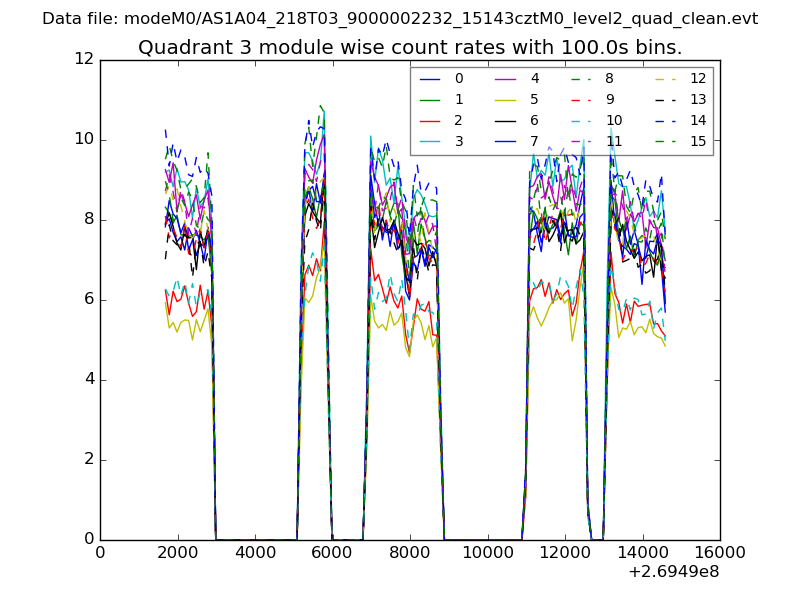
| Module-wise count rates for Quadrant C Data is divided into 100 sec bins |
 |
 |
| Module-wise count rates for Quadrant D Data is divided into 100 sec bins |
 |
 |
| Parameter | Plot |
|---|---|
| CZT HV Monitor | 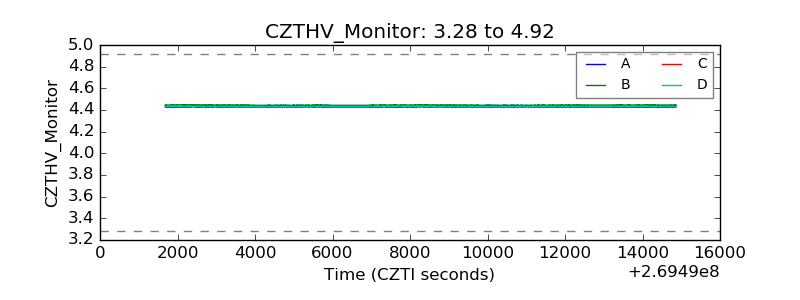 |
| D_VDD | 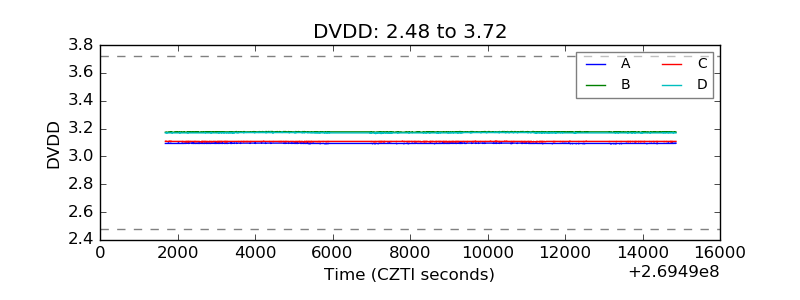 |
| Temperature 1 | 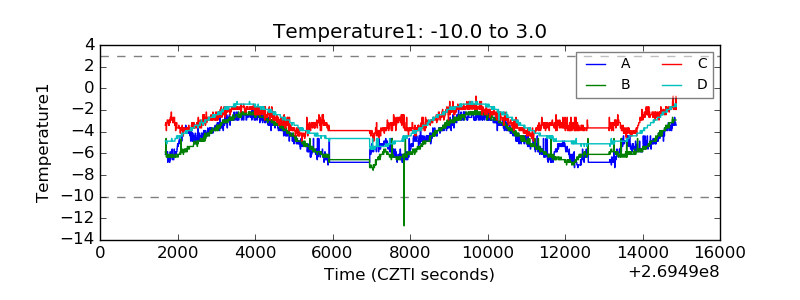 |
| Veto HV Monitor | 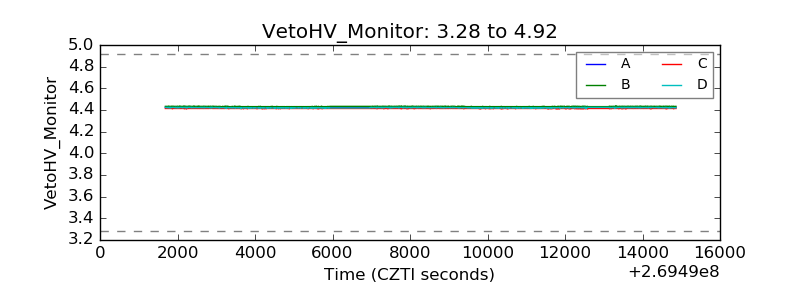 |
| Veto LLD | 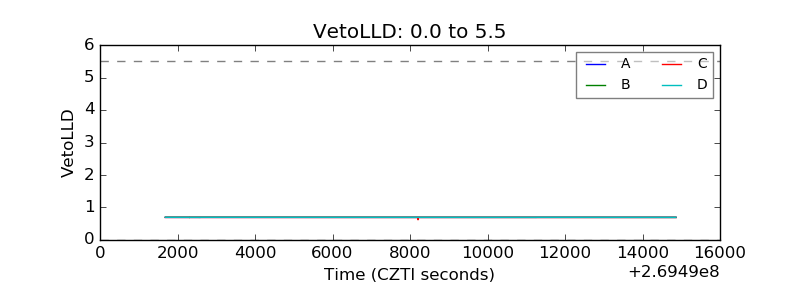 |
| Alpha Counter | 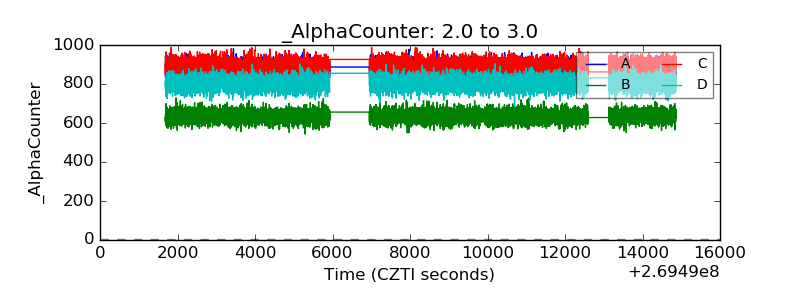 |
| _CPM_Rate | 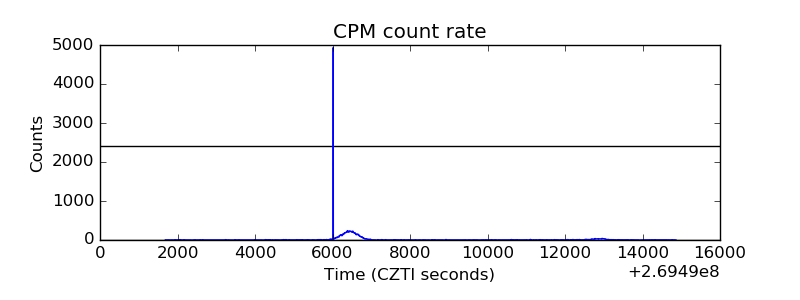 |
| CZT Counter | 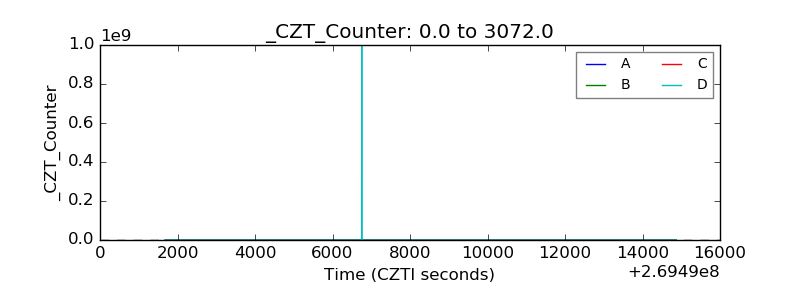 |
| +2.5 Volts monitor |  |
| +5 Volts monitor |  |
| _ROLL_ROT | 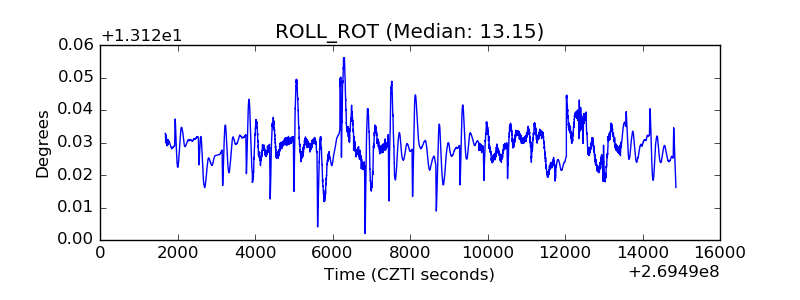 |
| _Roll_DEC | 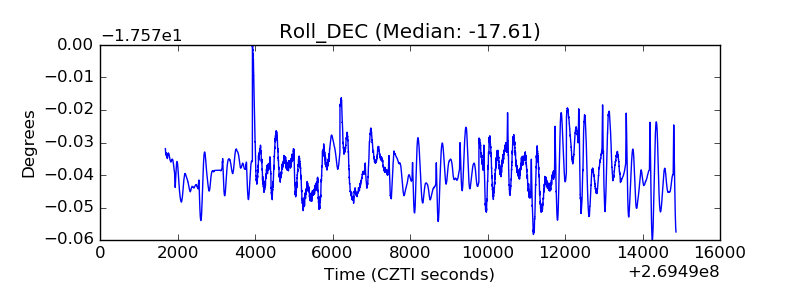 |
| _Roll_RA | 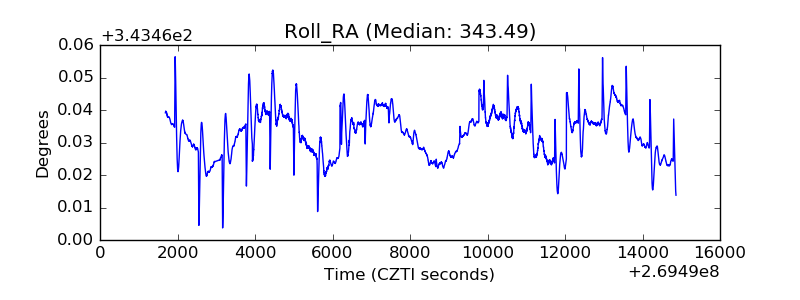 |
| Veto Counter | 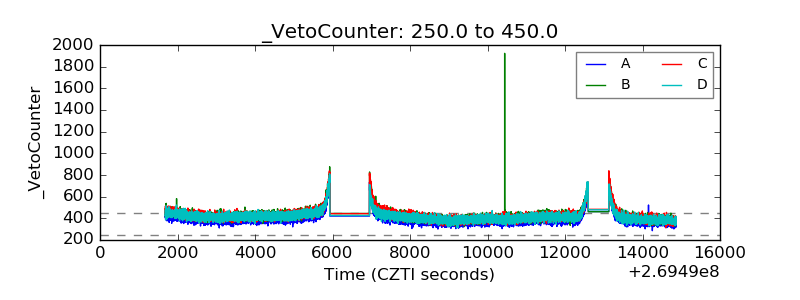 |