| Param | Original file | Final file |
|---|---|---|
| Filename | modeM0/AS1A04_218T03_9000002232_15144cztM0_level2.evt | modeM0/AS1A04_218T03_9000002232_15144cztM0_level2_quad_clean.evt |
| Size (bytes) | 516,150,720 | 90,642,240 |
| Size | 492.2 MB | 86.4 MB |
| Events in quadrant A | 3,892,179 | 556,914 |
| Events in quadrant B | 3,832,104 | 571,339 |
| Events in quadrant C | 3,618,120 | 568,508 |
| Events in quadrant D | 3,791,489 | 537,784 |
| Mode M0 | |||
|---|---|---|---|
| Quadrant | BADHDUFLAG | Total packets | Discarded packets |
| A | 0 | 15992 | 1 |
| B | 0 | 15923 | 0 |
| C | 0 | 15311 | 0 |
| D | 0 | 16290 | 0 |
| Mode SS | |||
|---|---|---|---|
| Quadrant | BADHDUFLAG | Total packets | Discarded packets |
| A | 0 | 146 | 0 |
| B | 0 | 146 | 0 |
| C | 0 | 146 | 0 |
| D | 0 | 146 | 0 |
| Quadrant | Total seconds | Saturated seconds | Saturation percentage |
|---|---|---|---|
| A | 7325 | 313 | 4.273038% |
| B | 7325 | 383 | 5.228669% |
| C | 7325 | 242 | 3.303754% |
| D | 7325 | 387 | 5.283276% |
Noise dominated data is calculated using 1-second bins in cleaned event files. If a bin has >2000 counts, and if more than 50% of those come from <1% of pixels, then it is considered to be noise-dominated and hence unusable.
| Quadrant | # 1 sec bins | Bins with >0 counts | Bins with >2000 counts | High rate bins dominated by noise | Noise dominated (total time) | Noise dominated (detector-on time) | Marked lightcurve |
|---|---|---|---|---|---|---|---|
| A | 7326 | 7326 | 0 | 0 | 0.00% | 0.00% | 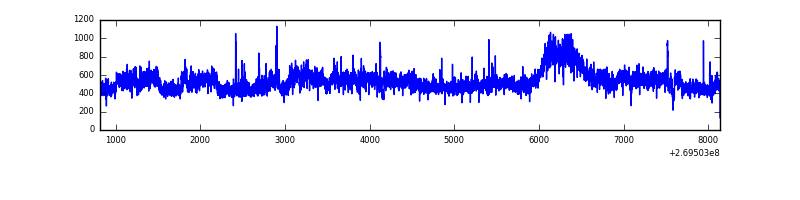 |
| B | 7326 | 7326 | 49 | 49 | 0.67% | 0.67% | 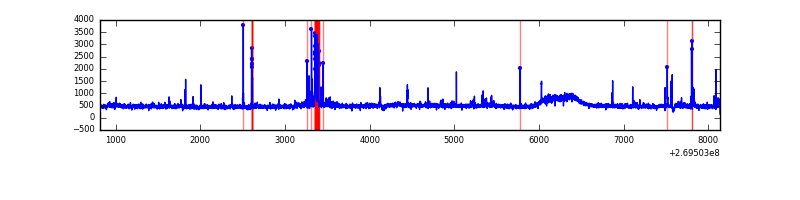 |
| C | 7326 | 7326 | 0 | 0 | 0.00% | 0.00% | 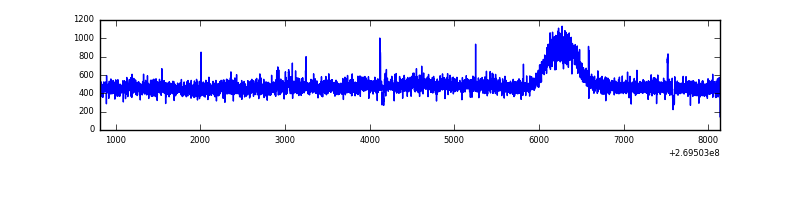 |
| D | 7326 | 7326 | 103 | 103 | 1.41% | 1.41% | 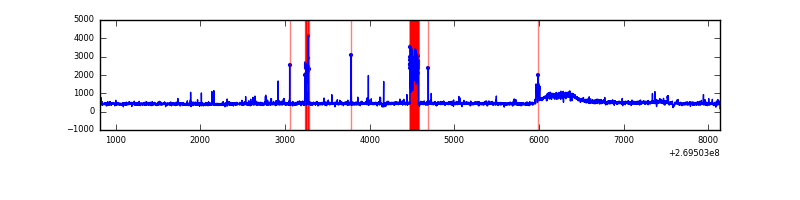 |
Top three noisy pixels from each quadrant. If the there are fewer than three noisy pixels in the level2.evt file, extra rows are filled as -1
| Pixel properties | Quadrant properties | ||||||
|---|---|---|---|---|---|---|---|
| Quadrant | DetID | PixID | Counts | Sigma | Mean | Median | Sigma |
| A | 15 | 239 | 385623 | 2084.16 | 900 | 875 | 184.6 |
| A | 12 | 189 | 20438 | 105.97 | 900 | 875 | 184.6 |
| A | 1 | 162 | 12481 | 62.87 | 900 | 875 | 184.6 |
| B | 3 | 64 | 191889 | 1104.62 | 893 | 868 | 172.9 |
| B | 10 | 246 | 70611 | 403.3 | 893 | 868 | 172.9 |
| B | 12 | 111 | 21205 | 117.6 | 893 | 868 | 172.9 |
| C | 3 | 233 | 178747 | 864.78 | 882 | 885 | 205.7 |
| C | 13 | 61 | 6345 | 26.55 | 882 | 885 | 205.7 |
| C | 7 | 247 | 2613 | 8.4 | 882 | 885 | 205.7 |
| D | 5 | 222 | 226561 | 1043.07 | 881 | 854 | 216.4 |
| D | 7 | 223 | 133078 | 611.05 | 881 | 854 | 216.4 |
| D | 10 | 70 | 70413 | 321.46 | 881 | 854 | 216.4 |
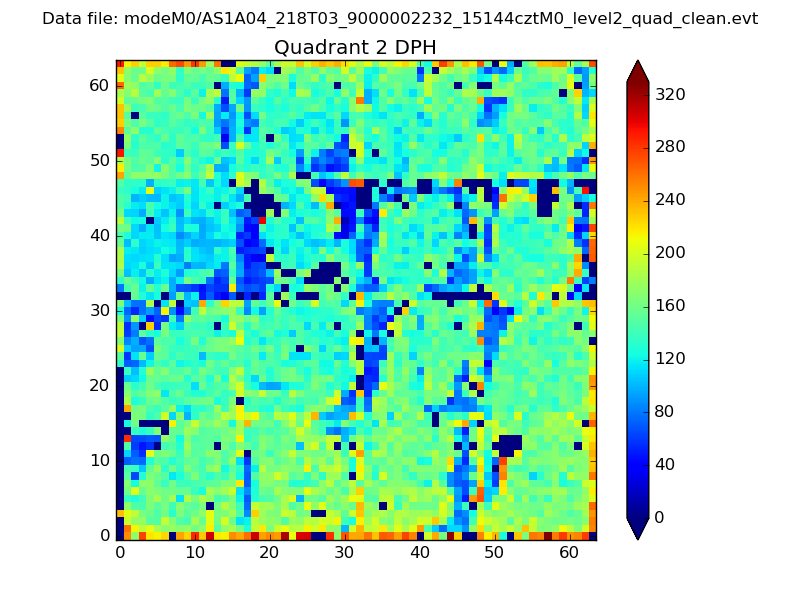
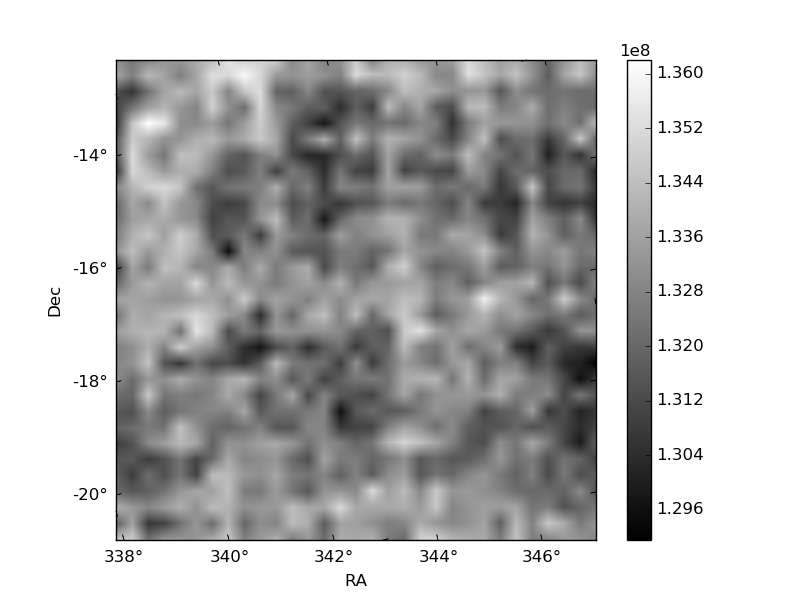
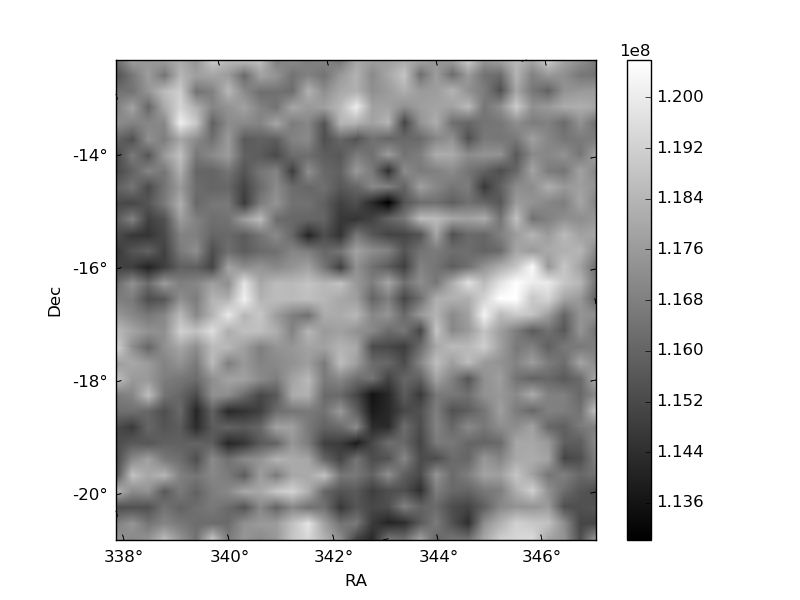
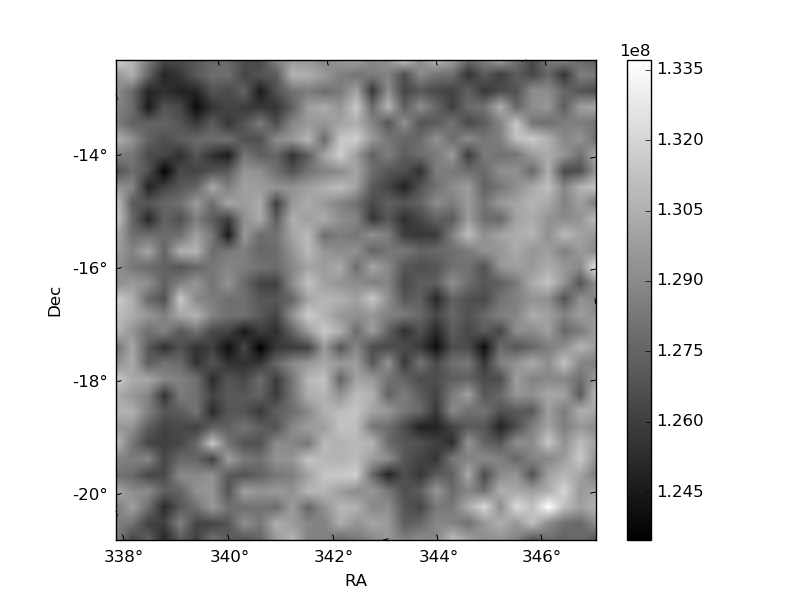
Histogram calculated using DETX and DETY for each event in the final _common_clean file
| Quadrant A |  |
 |
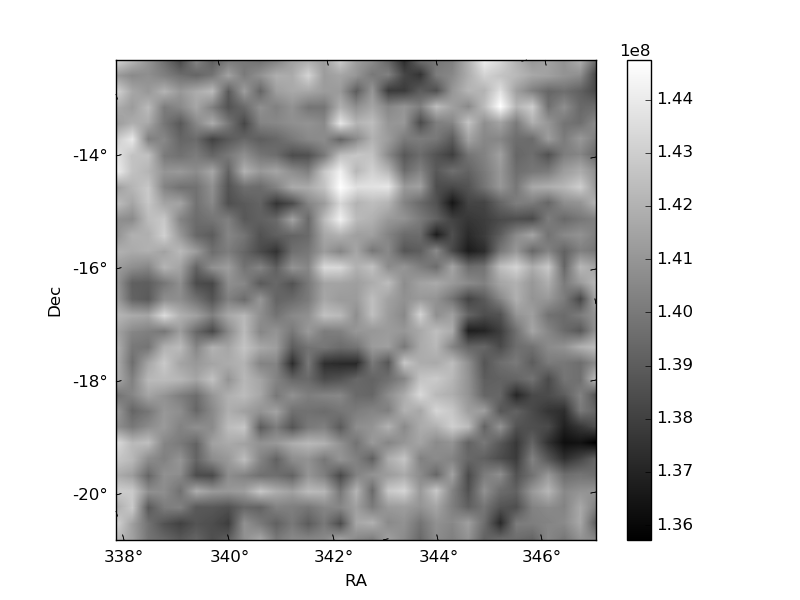
Quadrant B |
|---|---|---|---|
| Quadrant D | 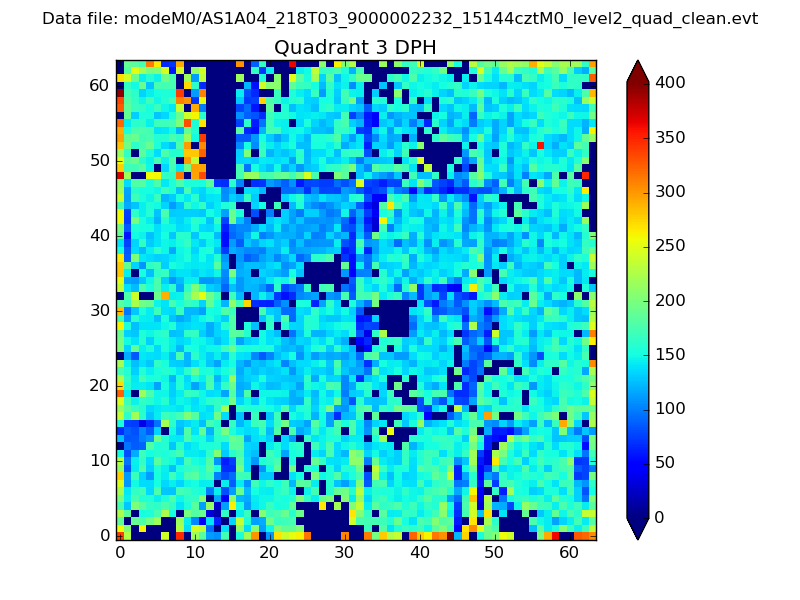 |
 |
Quadrant C |
| Plot type | Count rate plots | Images |
|---|---|---|
| Comparison with Poisson distribution Blue bars denote a histogram of data divided into 1 sec bins. Red curve is a Poisson curve with rate = median count rate of data. |
 |
 |
| Quadrant-wise count rates Data is divided into 100 sec bins |
 |
|
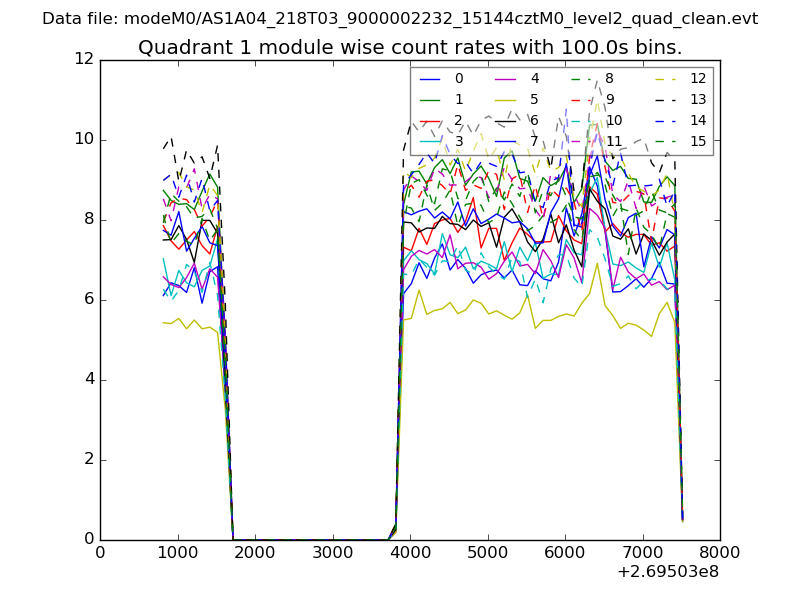
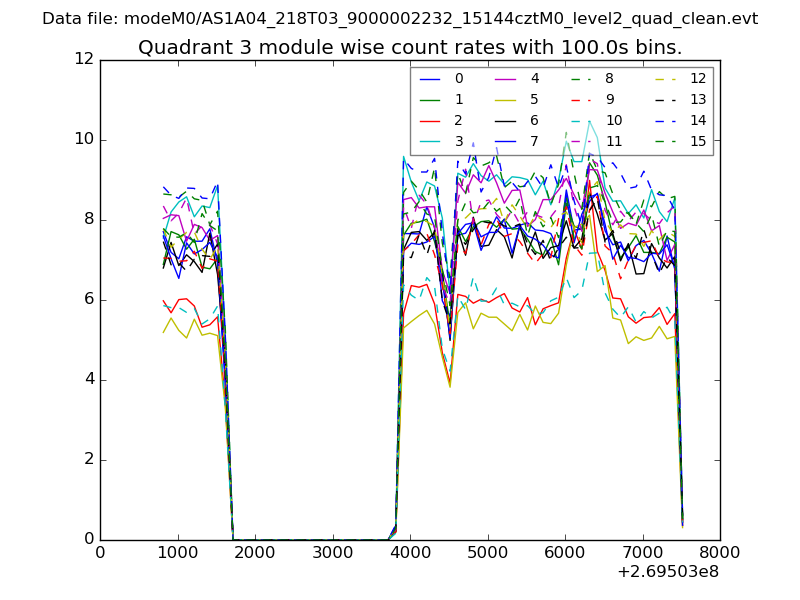
| Module-wise count rates for Quadrant A Data is divided into 100 sec bins |
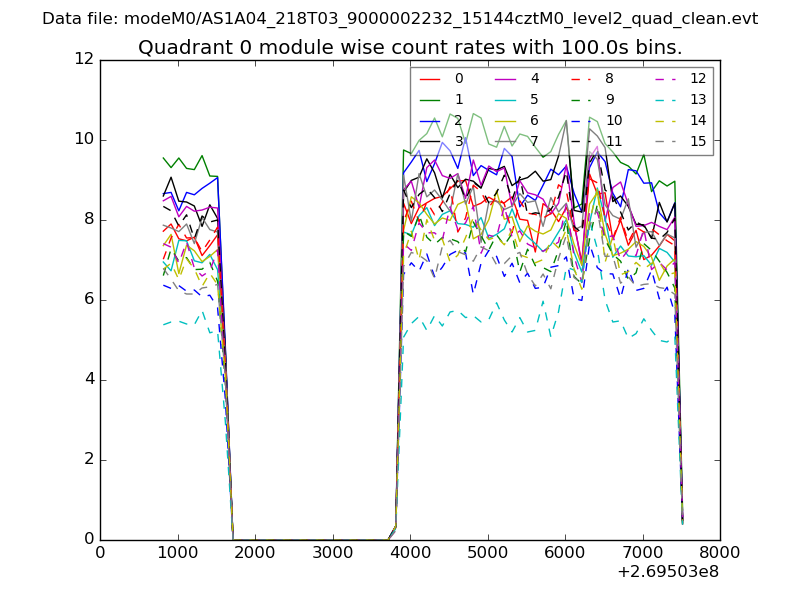 |
 |
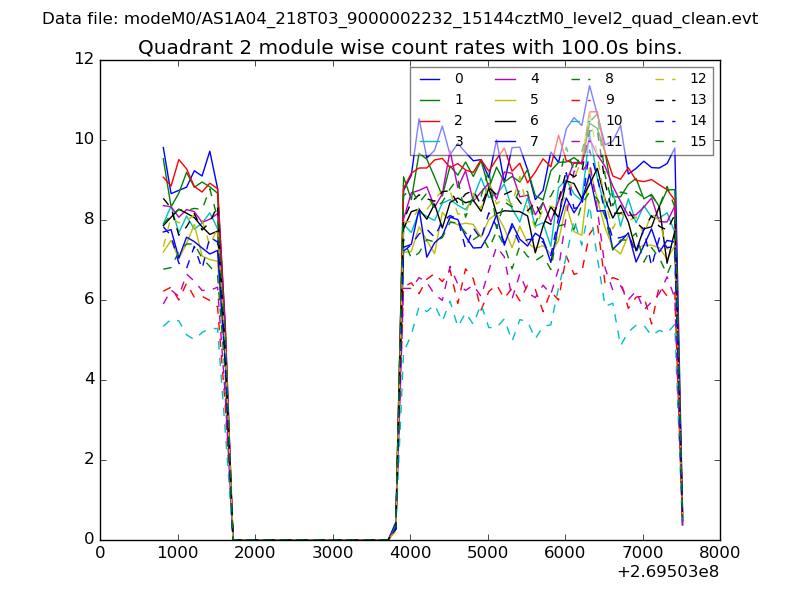
| Module-wise count rates for Quadrant B Data is divided into 100 sec bins |
 |
 |
| Module-wise count rates for Quadrant C Data is divided into 100 sec bins |
 |
 |
| Module-wise count rates for Quadrant D Data is divided into 100 sec bins |
 |
 |
| Parameter | Plot |
|---|---|
| CZT HV Monitor | 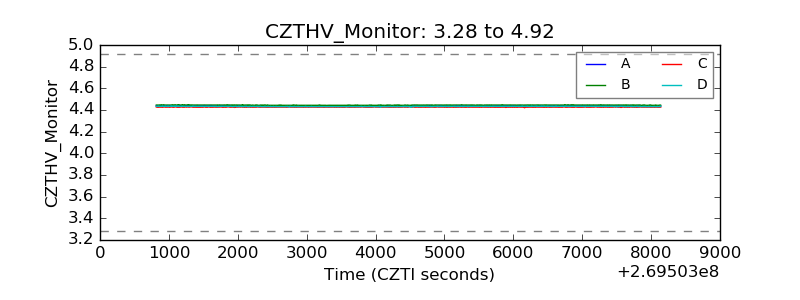 |
| D_VDD | 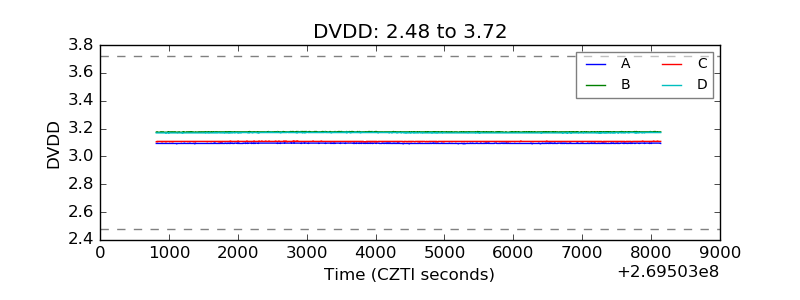 |
| Temperature 1 |  |
| Veto HV Monitor | 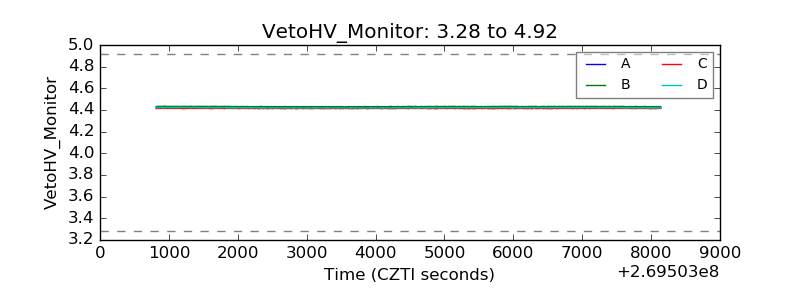 |
| Veto LLD |  |
| Alpha Counter | 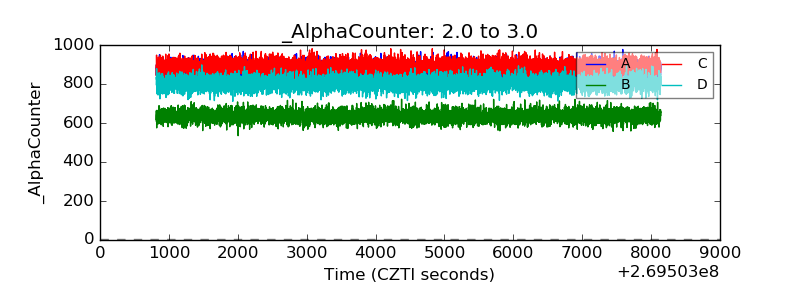 |
| _CPM_Rate |  |
| CZT Counter | 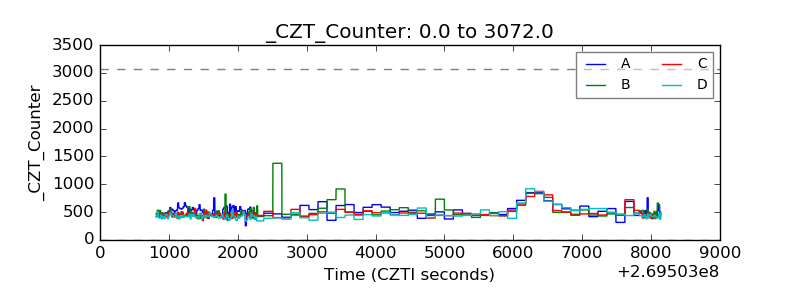 |
| +2.5 Volts monitor |  |
| +5 Volts monitor | 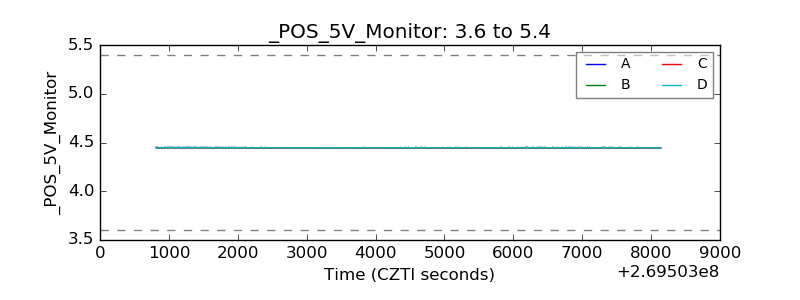 |
| _ROLL_ROT | 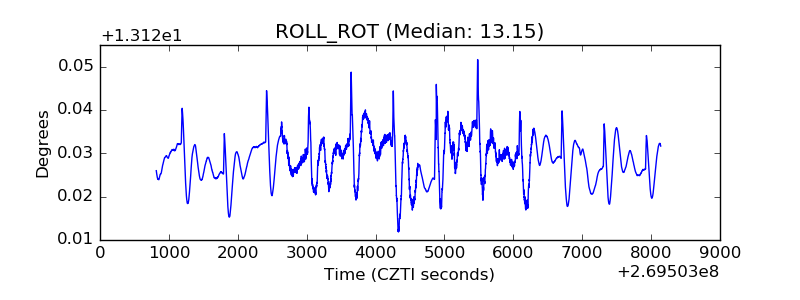 |
| _Roll_DEC | 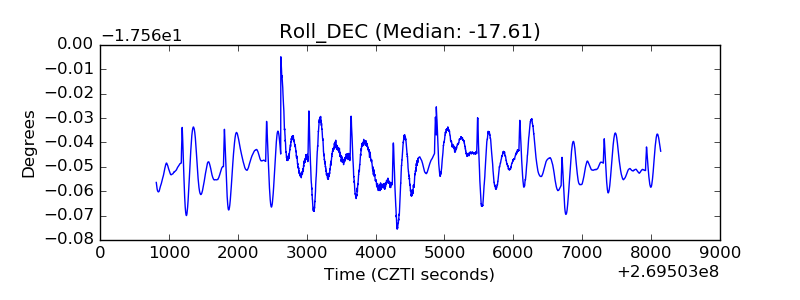 |
| _Roll_RA | 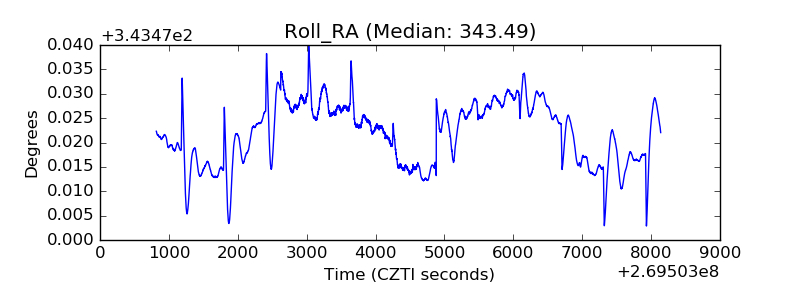 |
| Veto Counter | 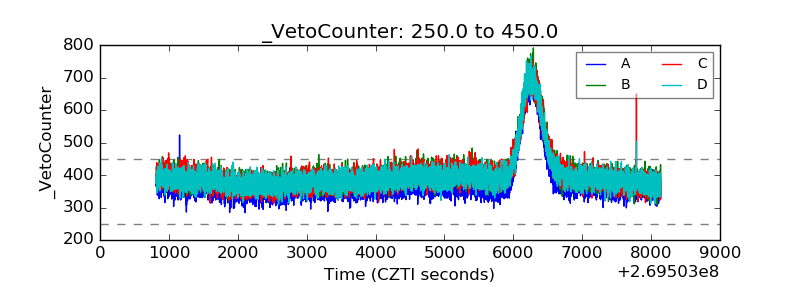 |