| Param | Original file | Final file |
|---|---|---|
| Filename | modeM0/AS1A04_218T03_9000002232_15148cztM0_level2.evt | modeM0/AS1A04_218T03_9000002232_15148cztM0_level2_quad_clean.evt |
| Size (bytes) | 287,256,960 | 26,432,640 |
| Size | 273.9 MB | 25.2 MB |
| Events in quadrant A | 2,146,860 | 142,277 |
| Events in quadrant B | 2,884,780 | 134,160 |
| Events in quadrant C | 1,656,653 | 141,794 |
| Events in quadrant D | 1,778,070 | 139,331 |
| Mode M0 | |||
|---|---|---|---|
| Quadrant | BADHDUFLAG | Total packets | Discarded packets |
| A | 0 | 8668 | 1 |
| B | 0 | 10754 | 1 |
| C | 0 | 7063 | 1 |
| D | 0 | 7538 | 1 |
| Mode SS | |||
|---|---|---|---|
| Quadrant | BADHDUFLAG | Total packets | Discarded packets |
| A | 0 | 70 | 0 |
| B | 0 | 70 | 0 |
| C | 0 | 70 | 0 |
| D | 0 | 70 | 0 |
| Mode M9 | |||
|---|---|---|---|
| Quadrant | BADHDUFLAG | Total packets | Discarded packets |
| A | 0 | 4 | 0 |
| B | 0 | 4 | 0 |
| C | 0 | 4 | 0 |
| D | 0 | 4 | 0 |
| Quadrant | Total seconds | Saturated seconds | Saturation percentage |
|---|---|---|---|
| A | 3413 | 84 | 2.461178% |
| B | 3413 | 613 | 17.960738% |
| C | 3413 | 52 | 1.523586% |
| D | 3413 | 83 | 2.431878% |
Noise dominated data is calculated using 1-second bins in cleaned event files. If a bin has >2000 counts, and if more than 50% of those come from <1% of pixels, then it is considered to be noise-dominated and hence unusable.
| Quadrant | # 1 sec bins | Bins with >0 counts | Bins with >2000 counts | High rate bins dominated by noise | Noise dominated (total time) | Noise dominated (detector-on time) | Marked lightcurve |
|---|---|---|---|---|---|---|---|
| A | 3779 | 3414 | 0 | 0 | 0.00% | 0.00% | 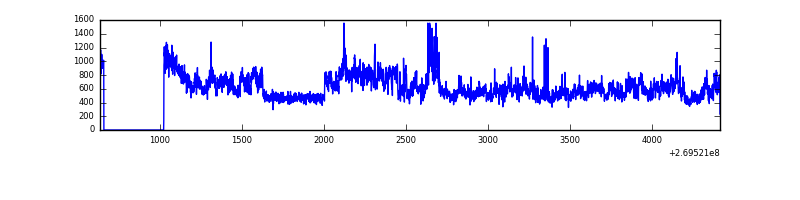 |
| B | 3779 | 3414 | 510 | 510 | 13.50% | 14.94% | 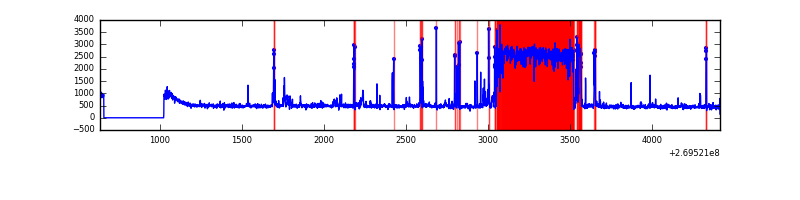 |
| C | 3779 | 3414 | 0 | 0 | 0.00% | 0.00% | 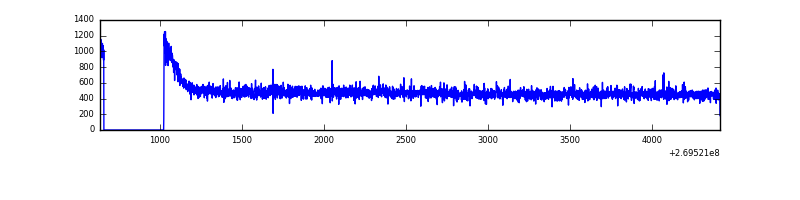 |
| D | 3779 | 3414 | 28 | 28 | 0.74% | 0.82% | 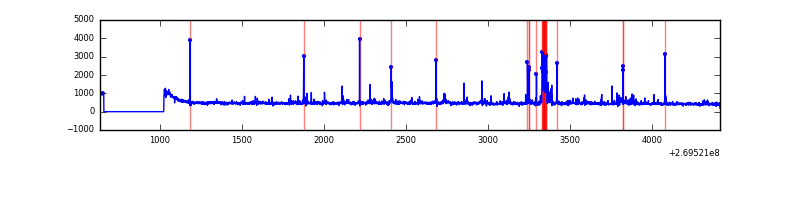 |
Top three noisy pixels from each quadrant. If the there are fewer than three noisy pixels in the level2.evt file, extra rows are filled as -1
| Pixel properties | Quadrant properties | ||||||
|---|---|---|---|---|---|---|---|
| Quadrant | DetID | PixID | Counts | Sigma | Mean | Median | Sigma |
| A | 15 | 239 | 514161 | 5931.26 | 412 | 401 | 86.6 |
| A | 12 | 189 | 37741 | 431.08 | 412 | 401 | 86.6 |
| A | 13 | 248 | 9246 | 102.11 | 412 | 401 | 86.6 |
| B | 3 | 64 | 1337383 | 18201.64 | 370 | 361 | 73.5 |
| B | 4 | 48 | 28313 | 380.53 | 370 | 361 | 73.5 |
| B | 4 | 80 | 22124 | 296.27 | 370 | 361 | 73.5 |
| C | 3 | 233 | 103173 | 1083.57 | 398 | 399 | 94.8 |
| C | 13 | 61 | 2975 | 27.16 | 398 | 399 | 94.8 |
| C | 7 | 247 | 1101 | 7.4 | 398 | 399 | 94.8 |
| D | 2 | 33 | 100975 | 989.94 | 402 | 389 | 101.6 |
| D | 2 | 16 | 68986 | 675.12 | 402 | 389 | 101.6 |
| D | 10 | 70 | 38818 | 378.21 | 402 | 389 | 101.6 |
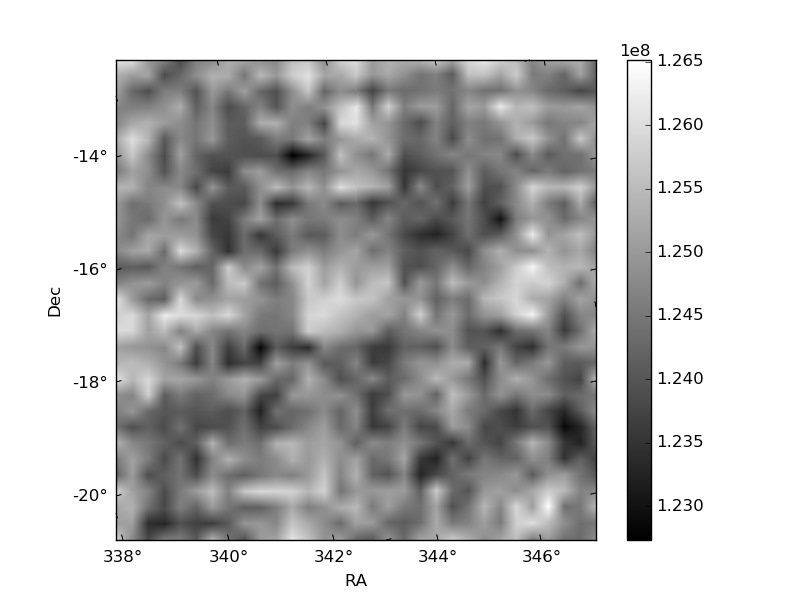
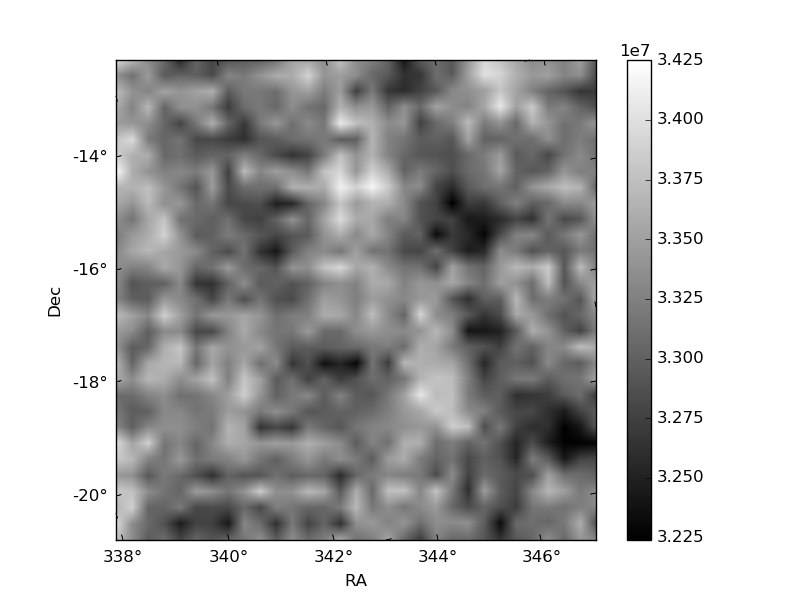
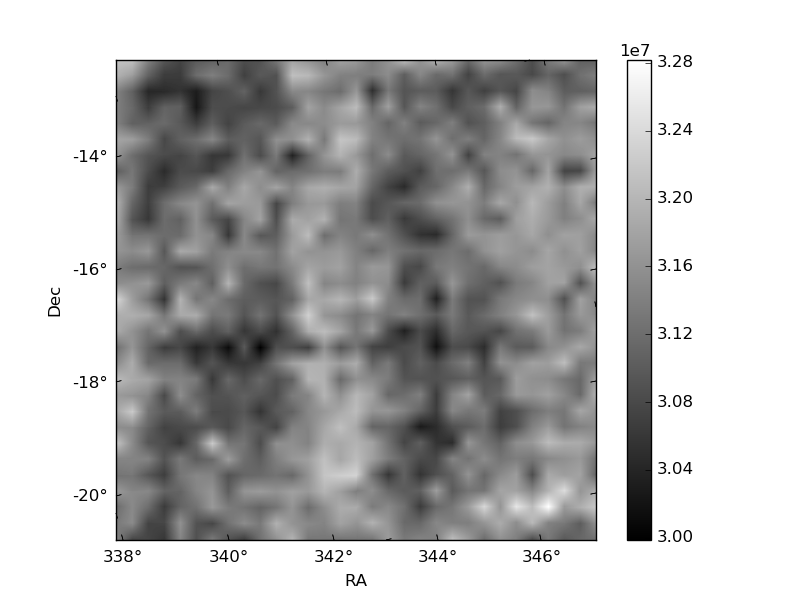
Histogram calculated using DETX and DETY for each event in the final _common_clean file
| Quadrant A | 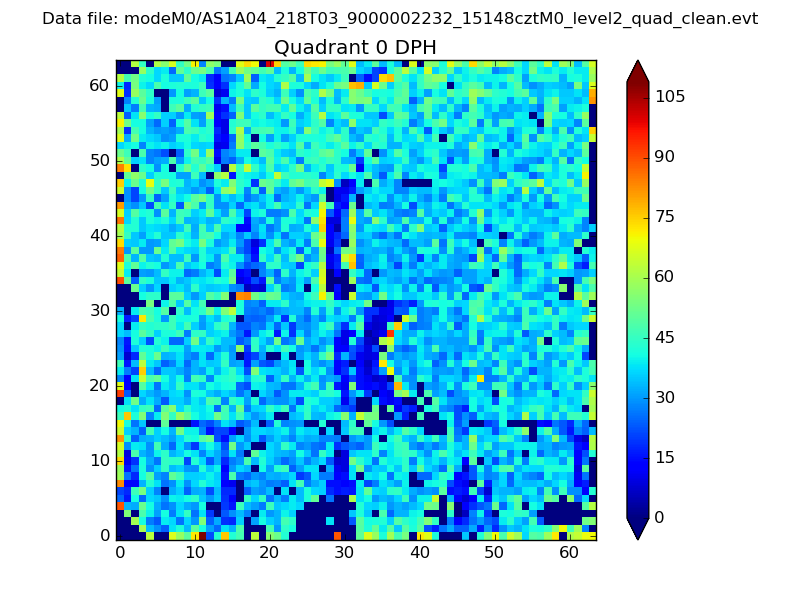 |
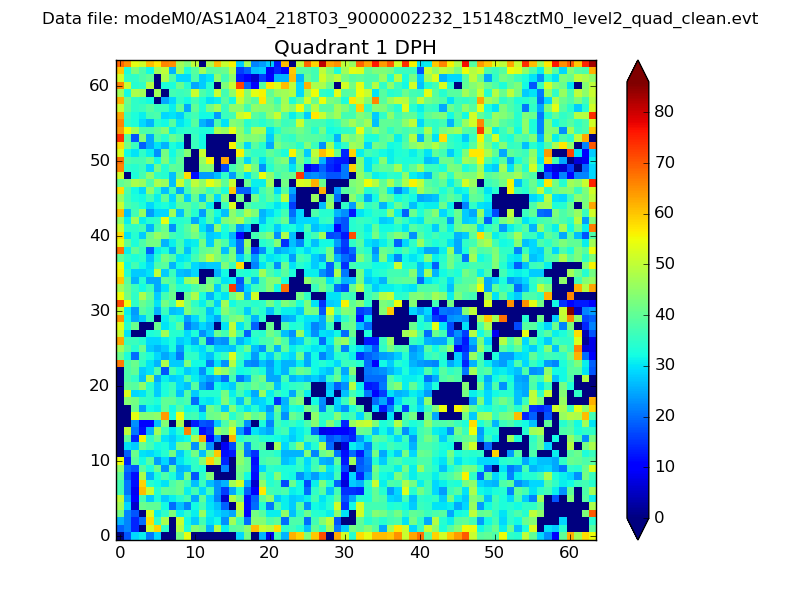 |
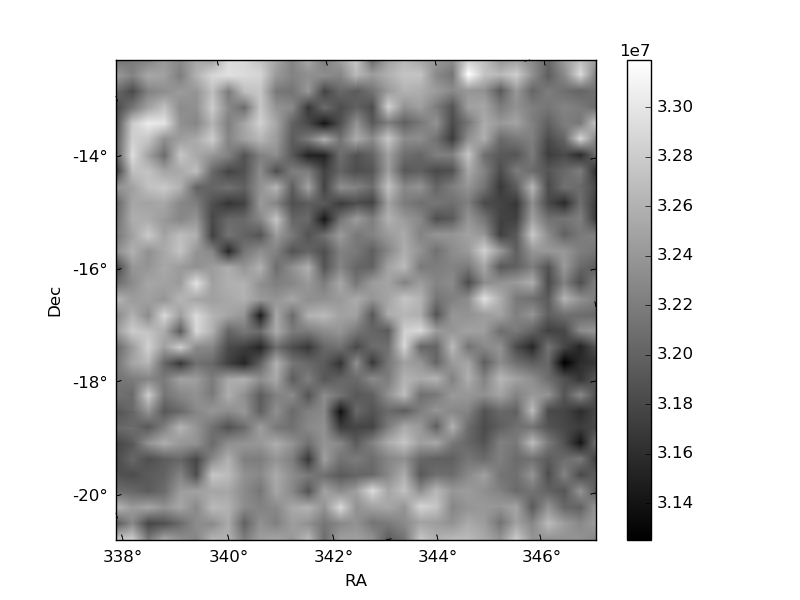
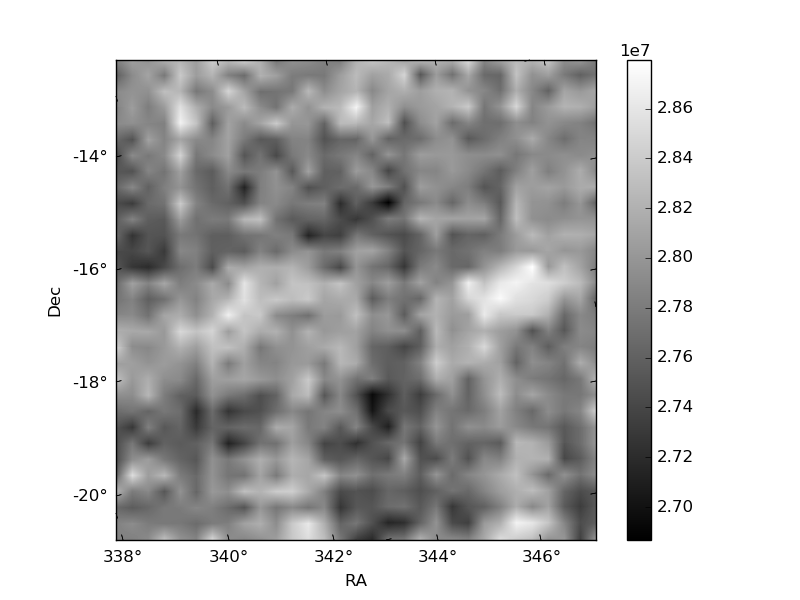
Quadrant B |
|---|---|---|---|
| Quadrant D | 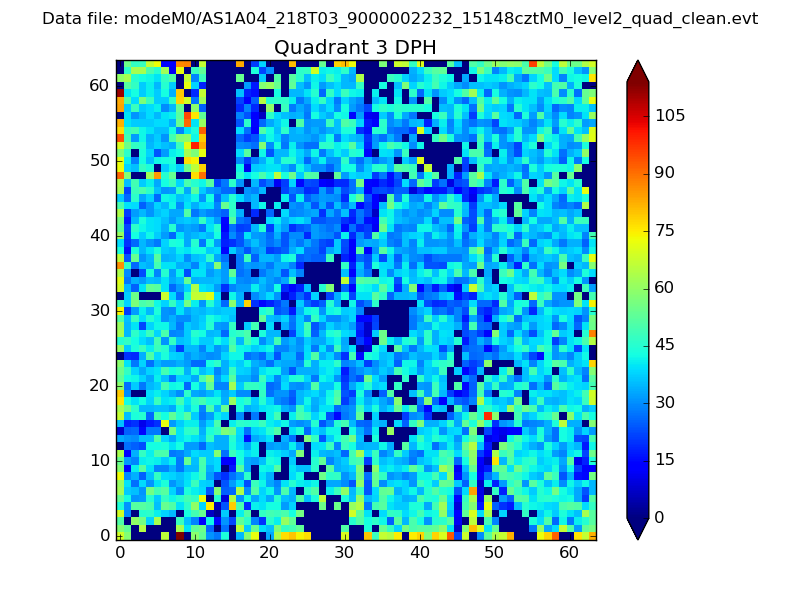 |
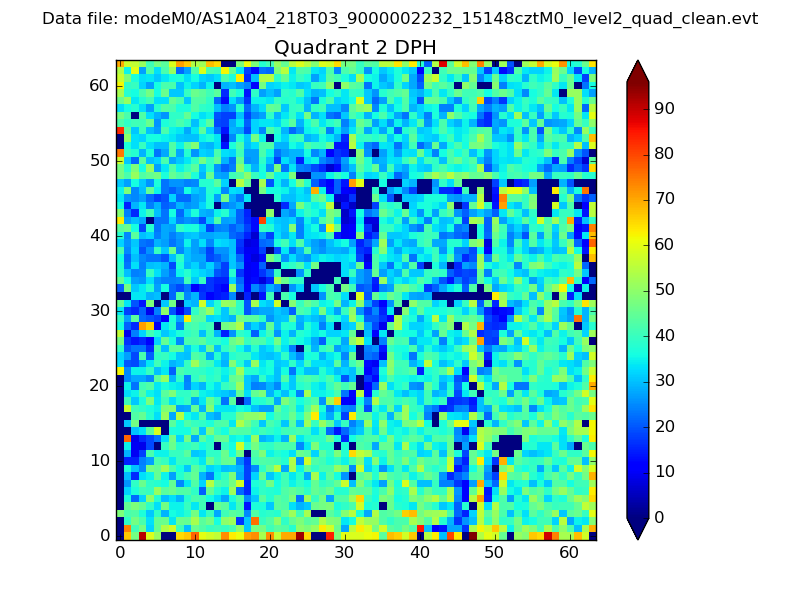 |
Quadrant C |
| Plot type | Count rate plots | Images |
|---|---|---|
| Comparison with Poisson distribution Blue bars denote a histogram of data divided into 1 sec bins. Red curve is a Poisson curve with rate = median count rate of data. |
 |
 |
| Quadrant-wise count rates Data is divided into 100 sec bins |
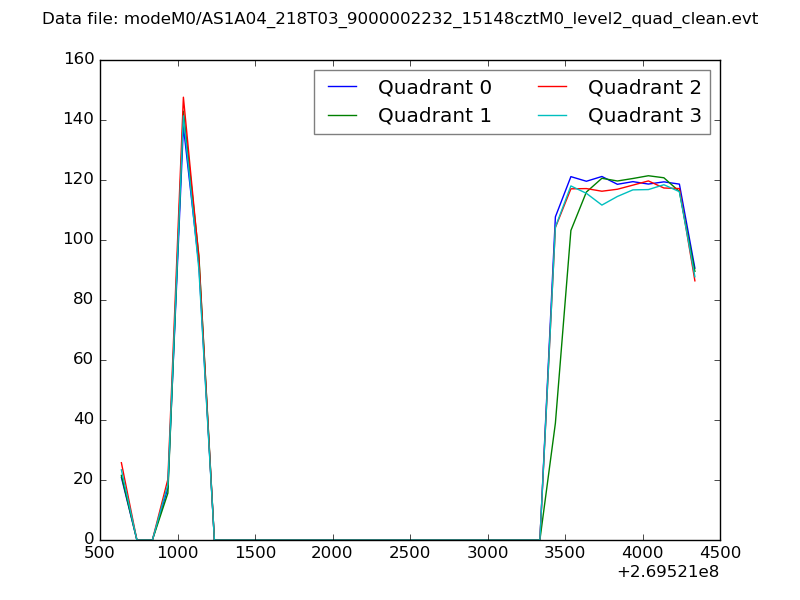 |
|
| Module-wise count rates for Quadrant A Data is divided into 100 sec bins |
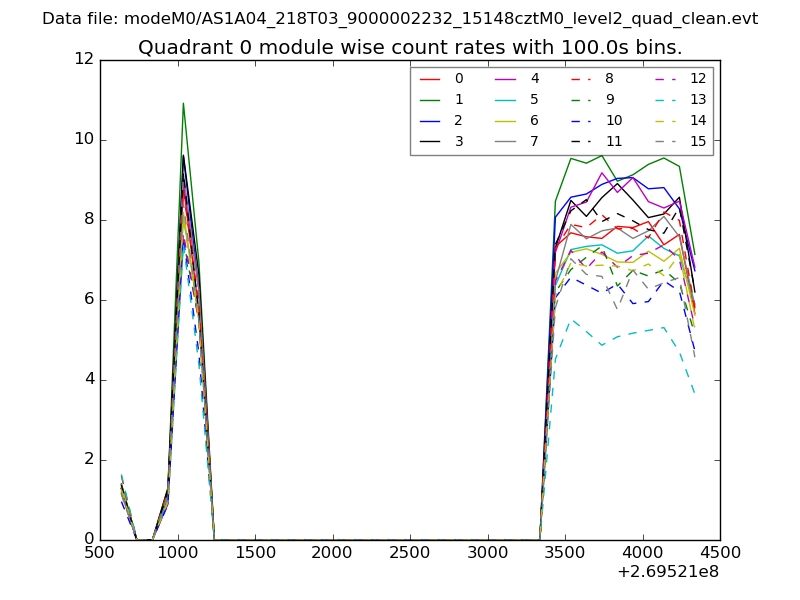 |
 |
| Module-wise count rates for Quadrant B Data is divided into 100 sec bins |
 |
 |
| Module-wise count rates for Quadrant C Data is divided into 100 sec bins |
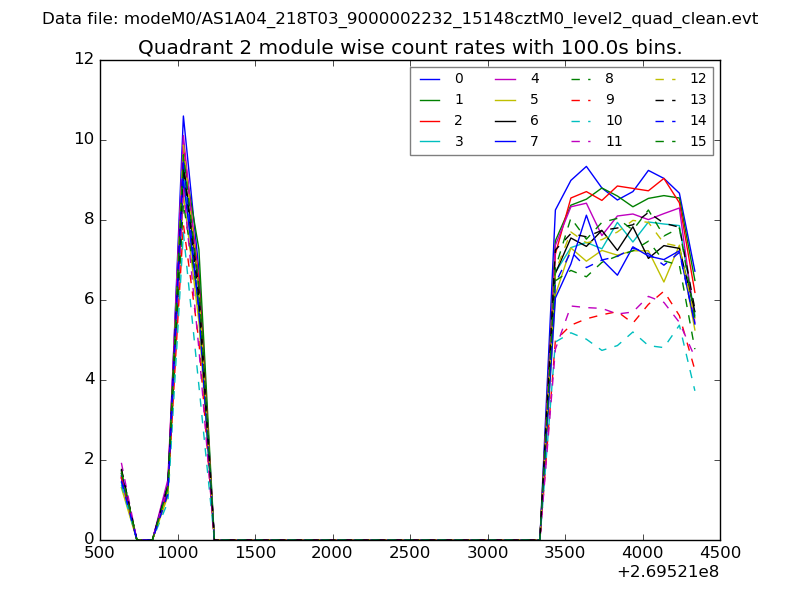 |
 |
| Module-wise count rates for Quadrant D Data is divided into 100 sec bins |
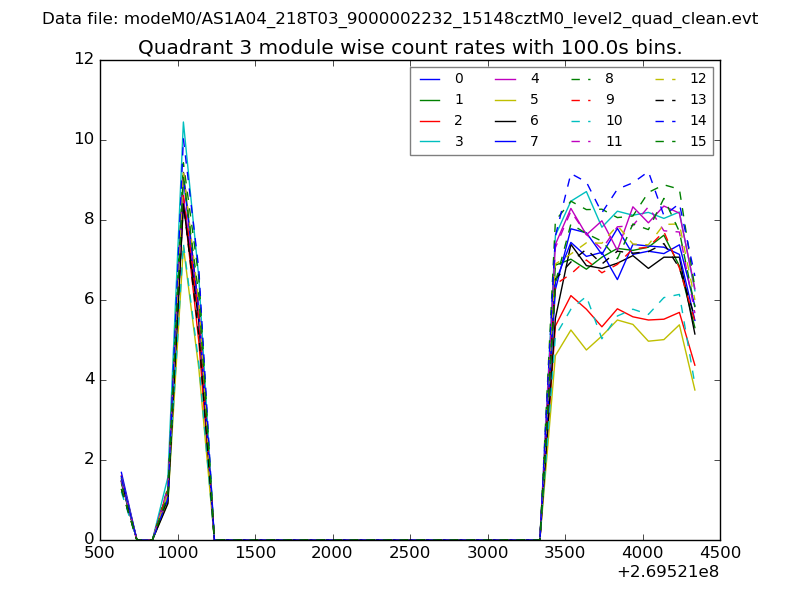 |
 |
| Parameter | Plot |
|---|---|
| CZT HV Monitor | 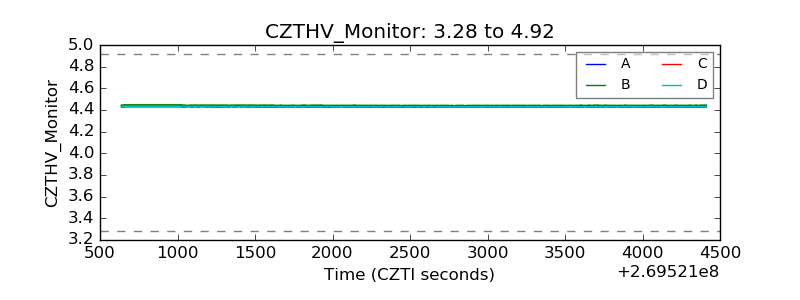 |
| D_VDD | 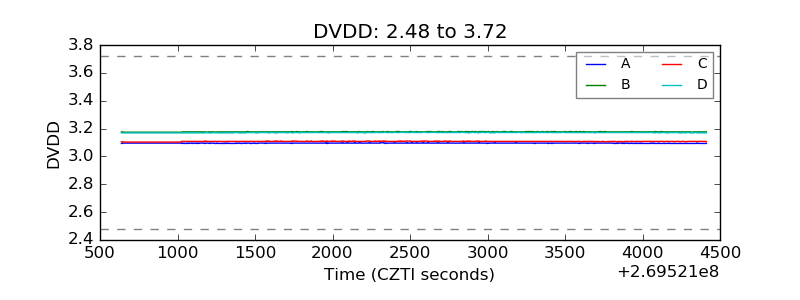 |
| Temperature 1 | 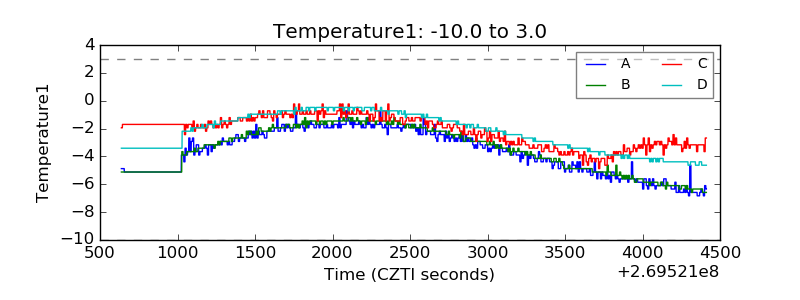 |
| Veto HV Monitor | 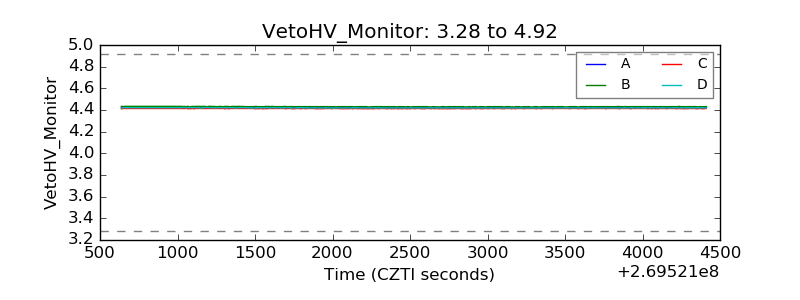 |
| Veto LLD | 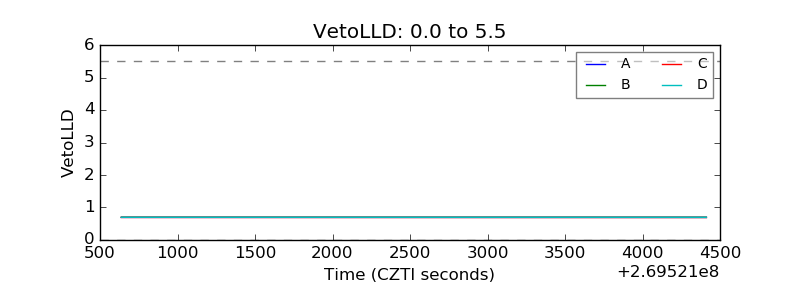 |
| Alpha Counter | 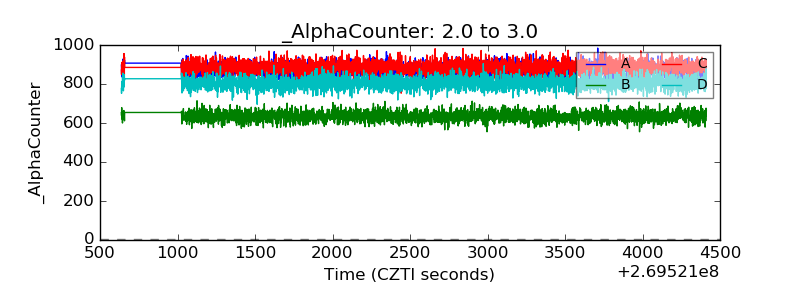 |
| _CPM_Rate | 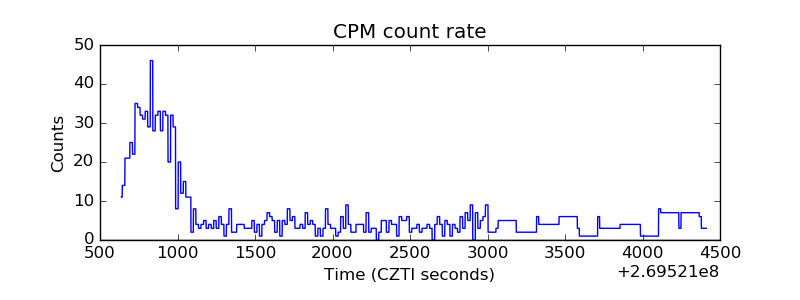 |
| CZT Counter | 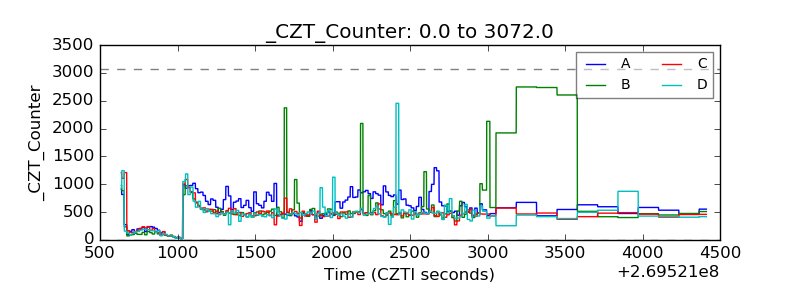 |
| +2.5 Volts monitor |  |
| +5 Volts monitor |  |
| _ROLL_ROT | 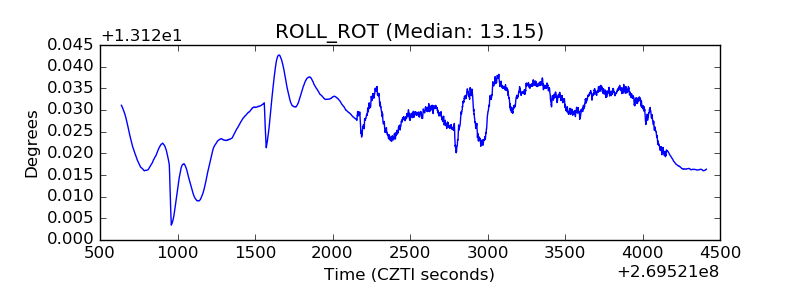 |
| _Roll_DEC | 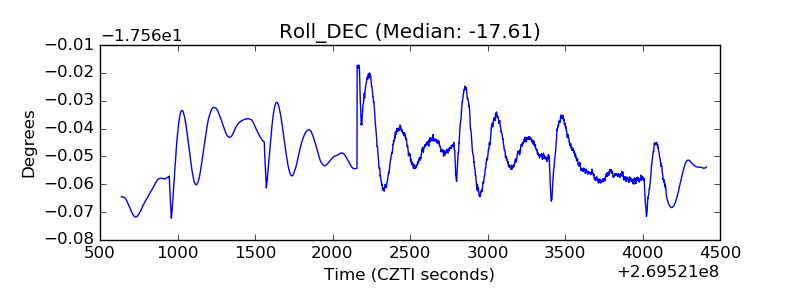 |
| _Roll_RA | 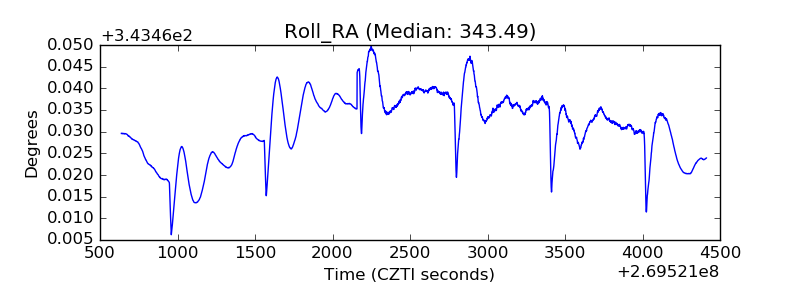 |
| Veto Counter | 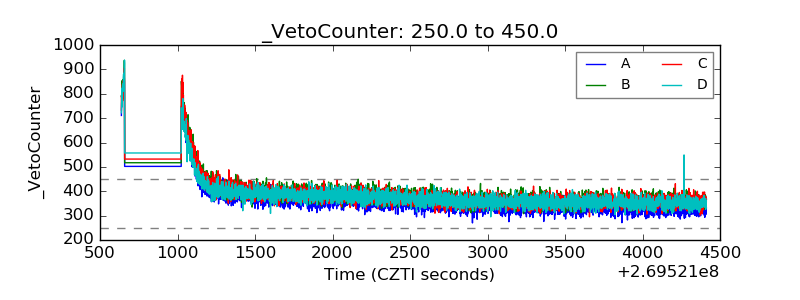 |