| Param | Original file | Final file |
|---|---|---|
| Filename | modeM0/AS1C03_015T03_9000002230cztM0_level2.fits | modeM0/AS1C03_015T03_9000002230cztM0_level2_quad_clean.evt |
| Size (bytes) | 60,782,400 | 72,760,320 |
| Size | 58.0 MB | 69.4 MB |
| Events in quadrant A | 359,974 | 451,257 |
| Events in quadrant B | 350,980 | 451,486 |
| Events in quadrant C | 355,794 | 430,374 |
| Events in quadrant D | 307,460 | 402,823 |
| Mode M9 | |||
|---|---|---|---|
| Quadrant | BADHDUFLAG | Total packets | Discarded packets |
| A | 0 | 9 | 0 |
| B | 0 | 9 | 0 |
| C | 0 | 9 | 0 |
| D | 0 | 9 | 0 |
| Mode SS | |||
|---|---|---|---|
| Quadrant | BADHDUFLAG | Total packets | Discarded packets |
| A | 0 | 138 | 0 |
| B | 0 | 138 | 0 |
| C | 0 | 138 | 0 |
| D | 0 | 138 | 0 |
| Mode M0 | |||
|---|---|---|---|
| Quadrant | BADHDUFLAG | Total packets | Discarded packets |
| A | 0 | 13852 | 0 |
| B | 0 | 14158 | 0 |
| C | 0 | 14982 | 0 |
| D | 0 | 14121 | 0 |
| Quadrant | Total seconds | Saturated seconds | Saturation percentage |
|---|---|---|---|
| A | 6699 | 75 | 1.119570% |
| B | 6699 | 80 | 1.194208% |
| C | 6699 | 72 | 1.074787% |
| D | 6699 | 111 | 1.656964% |
Noise dominated data is calculated using 1-second bins in cleaned event files. If a bin has >2000 counts, and if more than 50% of those come from <1% of pixels, then it is considered to be noise-dominated and hence unusable.
| Quadrant | # 1 sec bins | Bins with >0 counts | Bins with >2000 counts | High rate bins dominated by noise | Noise dominated (total time) | Noise dominated (detector-on time) | Marked lightcurve |
|---|---|---|---|---|---|---|---|
| A | 7178 | 6698 | 0 | 0 | 0.00% | 0.00% |  |
| B | 7179 | 6697 | 0 | 0 | 0.00% | 0.00% |  |
| C | 7179 | 6699 | 0 | 0 | 0.00% | 0.00% | 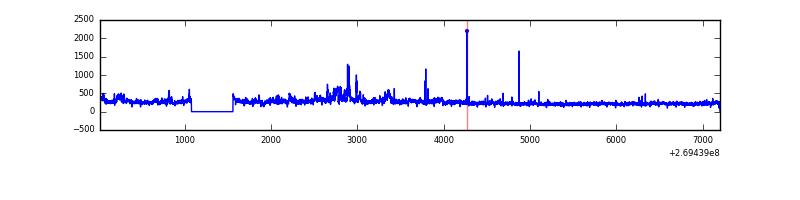 |
| D | 7179 | 6690 | 0 | 0 | 0.00% | 0.00% |  |
Top three noisy pixels from each quadrant. If the there are fewer than three noisy pixels in the level2.evt file, extra rows are filled as -1
| Pixel properties | Quadrant properties | ||||||
|---|---|---|---|---|---|---|---|
| Quadrant | DetID | PixID | Counts | Sigma | Mean | Median | Sigma |
| A | 0 | 29 | 373 | 11.31 | 93 | 88 | 25.2 |
| A | 7 | 110 | 307 | 8.69 | 93 | 88 | 25.2 |
| A | 15 | 236 | 298 | 8.33 | 93 | 88 | 25.2 |
| B | 2 | 9 | 293 | 9.91 | 92 | 88 | 20.7 |
| B | 5 | 255 | 239 | 7.3 | 92 | 88 | 20.7 |
| B | 3 | 17 | 236 | 7.15 | 92 | 88 | 20.7 |
| C | 12 | 241 | 276 | 7.08 | 93 | 87 | 26.7 |
| C | 3 | 126 | 261 | 6.52 | 93 | 87 | 26.7 |
| C | 12 | 250 | 257 | 6.37 | 93 | 87 | 26.7 |
| D | 6 | 231 | 250 | 6.82 | 87 | 80 | 24.9 |
| D | 3 | 14 | 235 | 6.22 | 87 | 80 | 24.9 |
| D | 3 | 159 | 227 | 5.9 | 87 | 80 | 24.9 |
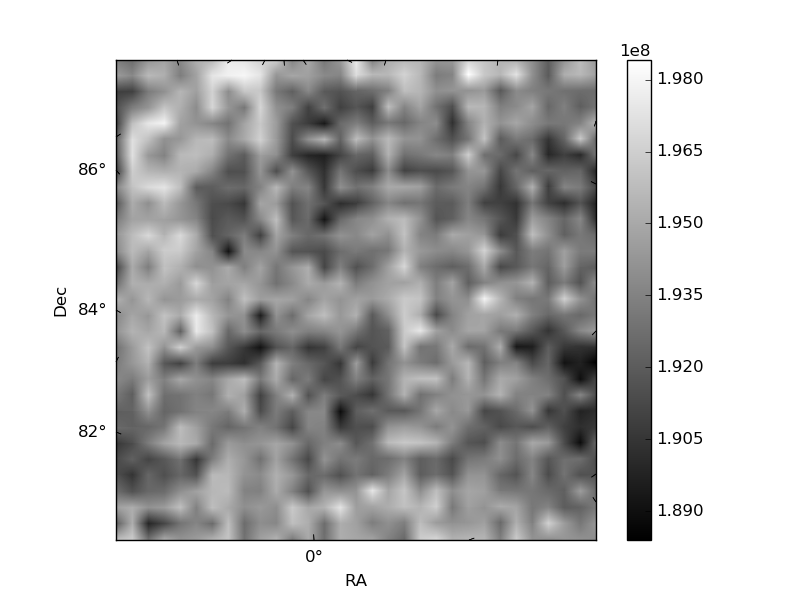
Histogram calculated using DETX and DETY for each event in the final _common_clean file
| Quadrant A |  |
 |
Quadrant B |
|---|---|---|---|
| Quadrant D |  |
 |
Quadrant C |
| Plot type | Count rate plots | Images |
|---|---|---|
| Comparison with Poisson distribution Blue bars denote a histogram of data divided into 1 sec bins. Red curve is a Poisson curve with rate = median count rate of data. |
 |
 |
| Quadrant-wise count rates Data is divided into 100 sec bins |
 |
|
| Module-wise count rates for Quadrant A Data is divided into 100 sec bins |
 |
 |
| Module-wise count rates for Quadrant B Data is divided into 100 sec bins |
 |
 |
| Module-wise count rates for Quadrant C Data is divided into 100 sec bins |
 |
 |
| Module-wise count rates for Quadrant D Data is divided into 100 sec bins |
 |
 |
| Parameter | Plot |
|---|---|
| CZT HV Monitor |  |
| D_VDD | 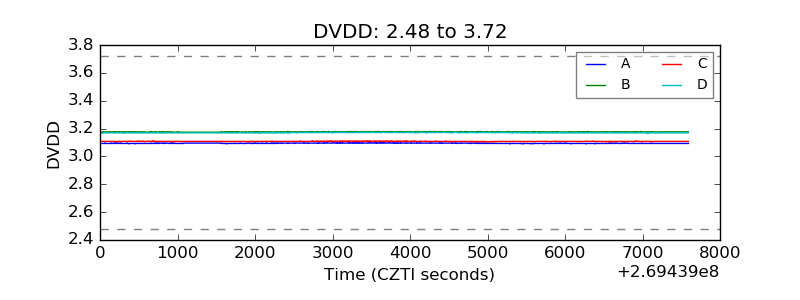 |
| Temperature 1 |  |
| Veto HV Monitor |  |
| Veto LLD |  |
| Alpha Counter |  |
| _CPM_Rate |  |
| CZT Counter |  |
| +2.5 Volts monitor | 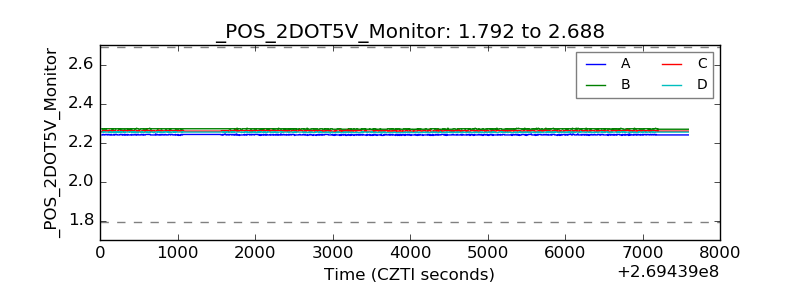 |
| +5 Volts monitor |  |
| _ROLL_ROT |  |
| _Roll_DEC |  |
| _Roll_RA |  |
| Veto Counter |  |