| Param | Original file | Final file |
|---|---|---|
| Filename | modeM0/AS1C03_015T03_9000002230_15134cztM0_level2.evt | modeM0/AS1C03_015T03_9000002230_15134cztM0_level2_quad_clean.evt |
| Size (bytes) | 163,874,880 | 46,828,800 |
| Size | 156.3 MB | 44.7 MB |
| Events in quadrant A | 1,192,928 | 307,949 |
| Events in quadrant B | 1,242,156 | 311,348 |
| Events in quadrant C | 1,206,428 | 311,144 |
| Events in quadrant D | 1,143,812 | 302,624 |
| Mode M9 | |||
|---|---|---|---|
| Quadrant | BADHDUFLAG | Total packets | Discarded packets |
| A | 0 | 4 | 0 |
| B | 0 | 4 | 0 |
| C | 0 | 4 | 0 |
| D | 0 | 4 | 0 |
| Mode SS | |||
|---|---|---|---|
| Quadrant | BADHDUFLAG | Total packets | Discarded packets |
| A | 0 | 54 | 0 |
| B | 0 | 54 | 0 |
| C | 0 | 54 | 0 |
| D | 0 | 54 | 0 |
| Mode M0 | |||
|---|---|---|---|
| Quadrant | BADHDUFLAG | Total packets | Discarded packets |
| A | 0 | 5323 | 0 |
| B | 0 | 5372 | 0 |
| C | 0 | 5243 | 0 |
| D | 0 | 5357 | 0 |
| Quadrant | Total seconds | Saturated seconds | Saturation percentage |
|---|---|---|---|
| A | 2574 | 30 | 1.165501% |
| B | 2574 | 31 | 1.204351% |
| C | 2574 | 29 | 1.126651% |
| D | 2574 | 29 | 1.126651% |
Noise dominated data is calculated using 1-second bins in cleaned event files. If a bin has >2000 counts, and if more than 50% of those come from <1% of pixels, then it is considered to be noise-dominated and hence unusable.
| Quadrant | # 1 sec bins | Bins with >0 counts | Bins with >2000 counts | High rate bins dominated by noise | Noise dominated (total time) | Noise dominated (detector-on time) | Marked lightcurve |
|---|---|---|---|---|---|---|---|
| A | 2574 | 2574 | 0 | 0 | 0.00% | 0.00% | 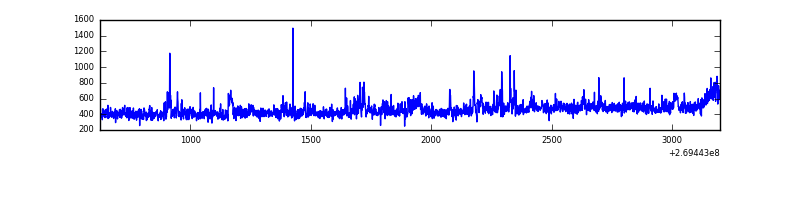 |
| B | 2575 | 2575 | 8 | 8 | 0.31% | 0.31% | 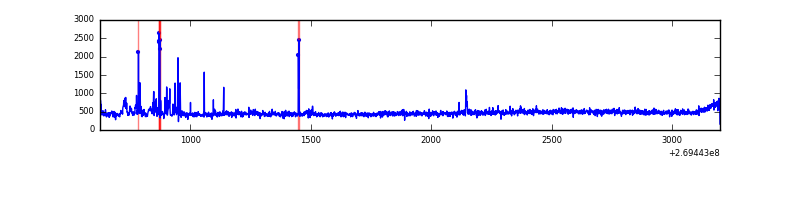 |
| C | 2575 | 2575 | 1 | 1 | 0.04% | 0.04% | 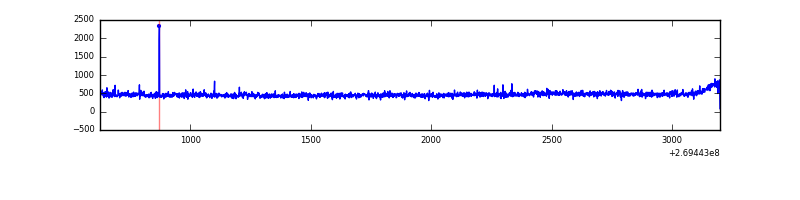 |
| D | 2575 | 2575 | 9 | 9 | 0.35% | 0.35% | 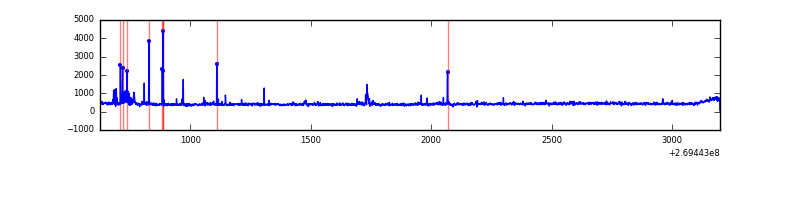 |
Top three noisy pixels from each quadrant. If the there are fewer than three noisy pixels in the level2.evt file, extra rows are filled as -1
| Pixel properties | Quadrant properties | ||||||
|---|---|---|---|---|---|---|---|
| Quadrant | DetID | PixID | Counts | Sigma | Mean | Median | Sigma |
| A | 12 | 189 | 71247 | 1154.13 | 290 | 283 | 61.5 |
| A | 0 | 226 | 2596 | 37.62 | 290 | 283 | 61.5 |
| A | 12 | 194 | 2133 | 30.09 | 290 | 283 | 61.5 |
| B | 3 | 64 | 59416 | 1011.96 | 294 | 286 | 58.4 |
| B | 3 | 209 | 10191 | 169.51 | 294 | 286 | 58.4 |
| B | 0 | 229 | 8651 | 143.16 | 294 | 286 | 58.4 |
| C | 3 | 233 | 90201 | 1326.55 | 284 | 284 | 67.8 |
| C | 0 | 207 | 5938 | 83.41 | 284 | 284 | 67.8 |
| C | 13 | 61 | 1954 | 24.63 | 284 | 284 | 67.8 |
| D | 7 | 38 | 45303 | 644.01 | 280 | 270 | 69.9 |
| D | 13 | 172 | 12190 | 170.47 | 280 | 270 | 69.9 |
| D | 2 | 234 | 11336 | 158.25 | 280 | 270 | 69.9 |
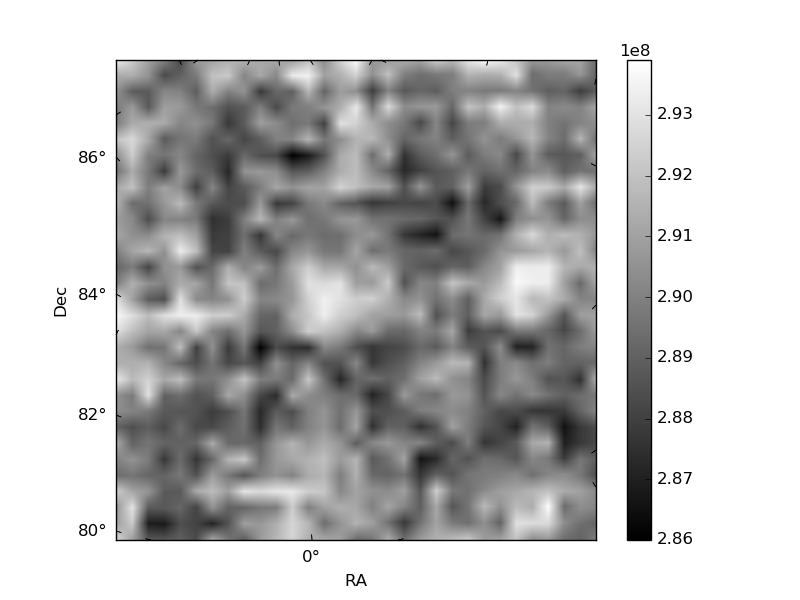
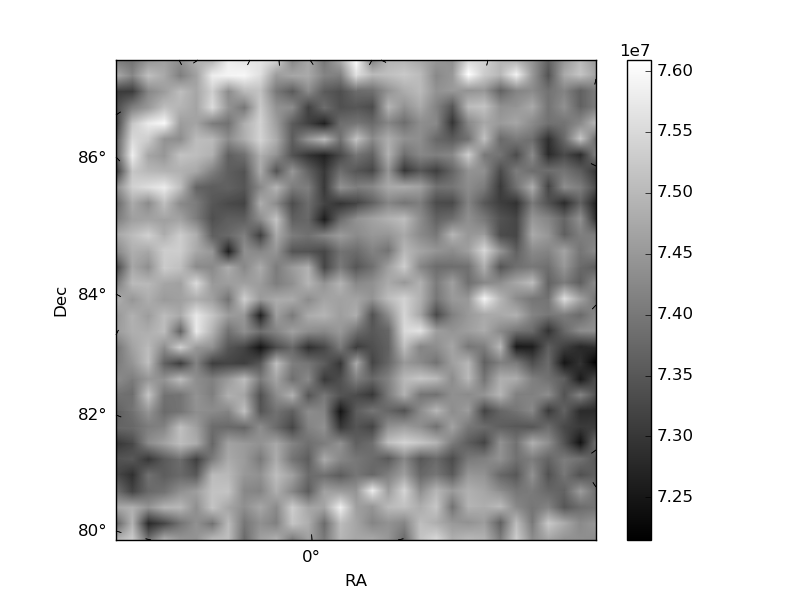
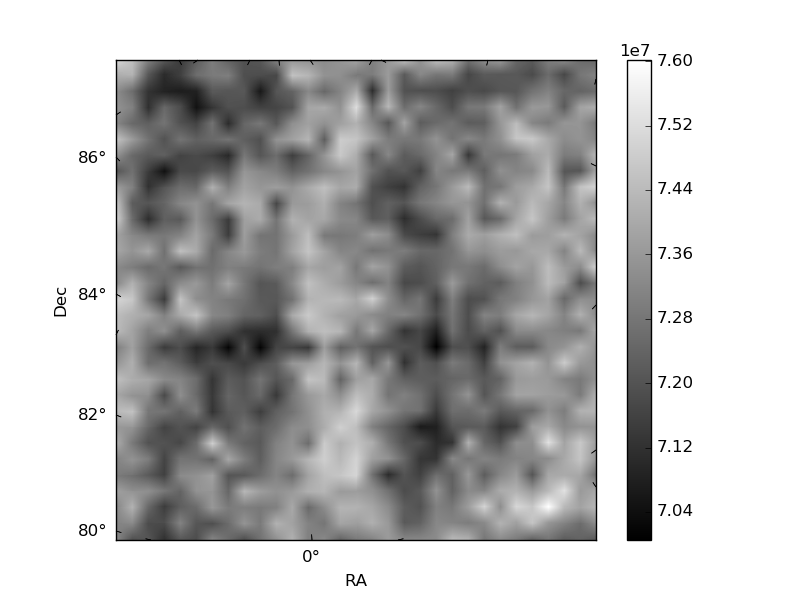
Histogram calculated using DETX and DETY for each event in the final _common_clean file
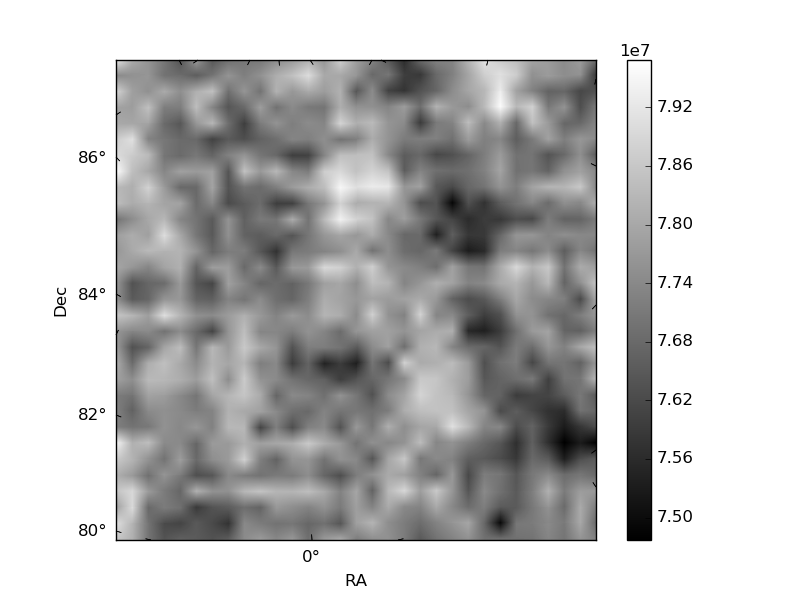
| Quadrant A | 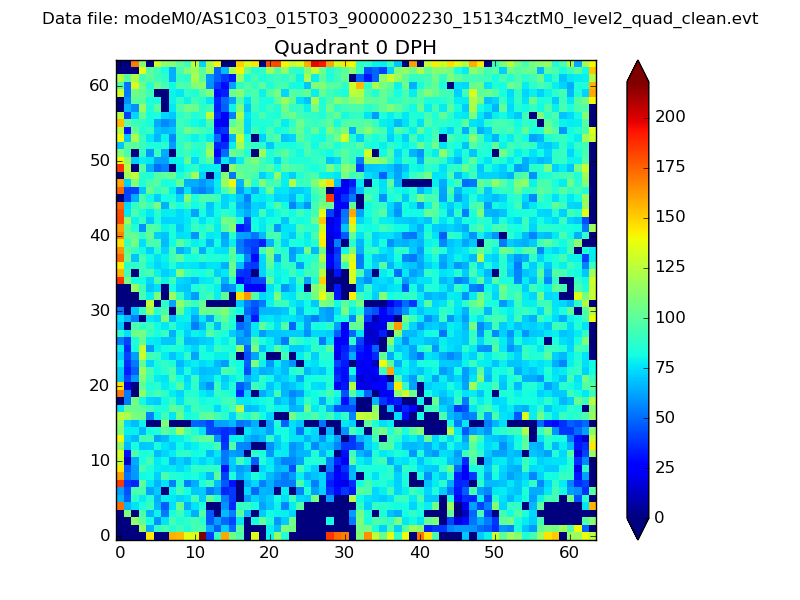 |
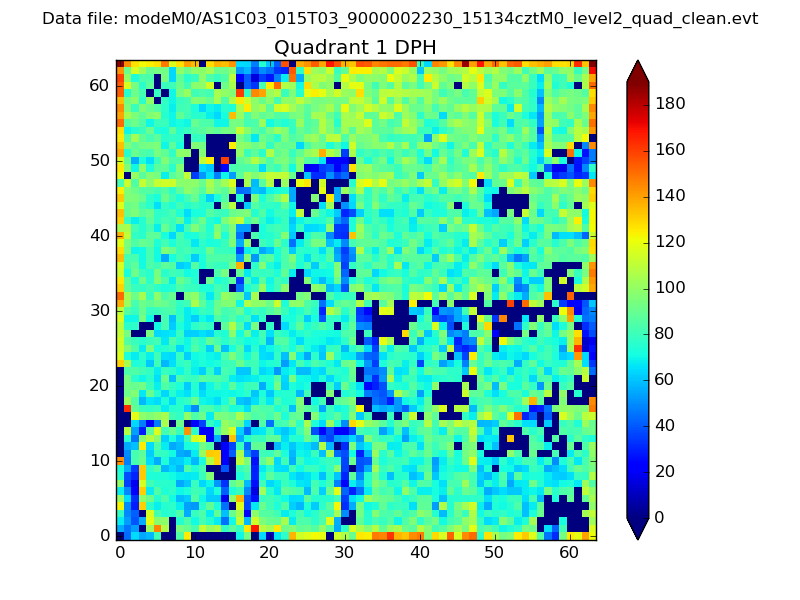 |
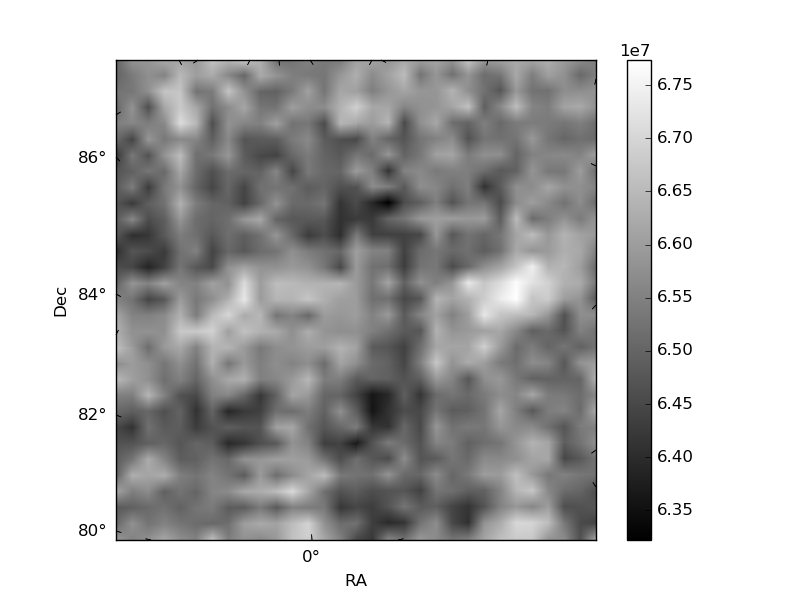
Quadrant B |
|---|---|---|---|
| Quadrant D |  |
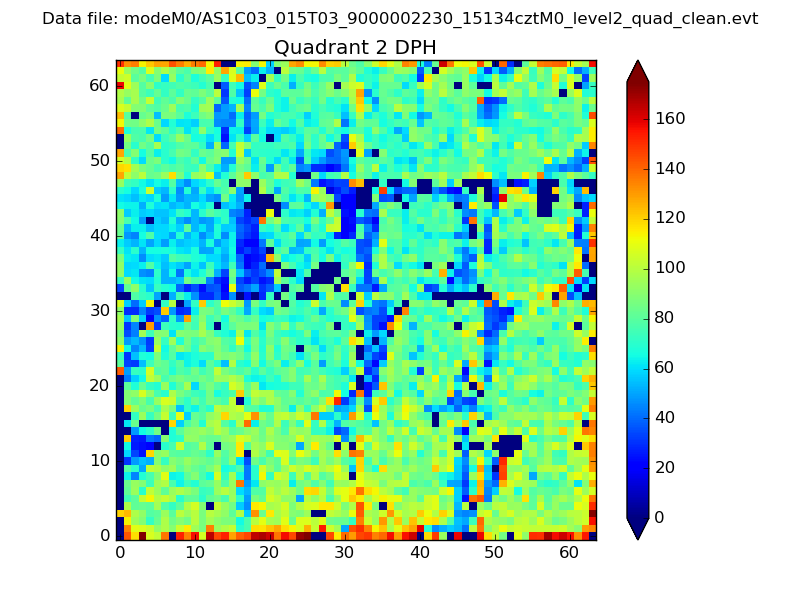 |
Quadrant C |
| Plot type | Count rate plots | Images |
|---|---|---|
| Comparison with Poisson distribution Blue bars denote a histogram of data divided into 1 sec bins. Red curve is a Poisson curve with rate = median count rate of data. |
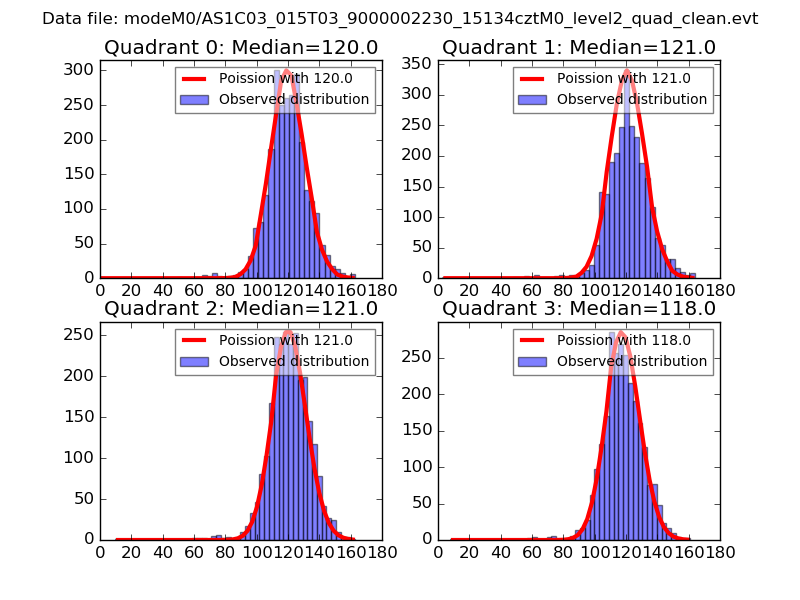 |
 |
| Quadrant-wise count rates Data is divided into 100 sec bins |
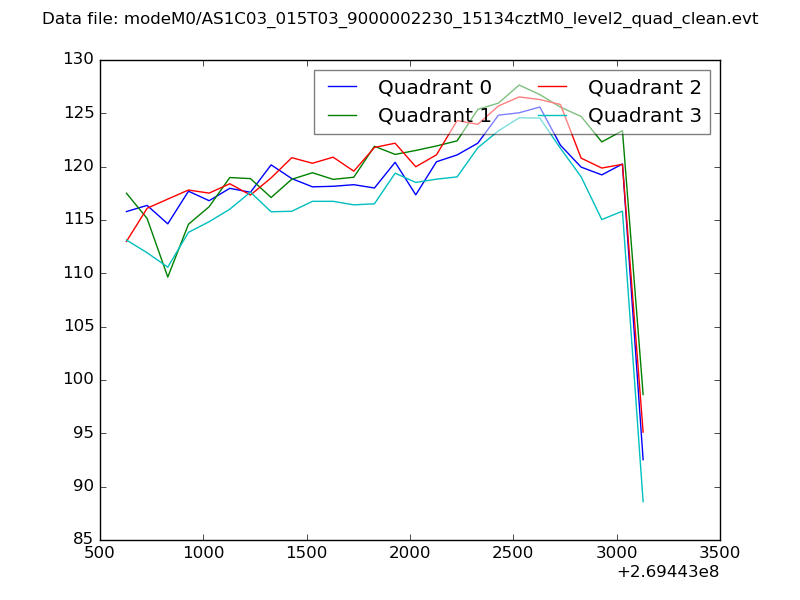 |
|
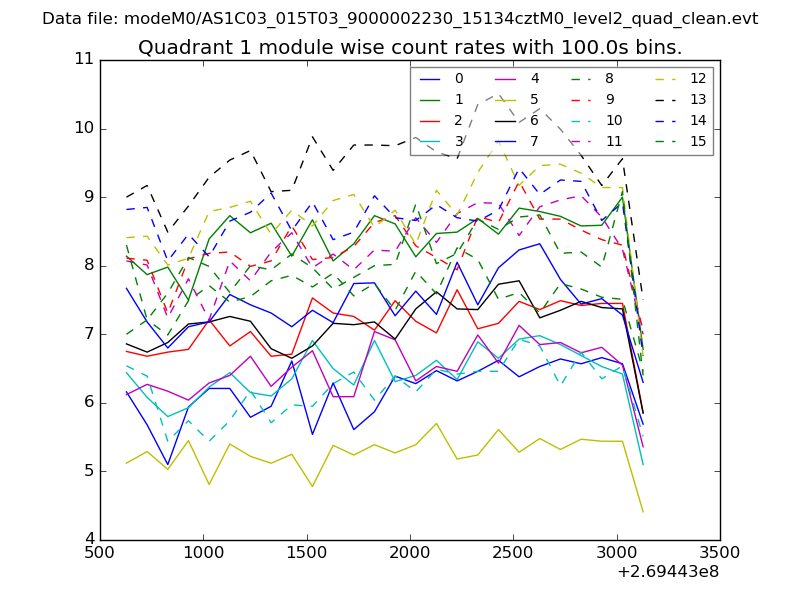
| Module-wise count rates for Quadrant A Data is divided into 100 sec bins |
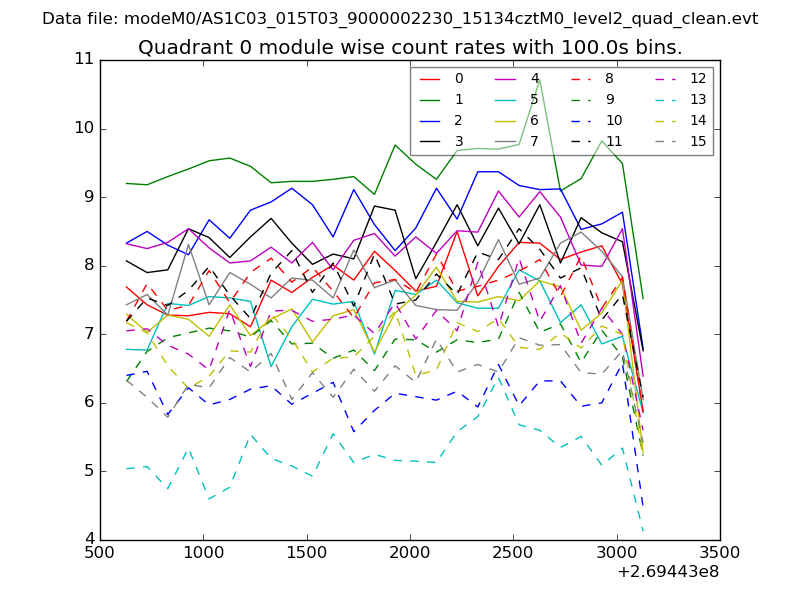 |
 |
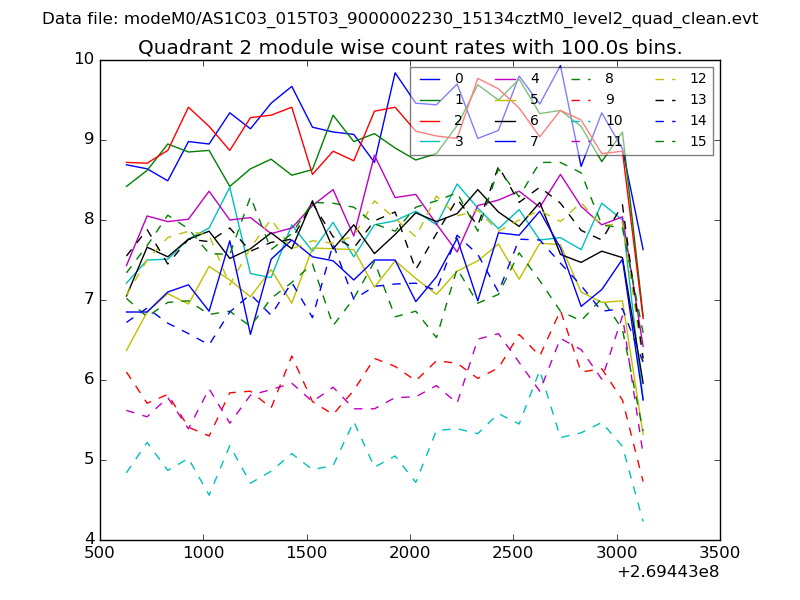
| Module-wise count rates for Quadrant B Data is divided into 100 sec bins |
 |
 |
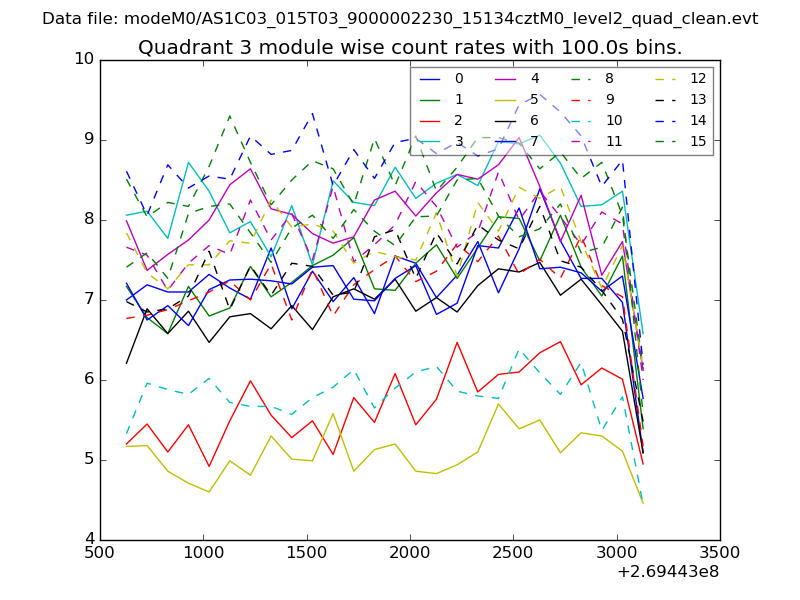
| Module-wise count rates for Quadrant C Data is divided into 100 sec bins |
 |
 |
| Module-wise count rates for Quadrant D Data is divided into 100 sec bins |
 |
 |
| Parameter | Plot |
|---|---|
| CZT HV Monitor | 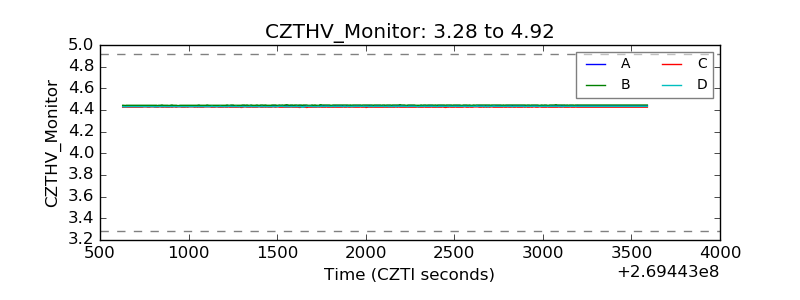 |
| D_VDD | 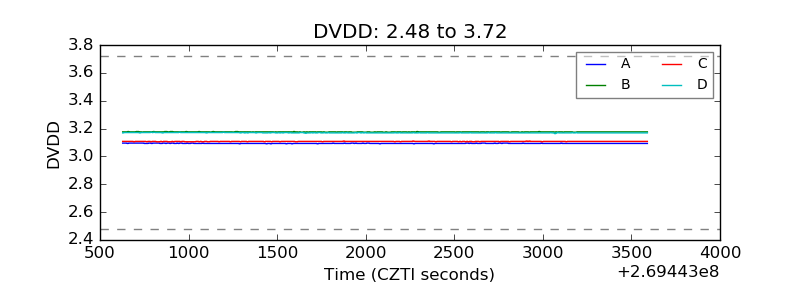 |
| Temperature 1 | 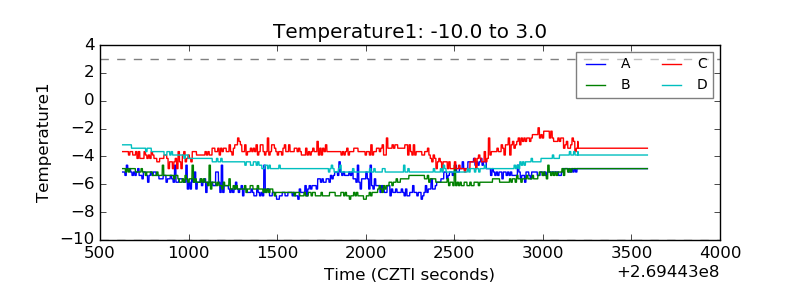 |
| Veto HV Monitor | 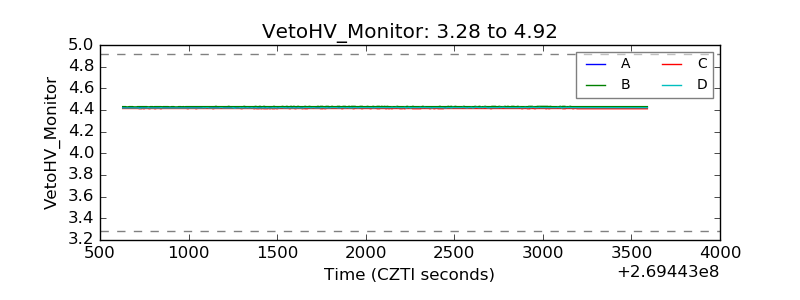 |
| Veto LLD | 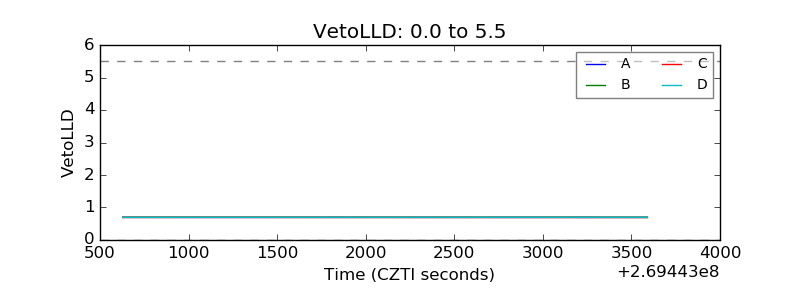 |
| Alpha Counter | 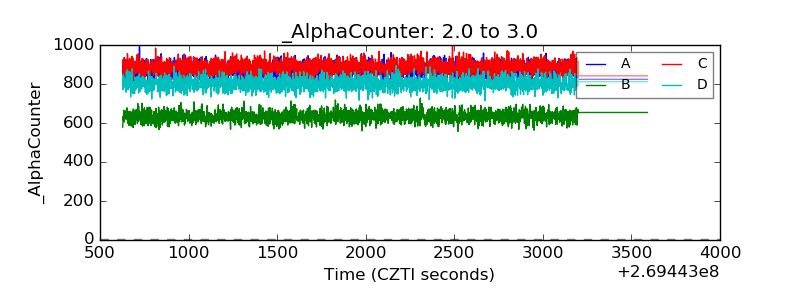 |
| _CPM_Rate | 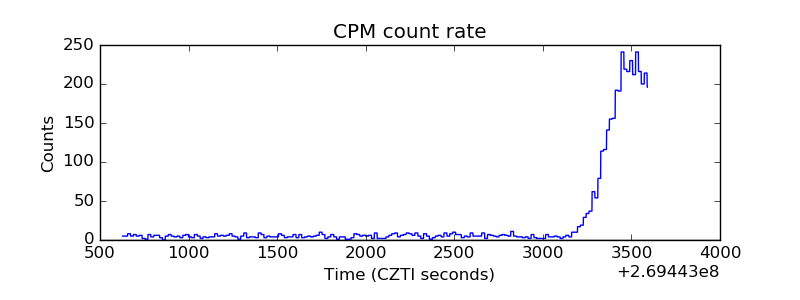 |
| CZT Counter | 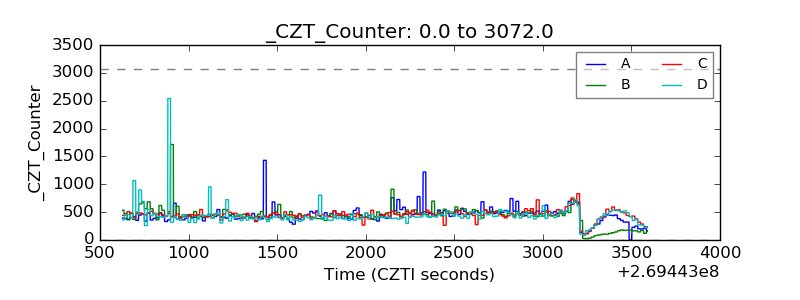 |
| +2.5 Volts monitor |  |
| +5 Volts monitor |  |
| _ROLL_ROT | 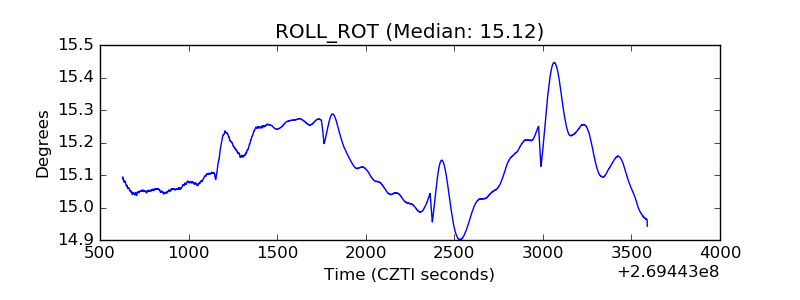 |
| _Roll_DEC | 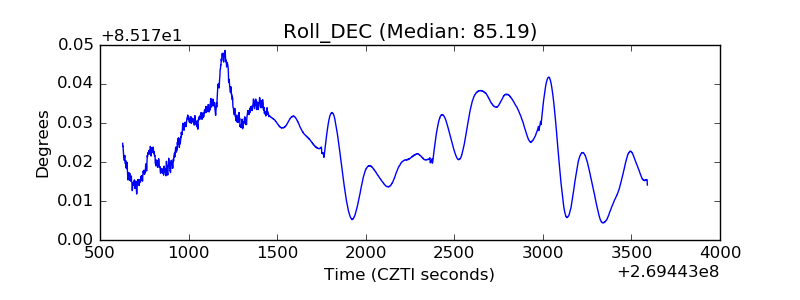 |
| _Roll_RA | 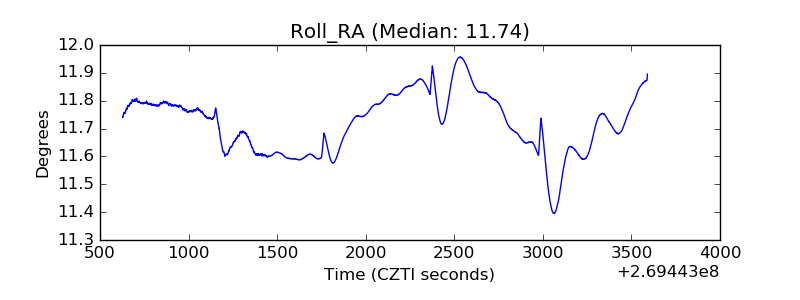 |
| Veto Counter | 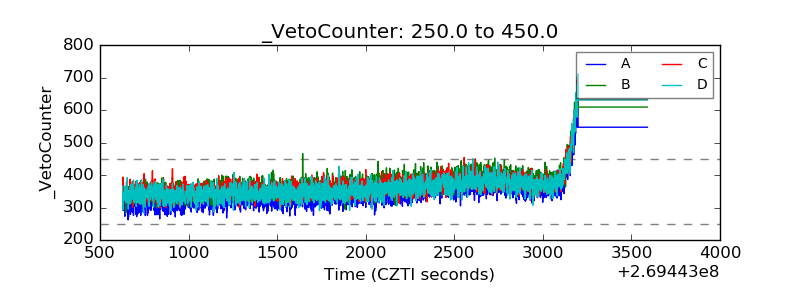 |