| Param | Original file | Final file |
|---|---|---|
| Filename | modeM0/AS1G08_061T03_9000002228cztM0_level2.fits | modeM0/AS1G08_061T03_9000002228cztM0_level2_quad_clean.evt |
| Size (bytes) | 116,424,000 | 104,526,720 |
| Size | 111.0 MB | 99.7 MB |
| Events in quadrant A | 699,572 | 609,996 |
| Events in quadrant B | 674,026 | 598,385 |
| Events in quadrant C | 685,786 | 564,642 |
| Events in quadrant D | 602,618 | 528,007 |
| Mode M0 | |||
|---|---|---|---|
| Quadrant | BADHDUFLAG | Total packets | Discarded packets |
| A | 0 | 26543 | 0 |
| B | 0 | 27471 | 0 |
| C | 0 | 31280 | 0 |
| D | 0 | 27139 | 0 |
| Mode M9 | |||
|---|---|---|---|
| Quadrant | BADHDUFLAG | Total packets | Discarded packets |
| A | 0 | 3 | 0 |
| B | 0 | 3 | 0 |
| C | 0 | 3 | 0 |
| D | 0 | 3 | 0 |
| Mode SS | |||
|---|---|---|---|
| Quadrant | BADHDUFLAG | Total packets | Discarded packets |
| A | 0 | 252 | 0 |
| B | 0 | 252 | 0 |
| C | 0 | 252 | 0 |
| D | 0 | 252 | 0 |
| Quadrant | Total seconds | Saturated seconds | Saturation percentage |
|---|---|---|---|
| A | 12494 | 411 | 3.289579% |
| B | 12494 | 516 | 4.129982% |
| C | 12494 | 337 | 2.697295% |
| D | 12494 | 393 | 3.145510% |
Noise dominated data is calculated using 1-second bins in cleaned event files. If a bin has >2000 counts, and if more than 50% of those come from <1% of pixels, then it is considered to be noise-dominated and hence unusable.
| Quadrant | # 1 sec bins | Bins with >0 counts | Bins with >2000 counts | High rate bins dominated by noise | Noise dominated (total time) | Noise dominated (detector-on time) | Marked lightcurve |
|---|---|---|---|---|---|---|---|
| A | 12784 | 12493 | 0 | 0 | 0.00% | 0.00% |  |
| B | 12784 | 12493 | 0 | 0 | 0.00% | 0.00% |  |
| C | 12784 | 12493 | 0 | 0 | 0.00% | 0.00% |  |
| D | 12784 | 12487 | 0 | 0 | 0.00% | 0.00% |  |
Top three noisy pixels from each quadrant. If the there are fewer than three noisy pixels in the level2.evt file, extra rows are filled as -1
| Pixel properties | Quadrant properties | ||||||
|---|---|---|---|---|---|---|---|
| Quadrant | DetID | PixID | Counts | Sigma | Mean | Median | Sigma |
| A | 0 | 29 | 657 | 10.2 | 181 | 169 | 47.8 |
| A | 15 | 236 | 595 | 8.91 | 181 | 169 | 47.8 |
| A | 7 | 110 | 567 | 8.32 | 181 | 169 | 47.8 |
| B | 2 | 9 | 616 | 11.8 | 177 | 168 | 38.0 |
| B | 3 | 17 | 479 | 8.19 | 177 | 168 | 38.0 |
| B | 5 | 225 | 473 | 8.03 | 177 | 168 | 38.0 |
| C | 12 | 241 | 517 | 7.22 | 181 | 168 | 48.4 |
| C | 2 | 191 | 486 | 6.57 | 181 | 168 | 48.4 |
| C | 3 | 158 | 470 | 6.24 | 181 | 168 | 48.4 |
| D | 3 | 14 | 459 | 6.33 | 172 | 156 | 47.9 |
| D | 10 | 113 | 430 | 5.72 | 172 | 156 | 47.9 |
| D | 6 | 231 | 428 | 5.68 | 172 | 156 | 47.9 |
Histogram calculated using DETX and DETY for each event in the final _common_clean file
| Quadrant A | 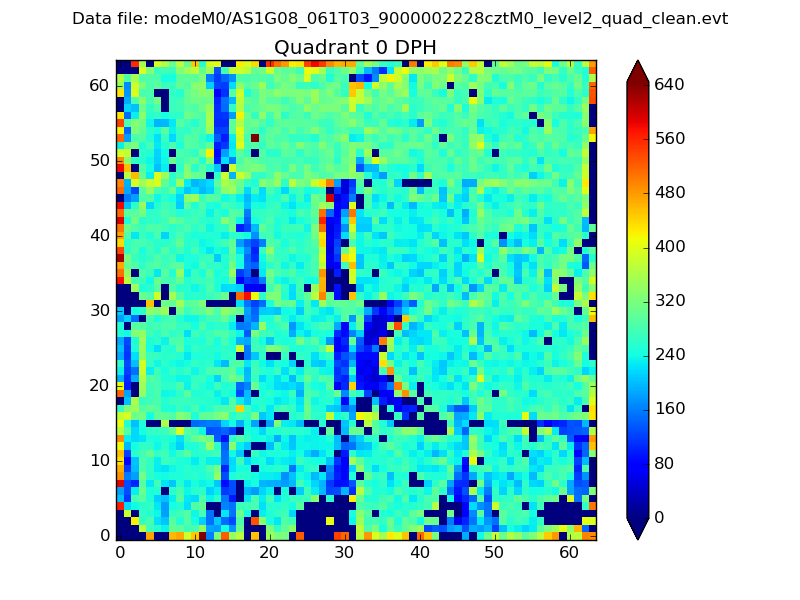 |
 |
Quadrant B |
|---|---|---|---|
| Quadrant D |  |
 |
Quadrant C |
| Plot type | Count rate plots | Images |
|---|---|---|
| Comparison with Poisson distribution Blue bars denote a histogram of data divided into 1 sec bins. Red curve is a Poisson curve with rate = median count rate of data. |
 |
 |
| Quadrant-wise count rates Data is divided into 100 sec bins |
 |
|
| Module-wise count rates for Quadrant A Data is divided into 100 sec bins |
 |
 |
| Module-wise count rates for Quadrant B Data is divided into 100 sec bins |
 |
 |
| Module-wise count rates for Quadrant C Data is divided into 100 sec bins |
 |
 |
| Module-wise count rates for Quadrant D Data is divided into 100 sec bins |
 |
 |
| Parameter | Plot |
|---|---|
| CZT HV Monitor |  |
| D_VDD | 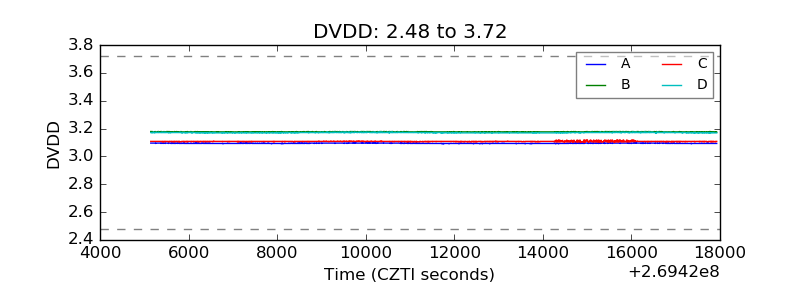 |
| Temperature 1 |  |
| Veto HV Monitor | 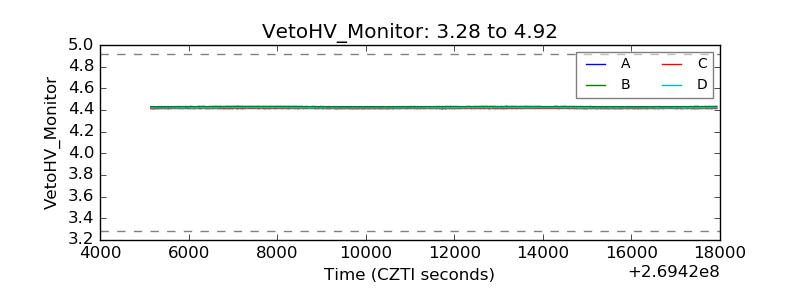 |
| Veto LLD |  |
| Alpha Counter |  |
| _CPM_Rate | 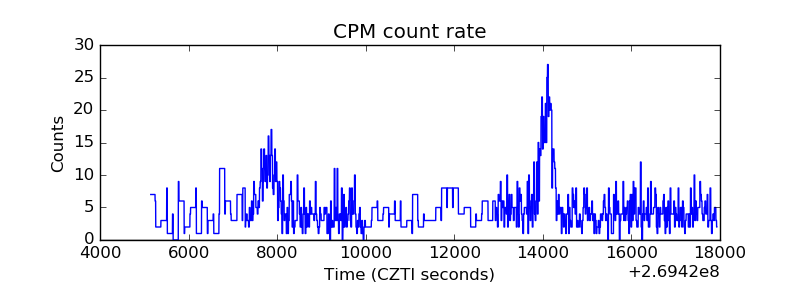 |
| CZT Counter |  |
| +2.5 Volts monitor |  |
| +5 Volts monitor |  |
| _ROLL_ROT |  |
| _Roll_DEC | 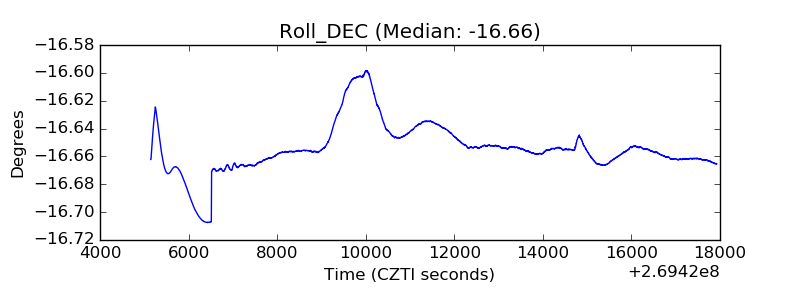 |
| _Roll_RA | 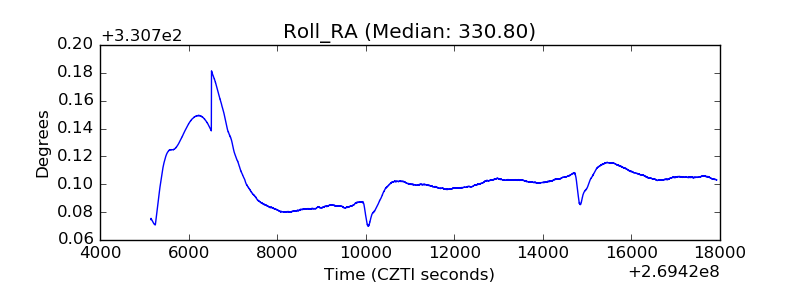 |
| Veto Counter |  |