| Param | Original file | Final file |
|---|---|---|
| Filename | modeM0/AS1G08_061T03_9000002228_15130cztM0_level2.evt | modeM0/AS1G08_061T03_9000002228_15130cztM0_level2_quad_clean.evt |
| Size (bytes) | 331,436,160 | 65,888,640 |
| Size | 316.1 MB | 62.8 MB |
| Events in quadrant A | 2,245,925 | 425,825 |
| Events in quadrant B | 2,364,978 | 433,326 |
| Events in quadrant C | 2,871,523 | 420,044 |
| Events in quadrant D | 2,259,860 | 410,845 |
| Mode M0 | |||
|---|---|---|---|
| Quadrant | BADHDUFLAG | Total packets | Discarded packets |
| A | 0 | 9453 | 1 |
| B | 0 | 9681 | 0 |
| C | 0 | 11862 | 0 |
| D | 0 | 9714 | 0 |
| Mode SS | |||
|---|---|---|---|
| Quadrant | BADHDUFLAG | Total packets | Discarded packets |
| A | 0 | 86 | 0 |
| B | 0 | 86 | 0 |
| C | 0 | 86 | 0 |
| D | 0 | 86 | 0 |
| Quadrant | Total seconds | Saturated seconds | Saturation percentage |
|---|---|---|---|
| A | 4330 | 268 | 6.189376% |
| B | 4330 | 303 | 6.997691% |
| C | 4330 | 229 | 5.288684% |
| D | 4330 | 229 | 5.288684% |
Noise dominated data is calculated using 1-second bins in cleaned event files. If a bin has >2000 counts, and if more than 50% of those come from <1% of pixels, then it is considered to be noise-dominated and hence unusable.
| Quadrant | # 1 sec bins | Bins with >0 counts | Bins with >2000 counts | High rate bins dominated by noise | Noise dominated (total time) | Noise dominated (detector-on time) | Marked lightcurve |
|---|---|---|---|---|---|---|---|
| A | 4331 | 4331 | 0 | 0 | 0.00% | 0.00% | 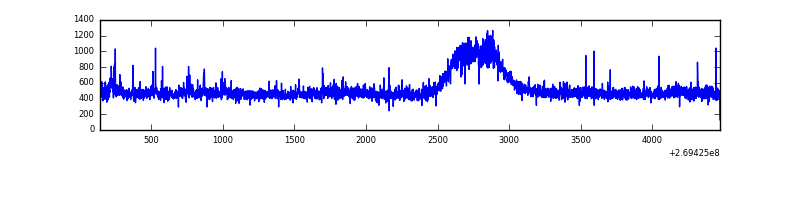 |
| B | 4331 | 4331 | 12 | 12 | 0.28% | 0.28% | 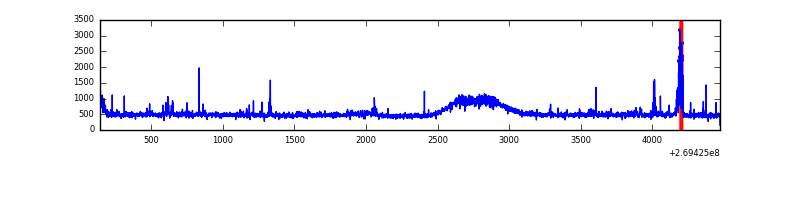 |
| C | 4331 | 4331 | 0 | 0 | 0.00% | 0.00% | 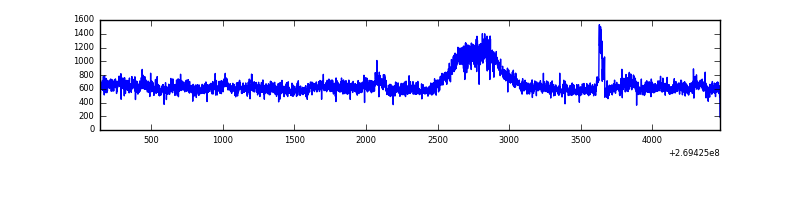 |
| D | 4331 | 4331 | 18 | 18 | 0.42% | 0.42% | 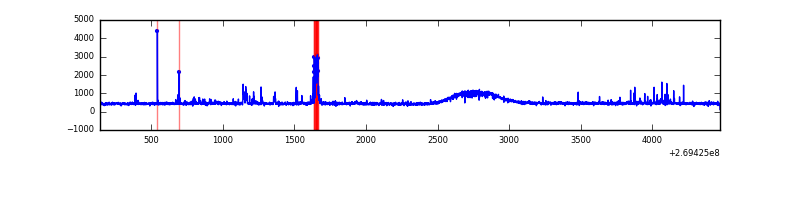 |
Top three noisy pixels from each quadrant. If the there are fewer than three noisy pixels in the level2.evt file, extra rows are filled as -1
| Pixel properties | Quadrant properties | ||||||
|---|---|---|---|---|---|---|---|
| Quadrant | DetID | PixID | Counts | Sigma | Mean | Median | Sigma |
| A | 12 | 189 | 52127 | 435.98 | 566 | 553 | 118.3 |
| A | 15 | 239 | 13529 | 109.69 | 566 | 553 | 118.3 |
| A | 0 | 226 | 4914 | 36.87 | 566 | 553 | 118.3 |
| B | 4 | 48 | 51907 | 453.42 | 566 | 550 | 113.3 |
| B | 3 | 209 | 31953 | 277.25 | 566 | 550 | 113.3 |
| B | 3 | 64 | 24619 | 212.5 | 566 | 550 | 113.3 |
| C | 3 | 233 | 704361 | 5286.97 | 554 | 557 | 133.1 |
| C | 3 | 234 | 4224 | 27.55 | 554 | 557 | 133.1 |
| C | 13 | 61 | 3917 | 25.24 | 554 | 557 | 133.1 |
| D | 13 | 172 | 72448 | 511.12 | 559 | 542 | 140.7 |
| D | 10 | 70 | 17144 | 118.01 | 559 | 542 | 140.7 |
| D | 2 | 234 | 16261 | 111.73 | 559 | 542 | 140.7 |
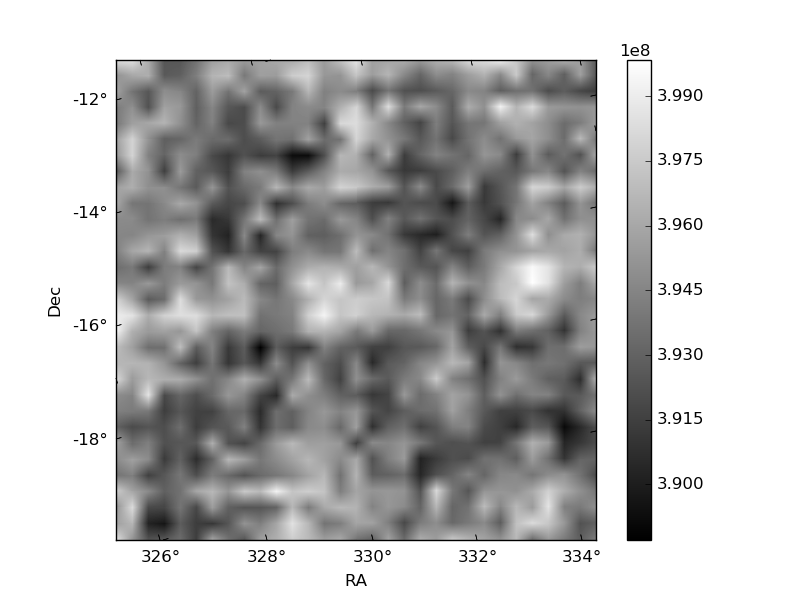
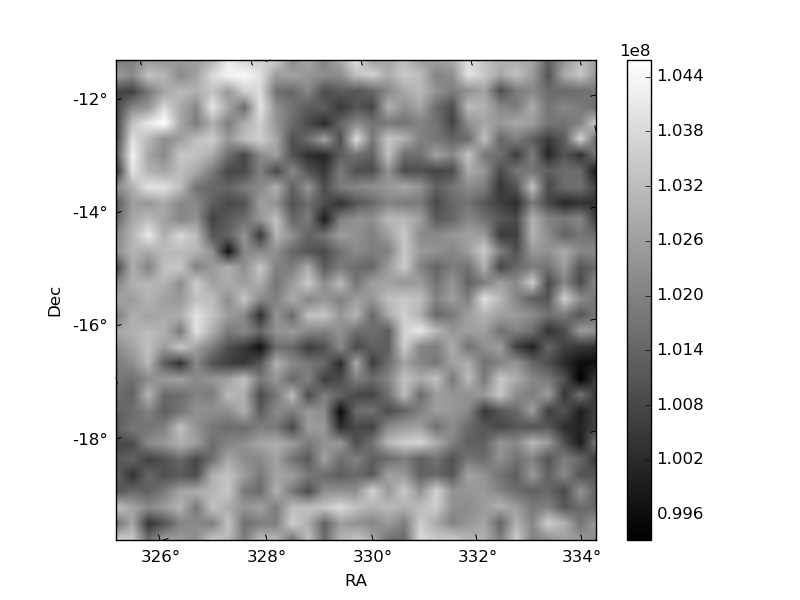
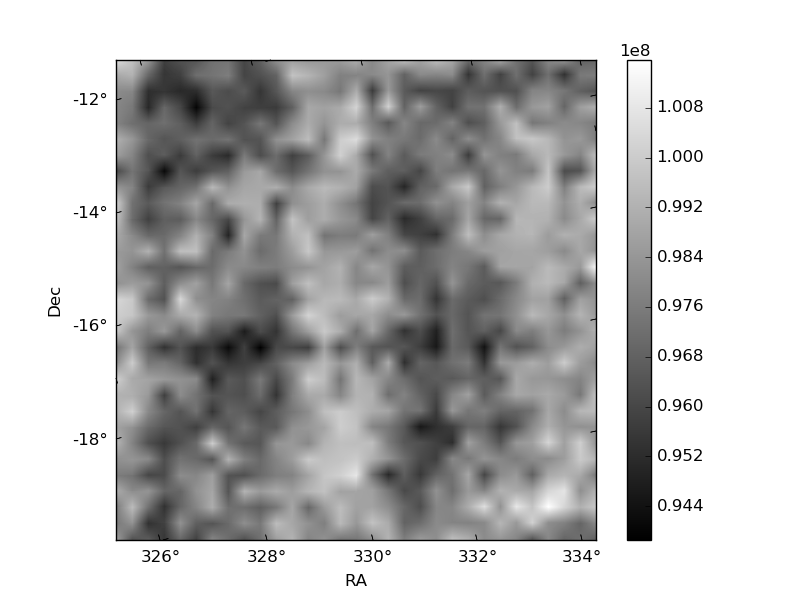
Histogram calculated using DETX and DETY for each event in the final _common_clean file
| Quadrant A | 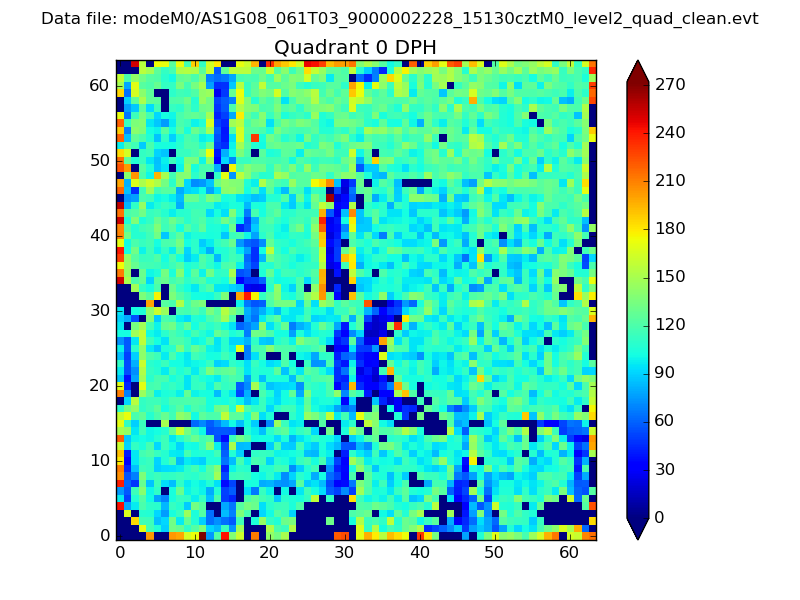 |
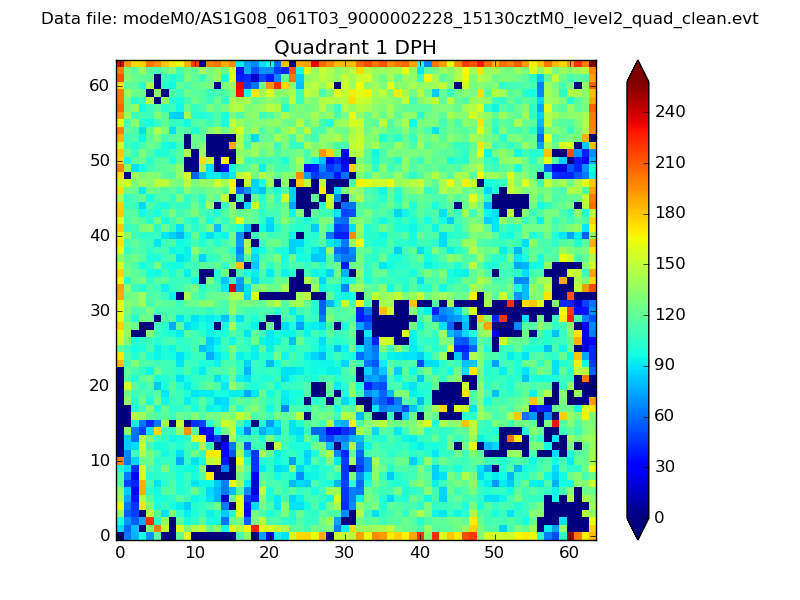 |
Quadrant B |
|---|---|---|---|
| Quadrant D | 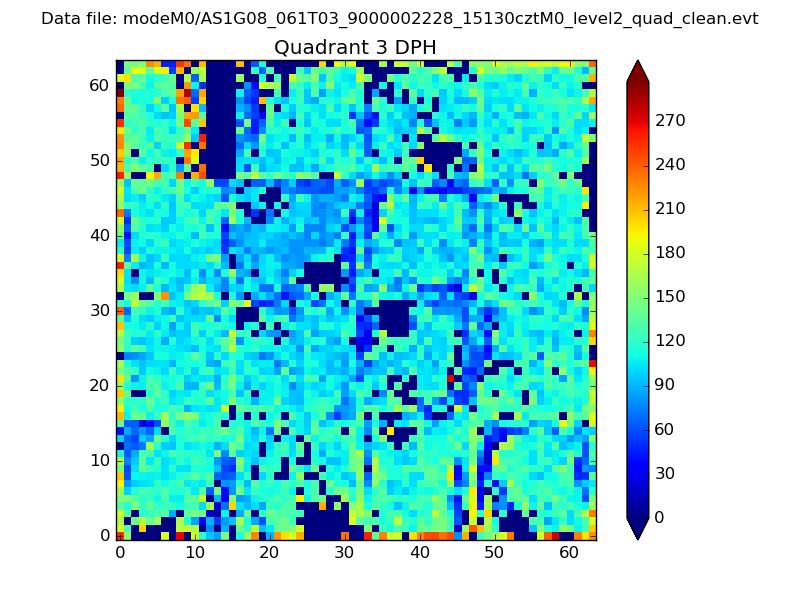 |
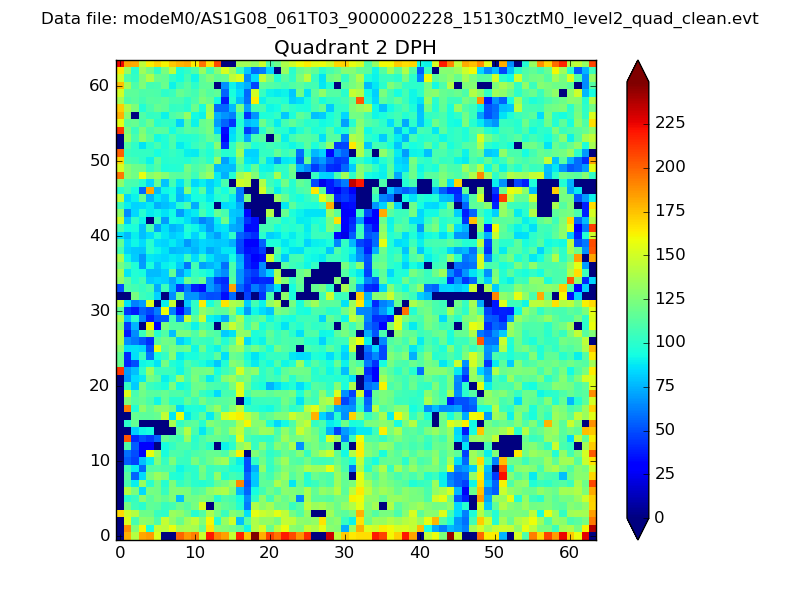 |
Quadrant C |
| Plot type | Count rate plots | Images |
|---|---|---|
| Comparison with Poisson distribution Blue bars denote a histogram of data divided into 1 sec bins. Red curve is a Poisson curve with rate = median count rate of data. |
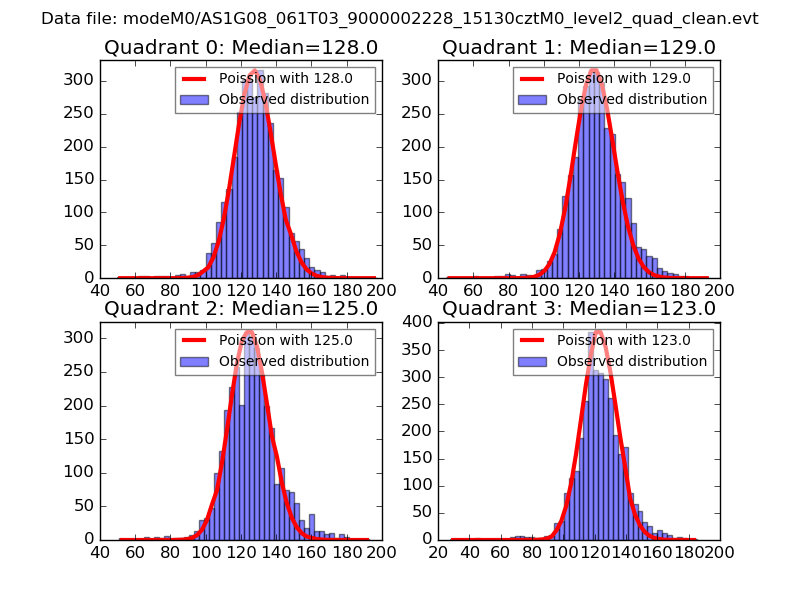 |
 |
| Quadrant-wise count rates Data is divided into 100 sec bins |
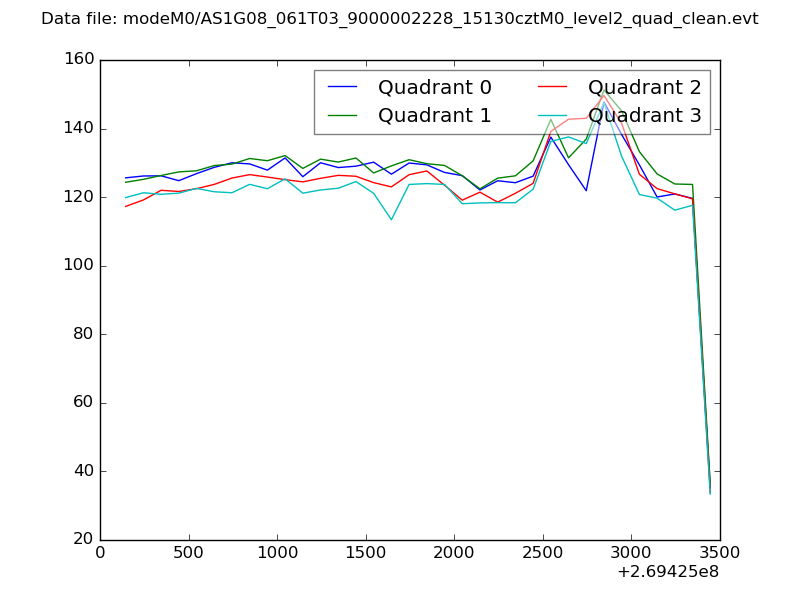 |
|
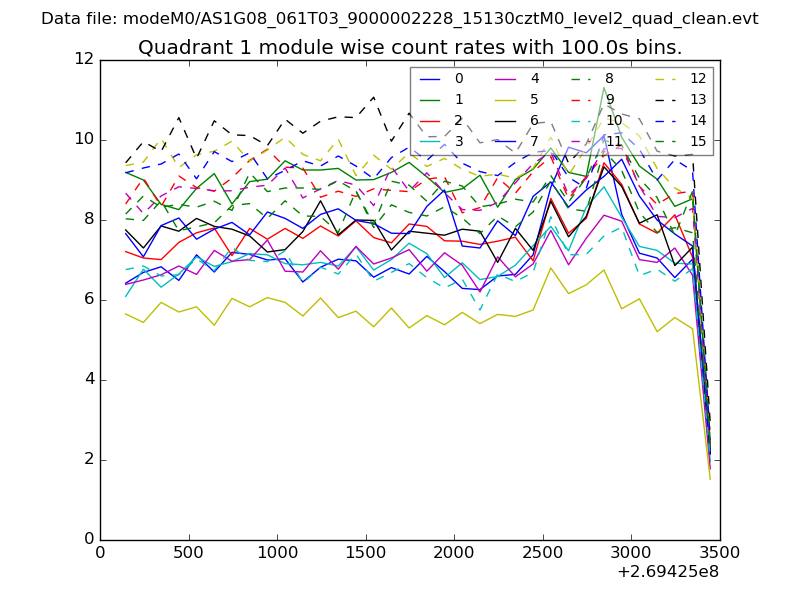
| Module-wise count rates for Quadrant A Data is divided into 100 sec bins |
 |
 |
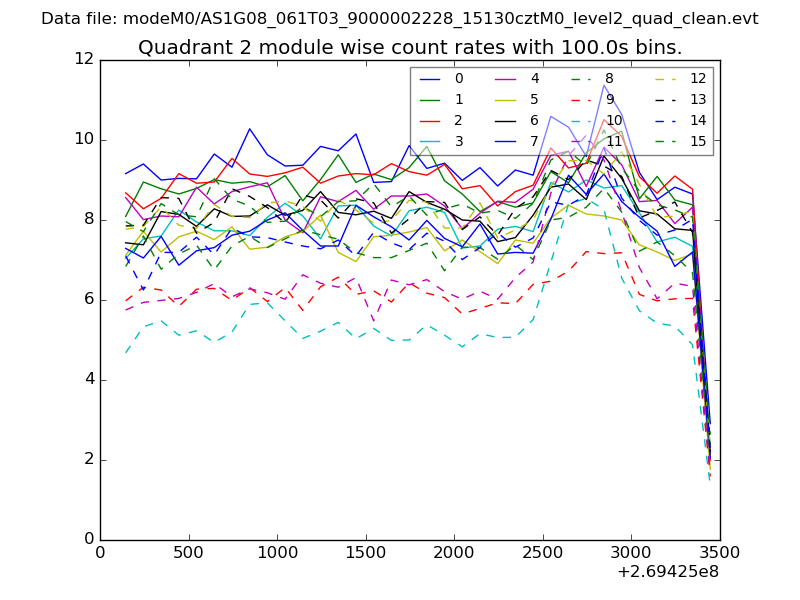
| Module-wise count rates for Quadrant B Data is divided into 100 sec bins |
 |
 |
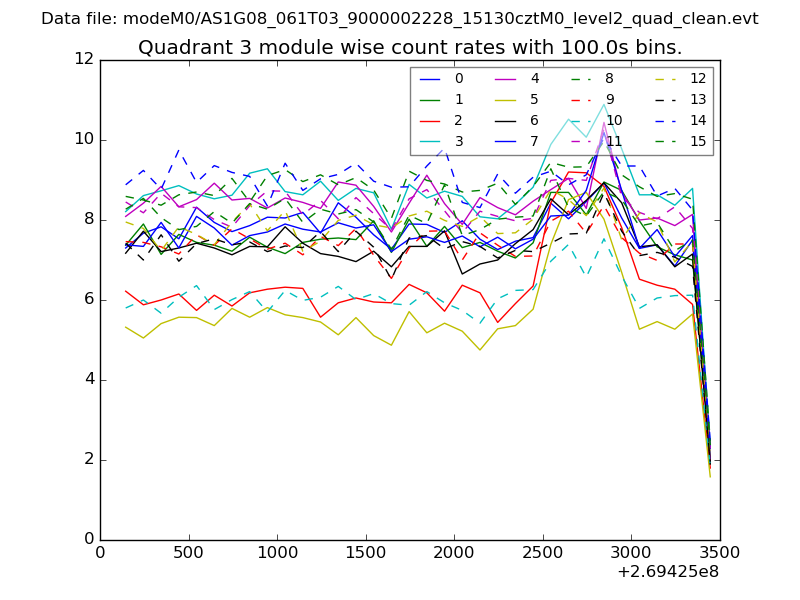
| Module-wise count rates for Quadrant C Data is divided into 100 sec bins |
 |
 |
| Module-wise count rates for Quadrant D Data is divided into 100 sec bins |
 |
 |
| Parameter | Plot |
|---|---|
| CZT HV Monitor |  |
| D_VDD | 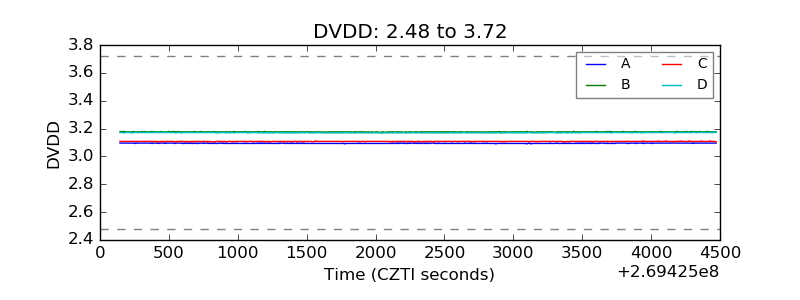 |
| Temperature 1 | 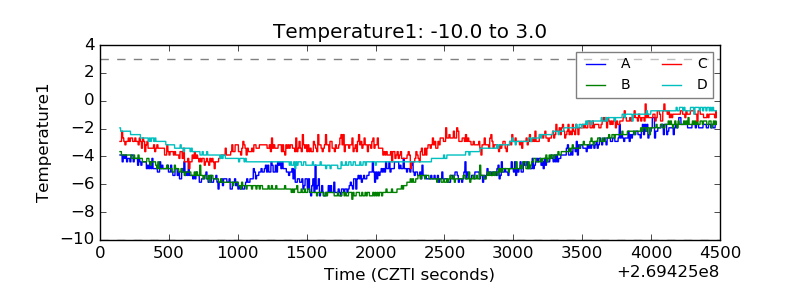 |
| Veto HV Monitor | 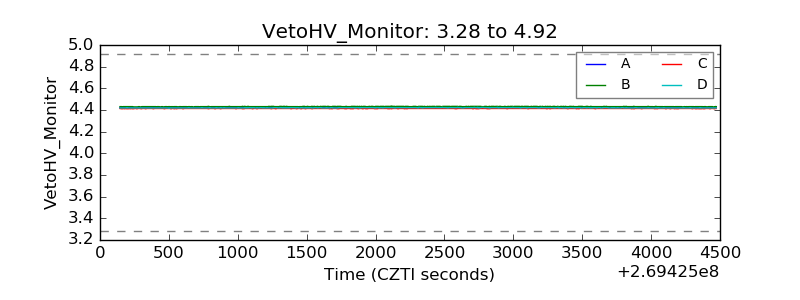 |
| Veto LLD | 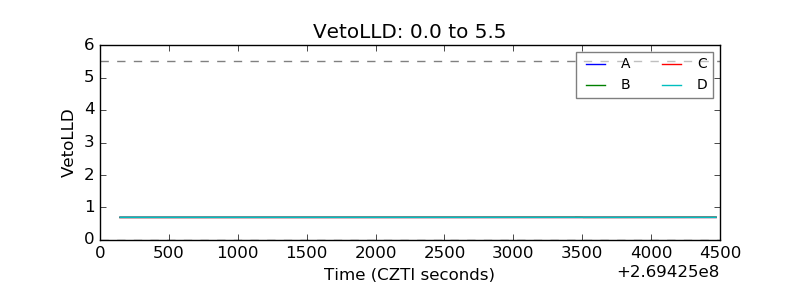 |
| Alpha Counter | 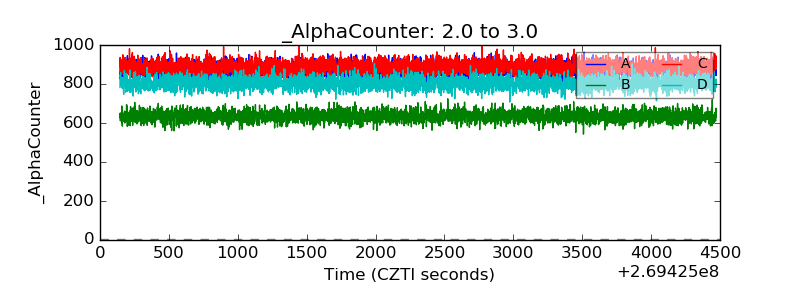 |
| _CPM_Rate | 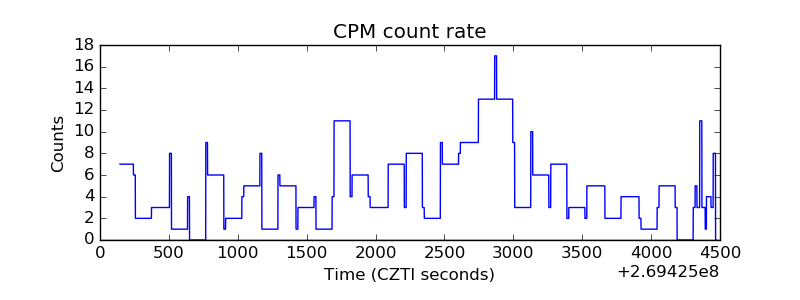 |
| CZT Counter | 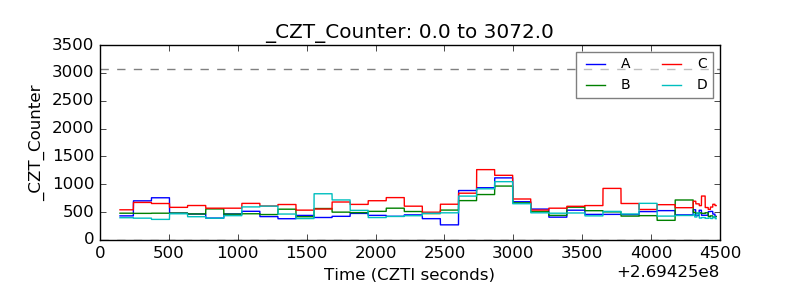 |
| +2.5 Volts monitor |  |
| +5 Volts monitor |  |
| _ROLL_ROT | 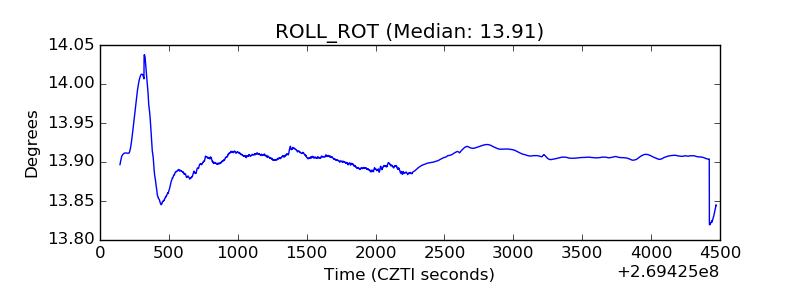 |
| _Roll_DEC | 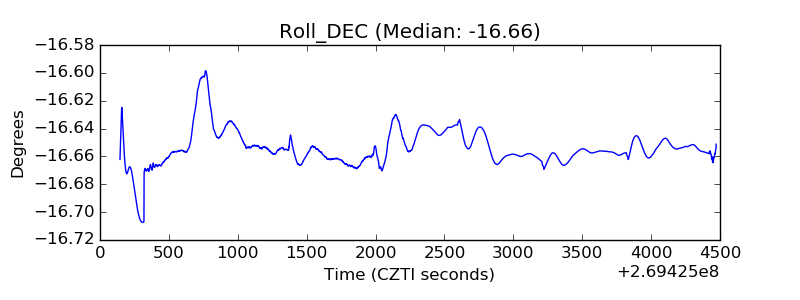 |
| _Roll_RA | 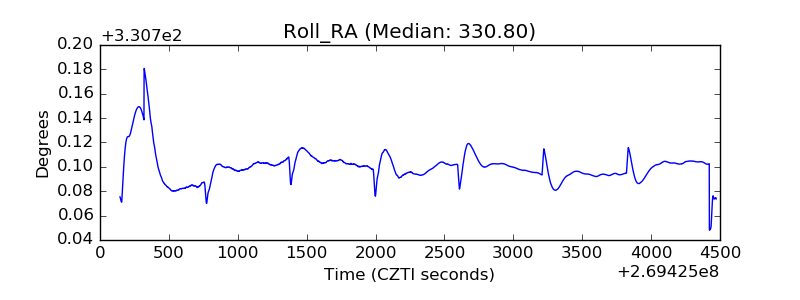 |
| Veto Counter | 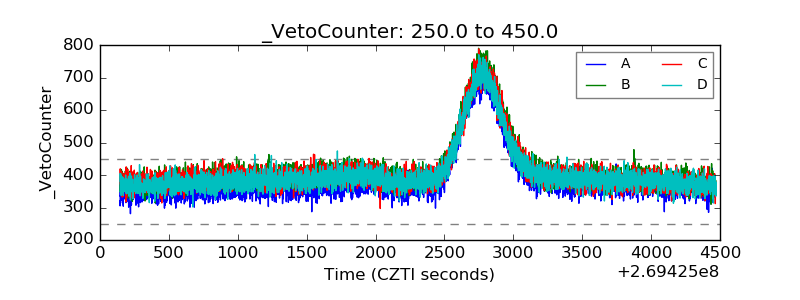 |