| Param | Original file | Final file |
|---|---|---|
| Filename | modeM0/AS1G08_061T03_9000002228_15131cztM0_level2.evt | modeM0/AS1G08_061T03_9000002228_15131cztM0_level2_quad_clean.evt |
| Size (bytes) | 549,290,880 | 81,394,560 |
| Size | 523.8 MB | 77.6 MB |
| Events in quadrant A | 3,745,209 | 491,797 |
| Events in quadrant B | 3,935,051 | 495,985 |
| Events in quadrant C | 4,682,261 | 481,684 |
| Events in quadrant D | 3,756,813 | 466,022 |
| Mode M0 | |||
|---|---|---|---|
| Quadrant | BADHDUFLAG | Total packets | Discarded packets |
| A | 0 | 15971 | 2 |
| B | 0 | 16457 | 1 |
| C | 0 | 19111 | 1 |
| D | 0 | 16449 | 1 |
| Mode M9 | |||
|---|---|---|---|
| Quadrant | BADHDUFLAG | Total packets | Discarded packets |
| A | 0 | 3 | 0 |
| B | 0 | 3 | 0 |
| C | 0 | 3 | 0 |
| D | 0 | 3 | 0 |
| Mode SS | |||
|---|---|---|---|
| Quadrant | BADHDUFLAG | Total packets | Discarded packets |
| A | 0 | 154 | 0 |
| B | 0 | 154 | 0 |
| C | 0 | 154 | 0 |
| D | 0 | 154 | 0 |
| Quadrant | Total seconds | Saturated seconds | Saturation percentage |
|---|---|---|---|
| A | 7604 | 138 | 1.814834% |
| B | 7604 | 199 | 2.617044% |
| C | 7604 | 122 | 1.604419% |
| D | 7604 | 170 | 2.235665% |
Noise dominated data is calculated using 1-second bins in cleaned event files. If a bin has >2000 counts, and if more than 50% of those come from <1% of pixels, then it is considered to be noise-dominated and hence unusable.
| Quadrant | # 1 sec bins | Bins with >0 counts | Bins with >2000 counts | High rate bins dominated by noise | Noise dominated (total time) | Noise dominated (detector-on time) | Marked lightcurve |
|---|---|---|---|---|---|---|---|
| A | 7895 | 7605 | 0 | 0 | 0.00% | 0.00% | 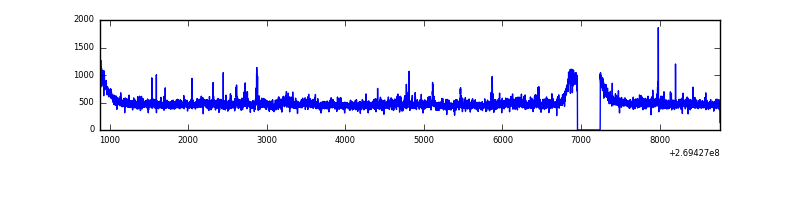 |
| B | 7895 | 7605 | 28 | 28 | 0.35% | 0.37% | 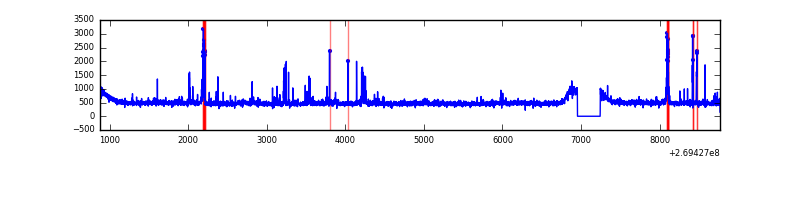 |
| C | 7895 | 7605 | 5 | 5 | 0.06% | 0.07% | 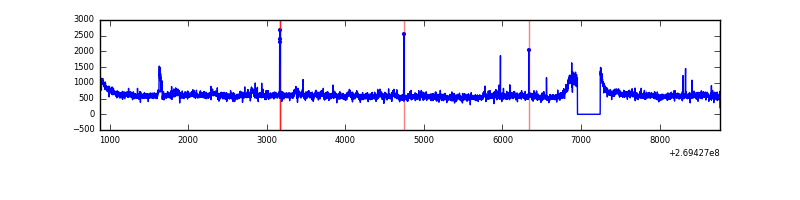 |
| D | 7895 | 7605 | 69 | 69 | 0.87% | 0.91% | 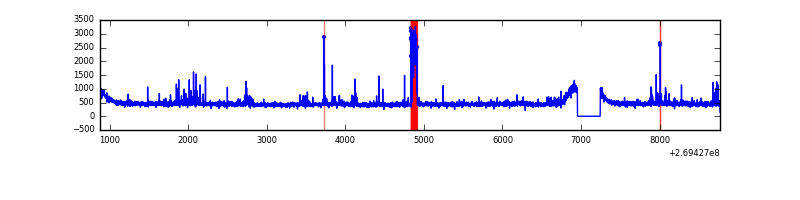 |
Top three noisy pixels from each quadrant. If the there are fewer than three noisy pixels in the level2.evt file, extra rows are filled as -1
| Pixel properties | Quadrant properties | ||||||
|---|---|---|---|---|---|---|---|
| Quadrant | DetID | PixID | Counts | Sigma | Mean | Median | Sigma |
| A | 12 | 189 | 82060 | 420.22 | 938 | 914 | 193.1 |
| A | 15 | 239 | 52688 | 268.12 | 938 | 914 | 193.1 |
| A | 0 | 226 | 8264 | 38.06 | 938 | 914 | 193.1 |
| B | 4 | 48 | 93755 | 509.6 | 933 | 908 | 182.2 |
| B | 3 | 64 | 83034 | 450.76 | 933 | 908 | 182.2 |
| B | 0 | 230 | 23183 | 122.26 | 933 | 908 | 182.2 |
| C | 3 | 233 | 1131409 | 5291.07 | 904 | 909 | 213.7 |
| C | 0 | 207 | 12803 | 55.67 | 904 | 909 | 213.7 |
| C | 13 | 61 | 6524 | 26.28 | 904 | 909 | 213.7 |
| D | 13 | 172 | 184990 | 824.54 | 910 | 885 | 223.3 |
| D | 10 | 70 | 34993 | 152.76 | 910 | 885 | 223.3 |
| D | 2 | 234 | 30592 | 133.05 | 910 | 885 | 223.3 |
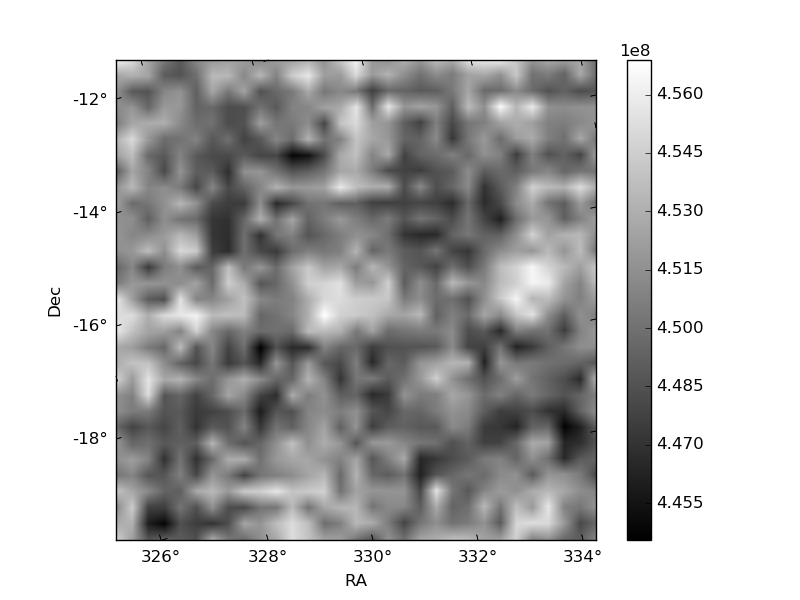
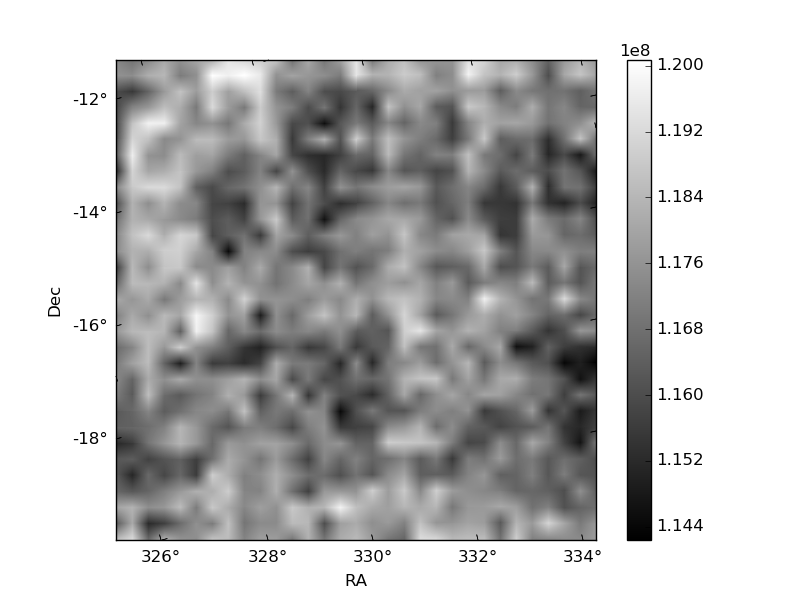
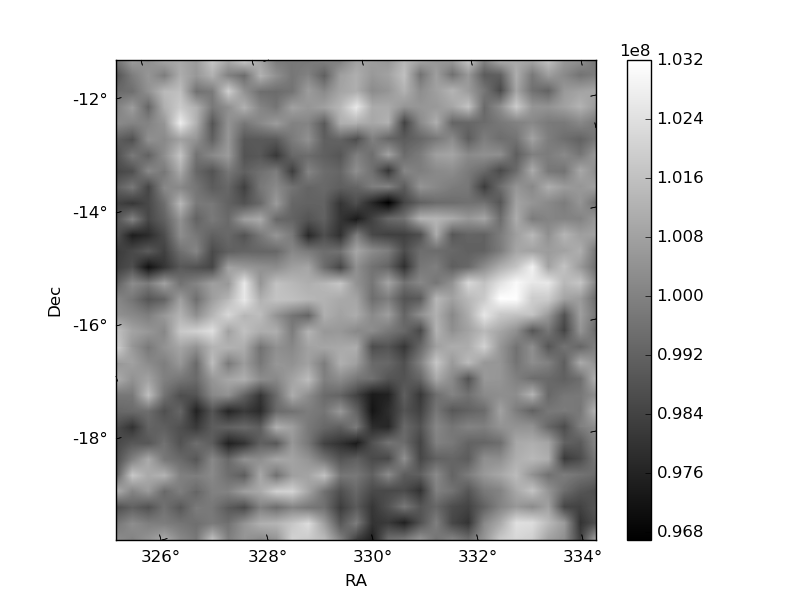
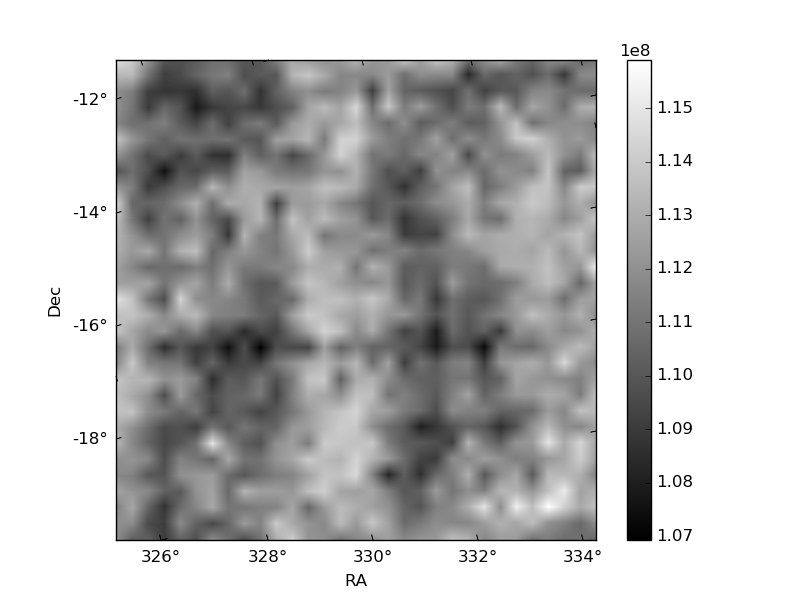
Histogram calculated using DETX and DETY for each event in the final _common_clean file
| Quadrant A | 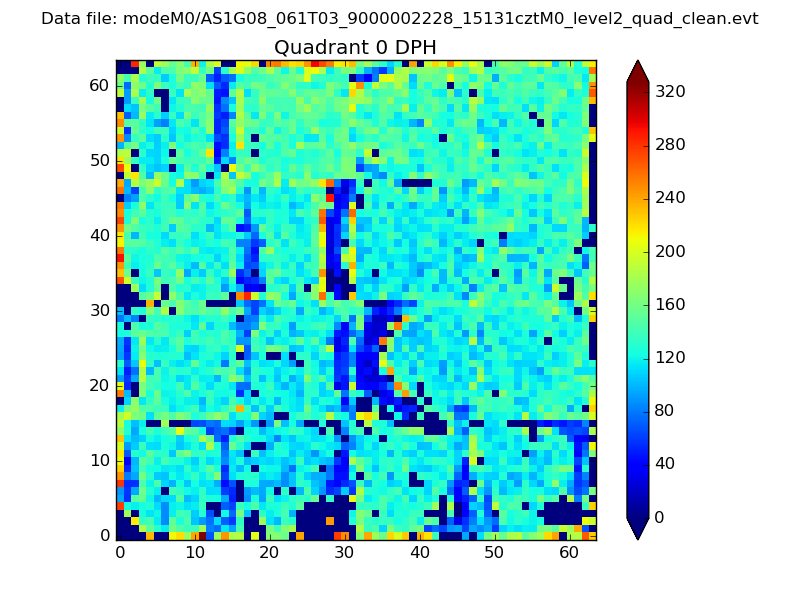 |
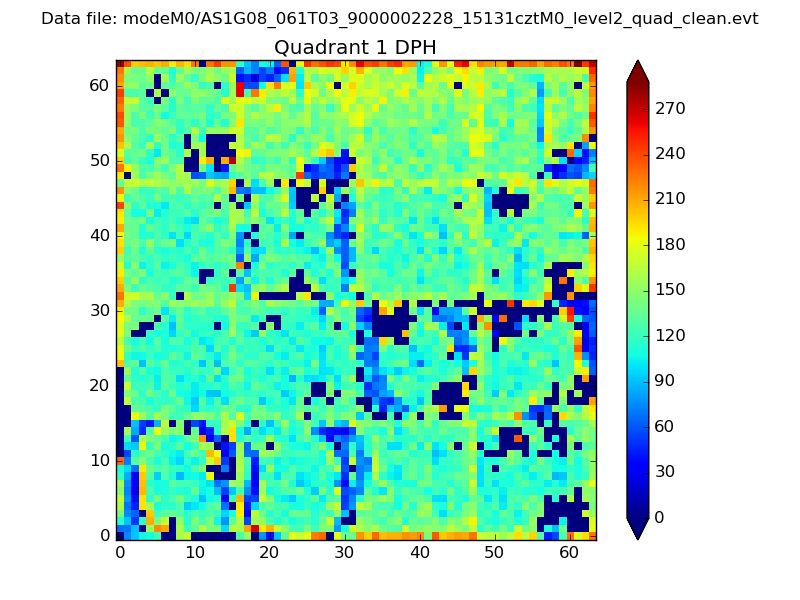 |
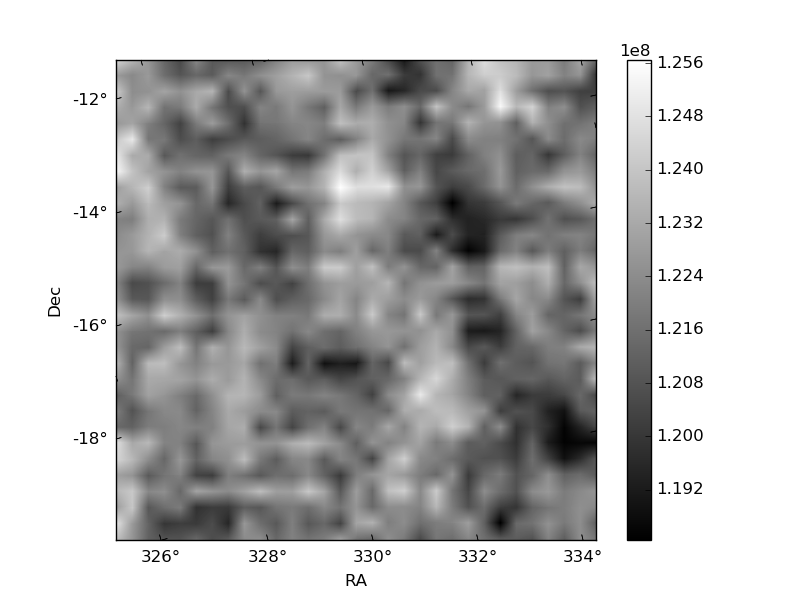
Quadrant B |
|---|---|---|---|
| Quadrant D | 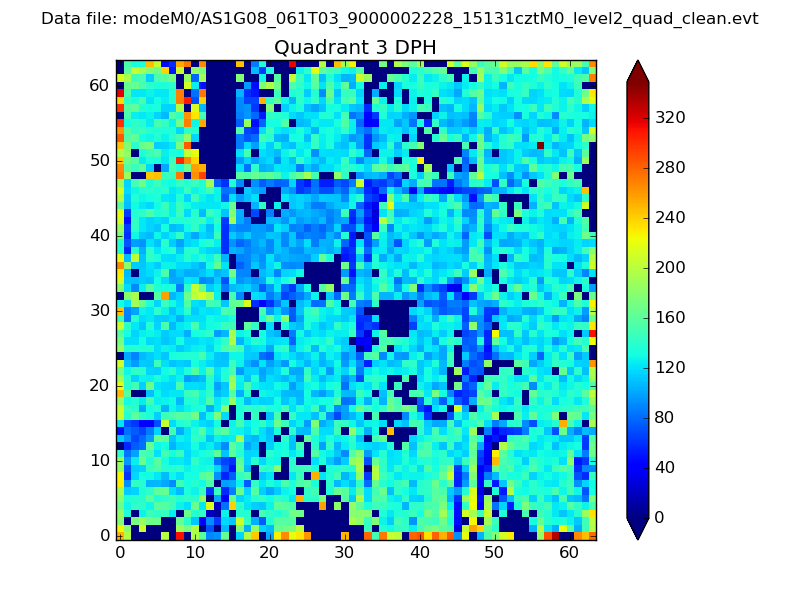 |
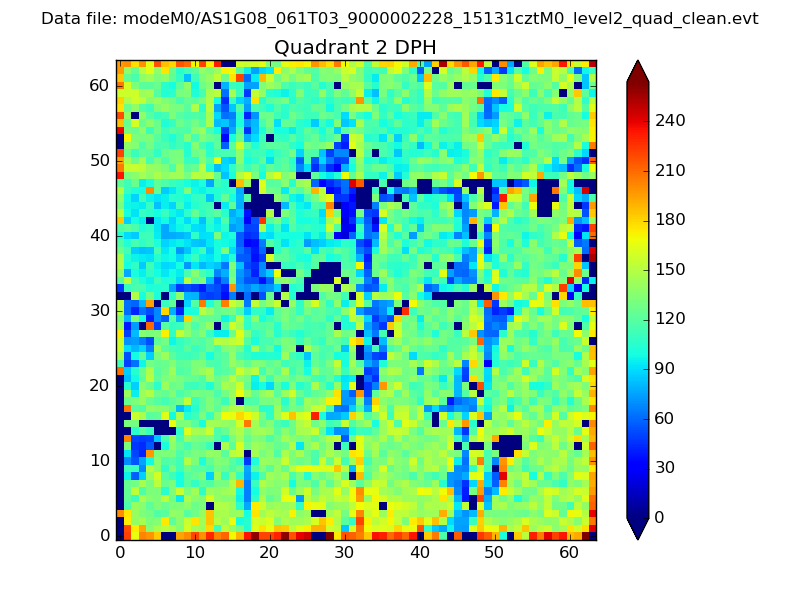 |
Quadrant C |
| Plot type | Count rate plots | Images |
|---|---|---|
| Comparison with Poisson distribution Blue bars denote a histogram of data divided into 1 sec bins. Red curve is a Poisson curve with rate = median count rate of data. |
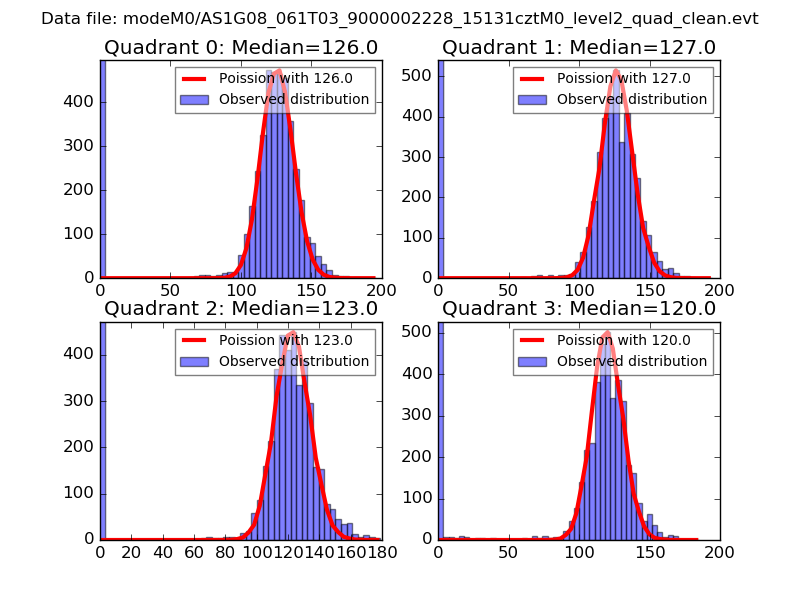 |
 |
| Quadrant-wise count rates Data is divided into 100 sec bins |
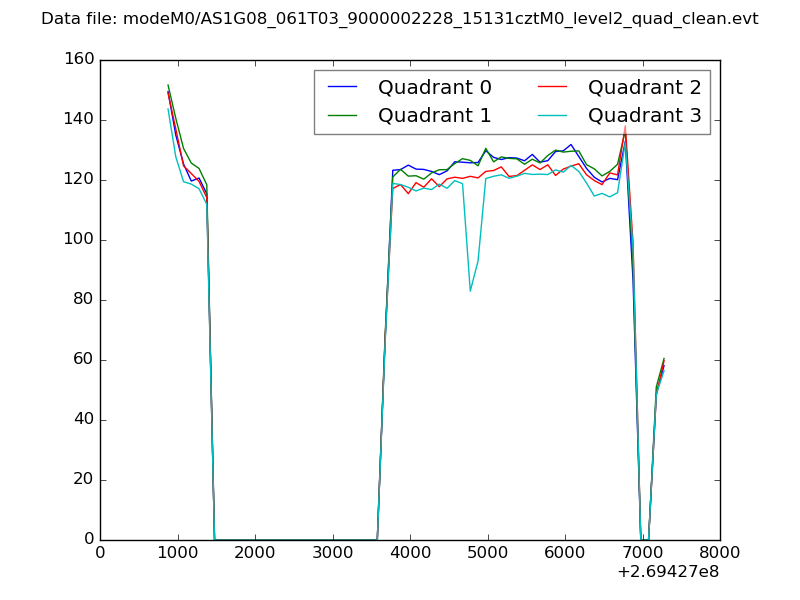 |
|
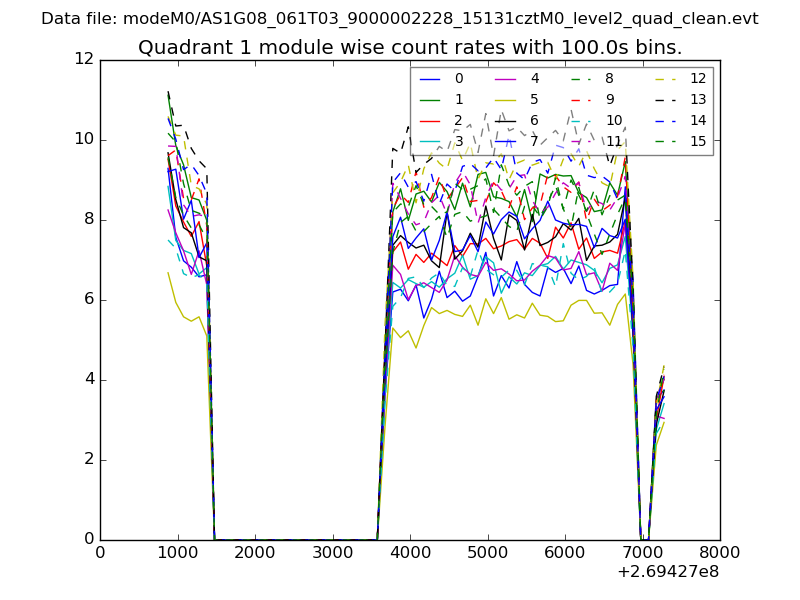
| Module-wise count rates for Quadrant A Data is divided into 100 sec bins |
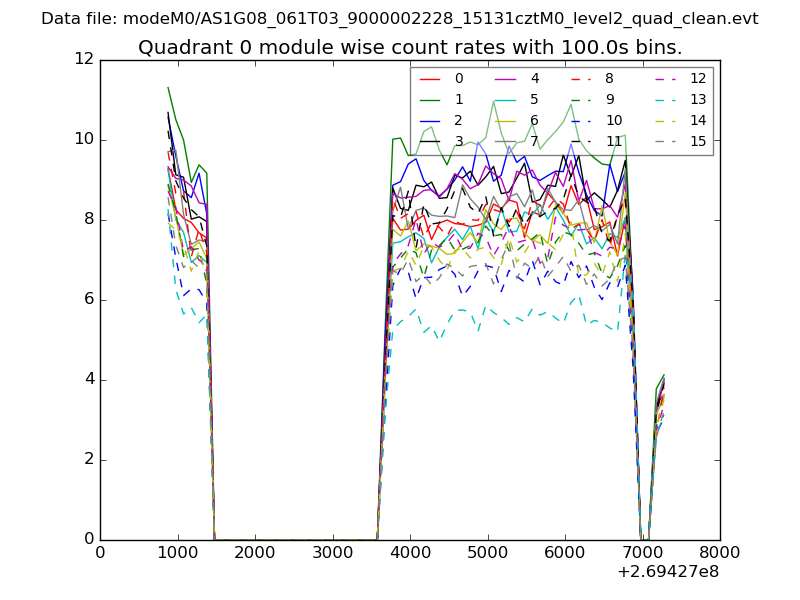 |
 |
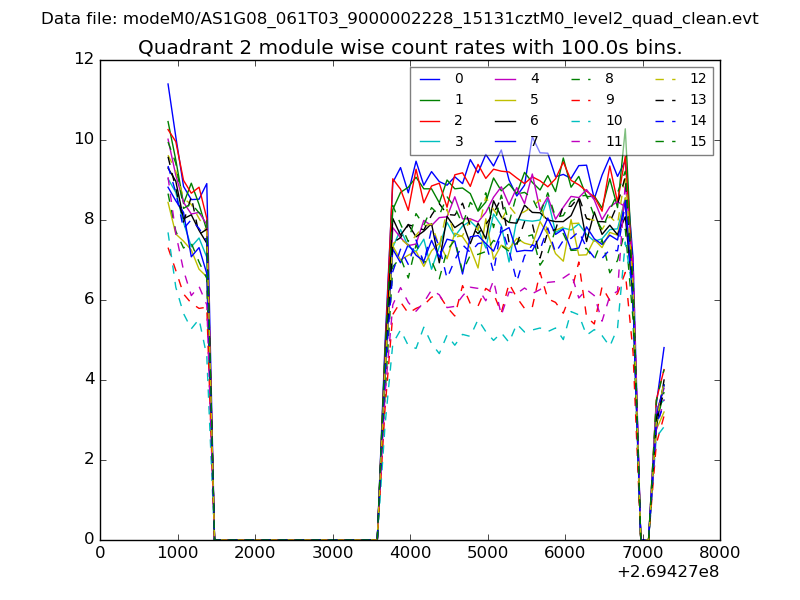
| Module-wise count rates for Quadrant B Data is divided into 100 sec bins |
 |
 |
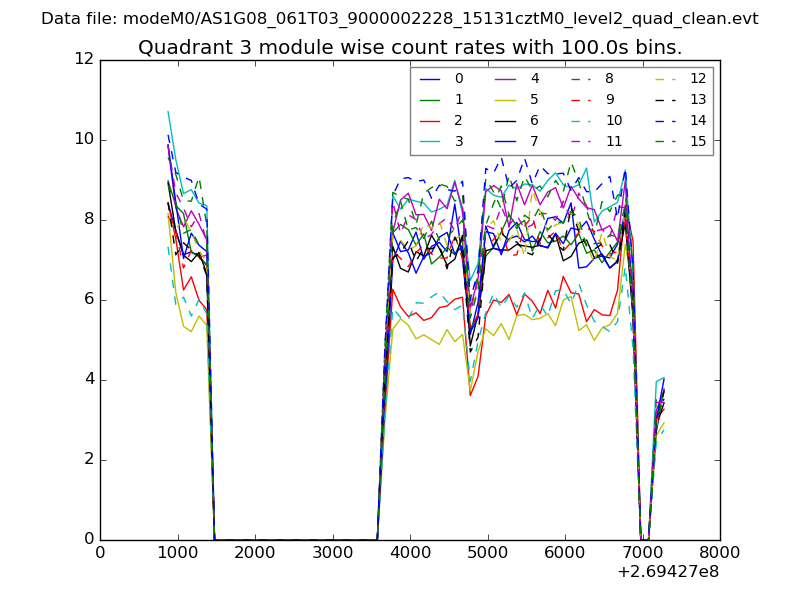
| Module-wise count rates for Quadrant C Data is divided into 100 sec bins |
 |
 |
| Module-wise count rates for Quadrant D Data is divided into 100 sec bins |
 |
 |
| Parameter | Plot |
|---|---|
| CZT HV Monitor | 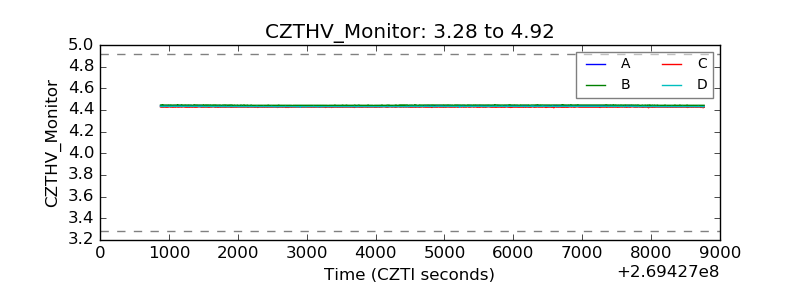 |
| D_VDD | 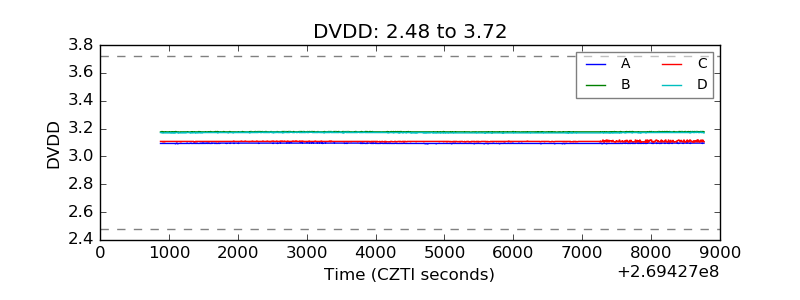 |
| Temperature 1 | 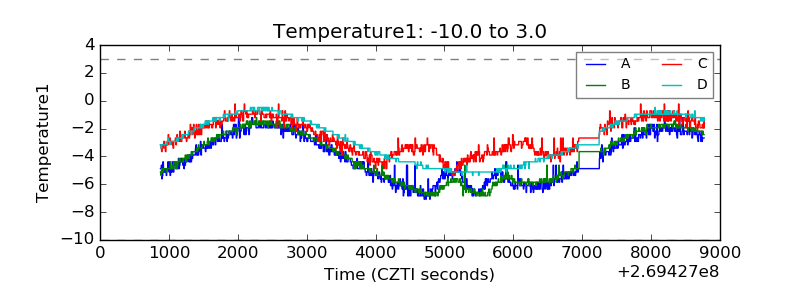 |
| Veto HV Monitor | 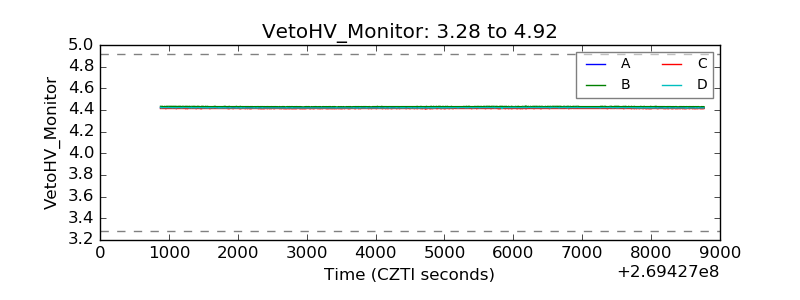 |
| Veto LLD | 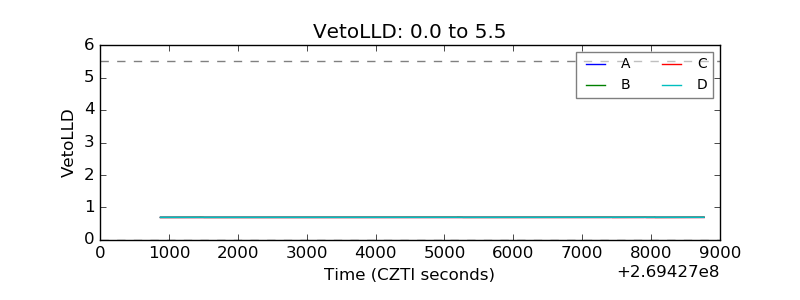 |
| Alpha Counter | 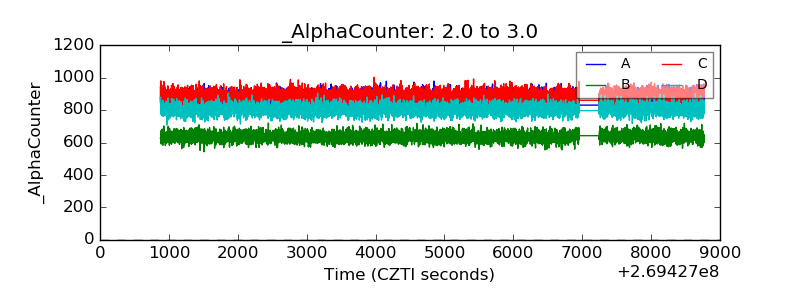 |
| _CPM_Rate | 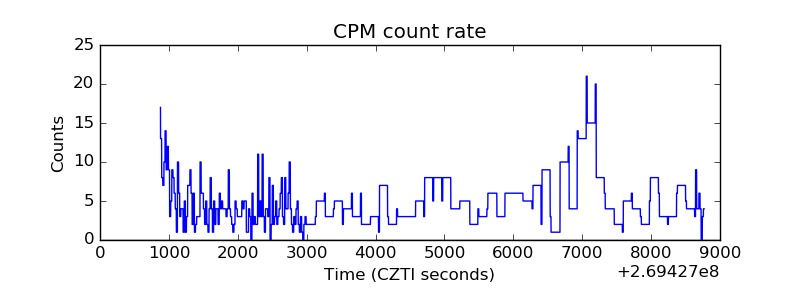 |
| CZT Counter | 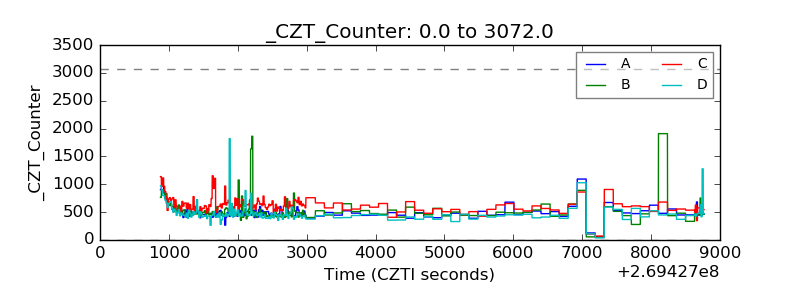 |
| +2.5 Volts monitor |  |
| +5 Volts monitor | 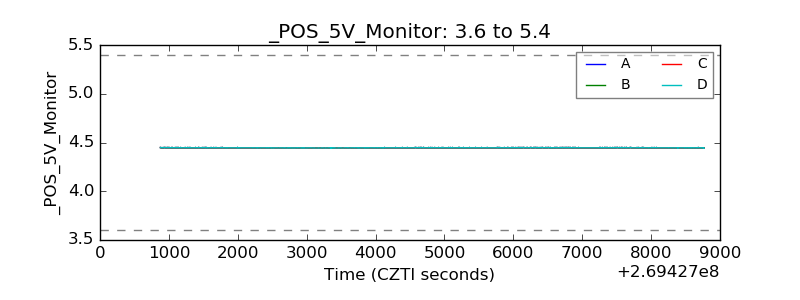 |
| _ROLL_ROT | 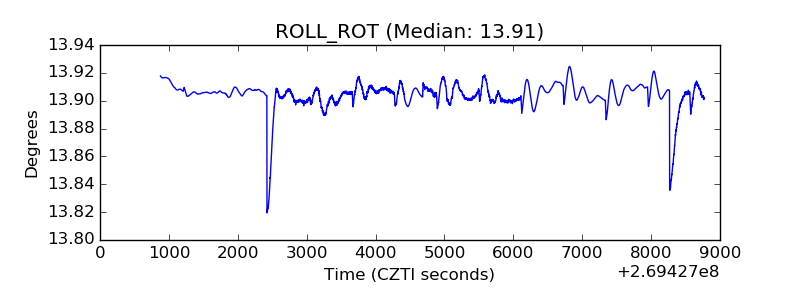 |
| _Roll_DEC | 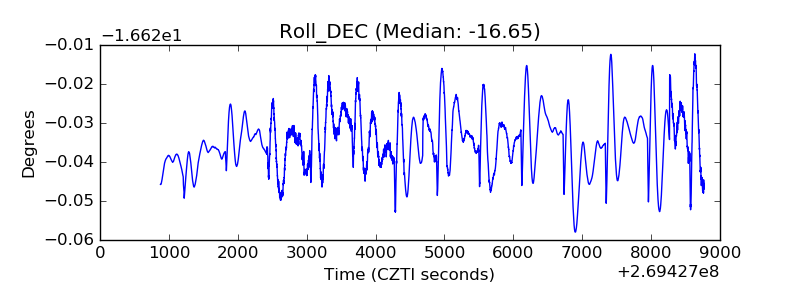 |
| _Roll_RA | 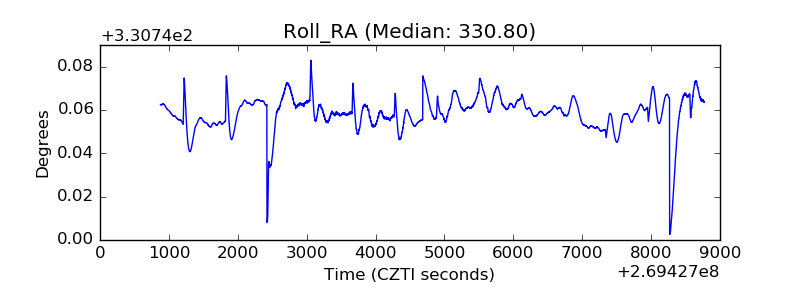 |
| Veto Counter | 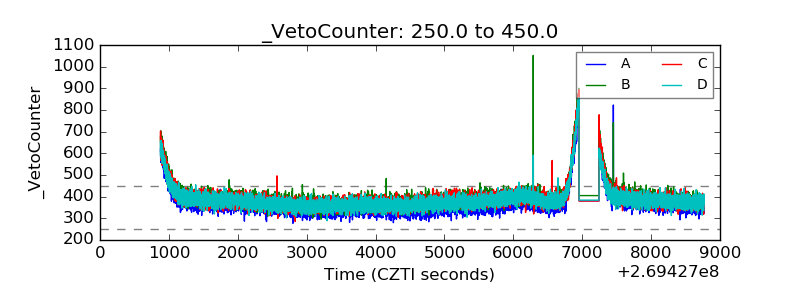 |