| Param | Original file | Final file |
|---|---|---|
| Filename | modeM0/AS1A04_218T08_9000002236cztM0_level2.fits | modeM0/AS1A04_218T08_9000002236cztM0_level2_quad_clean.evt |
| Size (bytes) | 910,353,600 | 864,864,000 |
| Size | 868.2 MB | 824.8 MB |
| Events in quadrant A | 5,497,672 | 5,093,070 |
| Events in quadrant B | 5,358,348 | 5,106,550 |
| Events in quadrant C | 5,497,350 | 4,954,609 |
| Events in quadrant D | 4,746,524 | 4,567,510 |
| Mode SS | |||
|---|---|---|---|
| Quadrant | BADHDUFLAG | Total packets | Discarded packets |
| A | 0 | 1924 | 0 |
| B | 0 | 1924 | 0 |
| C | 0 | 1924 | 0 |
| D | 0 | 1924 | 0 |
| Mode M9 | |||
|---|---|---|---|
| Quadrant | BADHDUFLAG | Total packets | Discarded packets |
| A | 0 | 178 | 0 |
| B | 0 | 178 | 0 |
| C | 0 | 178 | 0 |
| D | 0 | 178 | 0 |
| Mode M0 | |||
|---|---|---|---|
| Quadrant | BADHDUFLAG | Total packets | Discarded packets |
| A | 0 | 216208 | 0 |
| B | 0 | 203091 | 0 |
| C | 0 | 210348 | 0 |
| D | 0 | 203765 | 0 |
| Quadrant | Total seconds | Saturated seconds | Saturation percentage |
|---|---|---|---|
| A | 94399 | 1126 | 1.192809% |
| B | 94399 | 1508 | 1.597475% |
| C | 94399 | 845 | 0.895137% |
| D | 94399 | 1107 | 1.172682% |
Noise dominated data is calculated using 1-second bins in cleaned event files. If a bin has >2000 counts, and if more than 50% of those come from <1% of pixels, then it is considered to be noise-dominated and hence unusable.
| Quadrant | # 1 sec bins | Bins with >0 counts | Bins with >2000 counts | High rate bins dominated by noise | Noise dominated (total time) | Noise dominated (detector-on time) | Marked lightcurve |
|---|---|---|---|---|---|---|---|
| A | 112184 | 94394 | 0 | 0 | 0.00% | 0.00% |  |
| B | 112184 | 94386 | 0 | 0 | 0.00% | 0.00% | 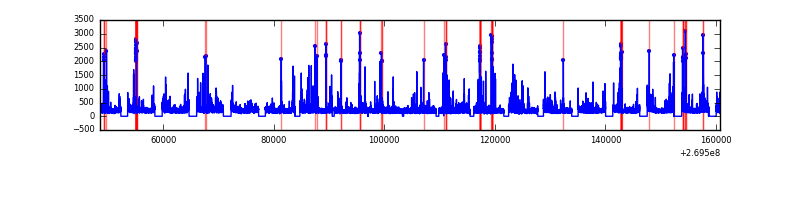 |
| C | 112184 | 94390 | 0 | 0 | 0.00% | 0.00% |  |
| D | 112184 | 94388 | 0 | 0 | 0.00% | 0.00% | 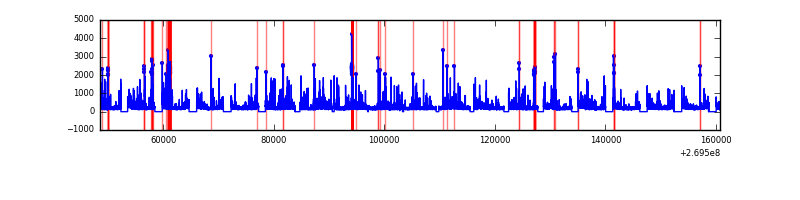 |
Top three noisy pixels from each quadrant. If the there are fewer than three noisy pixels in the level2.evt file, extra rows are filled as -1
| Pixel properties | Quadrant properties | ||||||
|---|---|---|---|---|---|---|---|
| Quadrant | DetID | PixID | Counts | Sigma | Mean | Median | Sigma |
| A | 0 | 29 | 5308 | 11.22 | 1431 | 1345 | 353.3 |
| A | 7 | 110 | 4364 | 8.55 | 1431 | 1345 | 353.3 |
| A | 9 | 19 | 4107 | 7.82 | 1431 | 1345 | 353.3 |
| B | 2 | 9 | 4601 | 11.91 | 1416 | 1356 | 272.3 |
| B | 5 | 128 | 3521 | 7.95 | 1416 | 1356 | 272.3 |
| B | 2 | 8 | 3443 | 7.66 | 1416 | 1356 | 272.3 |
| C | 12 | 241 | 3874 | 6.72 | 1453 | 1359 | 374.5 |
| C | 3 | 126 | 3737 | 6.35 | 1453 | 1359 | 374.5 |
| C | 9 | 242 | 3682 | 6.2 | 1453 | 1359 | 374.5 |
| D | 6 | 231 | 3575 | 6.47 | 1354 | 1228 | 362.5 |
| D | 3 | 14 | 3511 | 6.3 | 1354 | 1228 | 362.5 |
| D | 6 | 67 | 3349 | 5.85 | 1354 | 1228 | 362.5 |
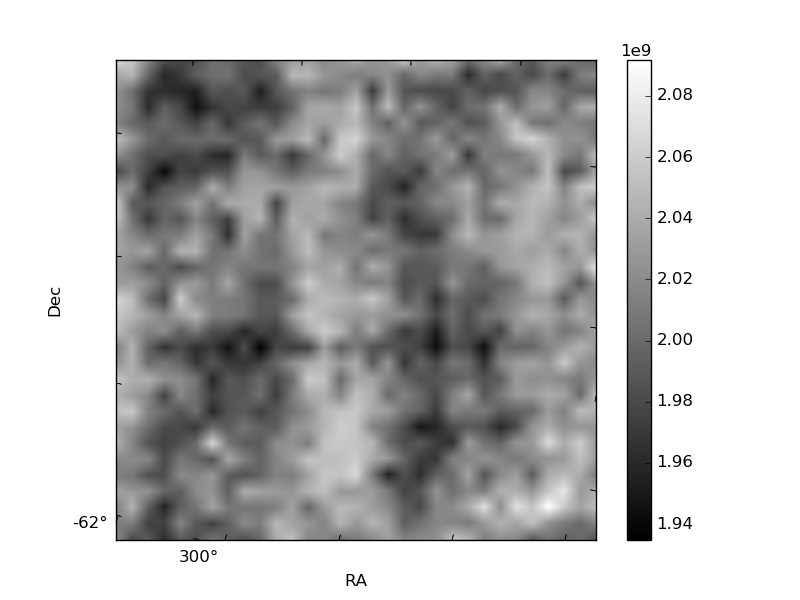
Histogram calculated using DETX and DETY for each event in the final _common_clean file
| Quadrant A | 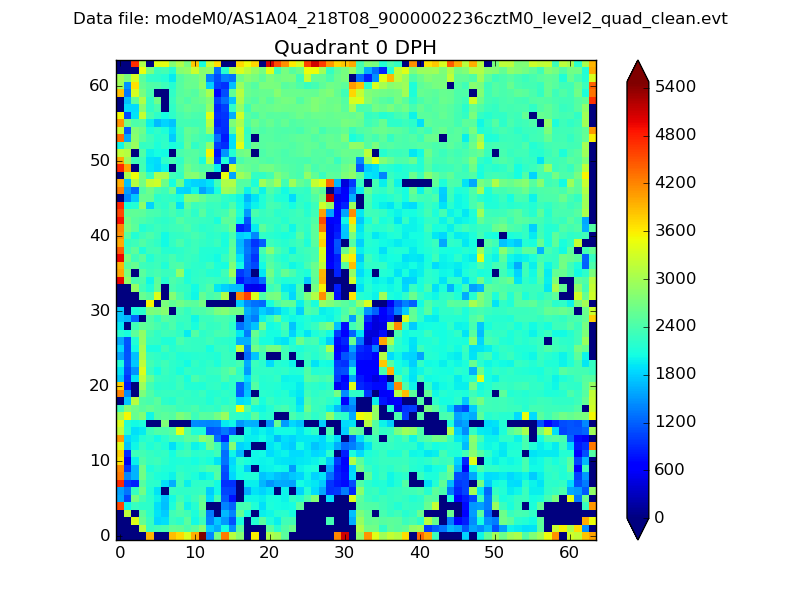 |
 |
Quadrant B |
|---|---|---|---|
| Quadrant D |  |
 |
Quadrant C |
| Plot type | Count rate plots | Images |
|---|---|---|
| Comparison with Poisson distribution Blue bars denote a histogram of data divided into 1 sec bins. Red curve is a Poisson curve with rate = median count rate of data. |
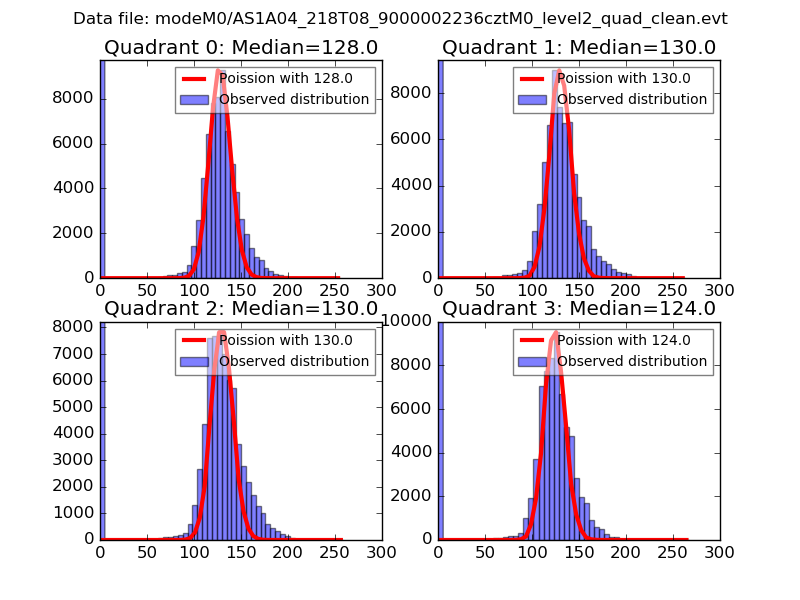 |
 |
| Quadrant-wise count rates Data is divided into 100 sec bins |
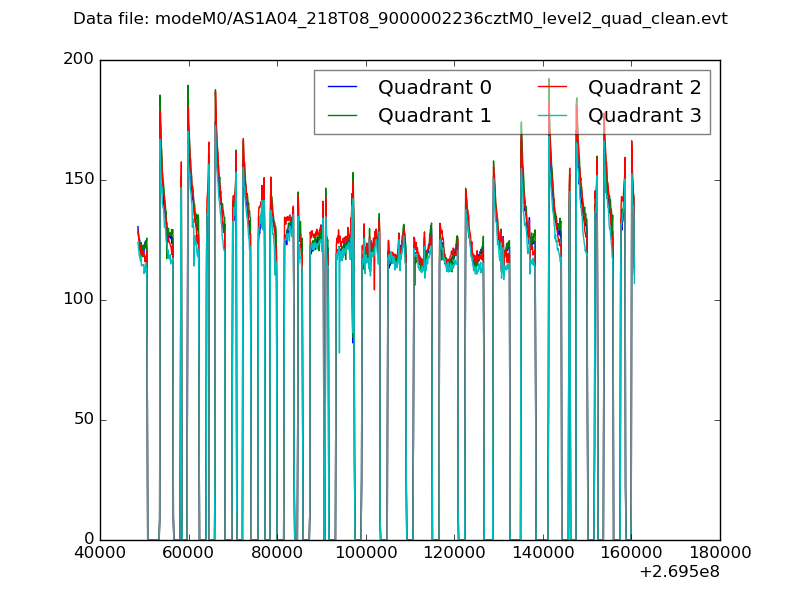 |
|
| Module-wise count rates for Quadrant A Data is divided into 100 sec bins |
 |
 |
| Module-wise count rates for Quadrant B Data is divided into 100 sec bins |
 |
 |
| Module-wise count rates for Quadrant C Data is divided into 100 sec bins |
 |
 |
| Module-wise count rates for Quadrant D Data is divided into 100 sec bins |
 |
 |
| Parameter | Plot |
|---|---|
| CZT HV Monitor | 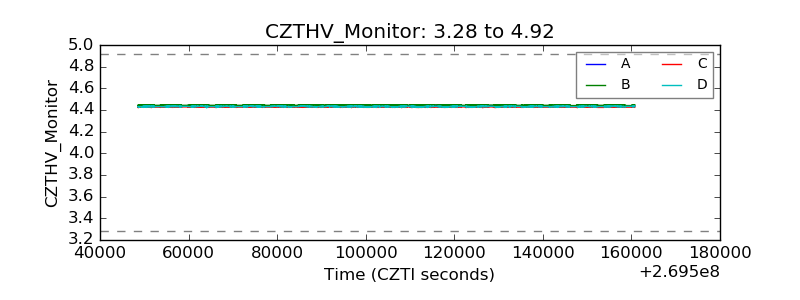 |
| D_VDD |  |
| Temperature 1 |  |
| Veto HV Monitor |  |
| Veto LLD |  |
| Alpha Counter |  |
| _CPM_Rate |  |
| CZT Counter |  |
| +2.5 Volts monitor |  |
| +5 Volts monitor |  |
| _ROLL_ROT |  |
| _Roll_DEC |  |
| _Roll_RA |  |
| Veto Counter |  |