| Param | Original file | Final file |
|---|---|---|
| Filename | modeM0/AS1A04_218T08_9000002236_15150cztM0_level2.evt | modeM0/AS1A04_218T08_9000002236_15150cztM0_level2_quad_clean.evt |
| Size (bytes) | 21,021,120 | 6,338,880 |
| Size | 20.0 MB | 6.0 MB |
| Events in quadrant A | 152,454 | 40,740 |
| Events in quadrant B | 148,852 | 40,739 |
| Events in quadrant C | 160,622 | 40,316 |
| Events in quadrant D | 149,268 | 39,130 |
| Mode SS | |||
|---|---|---|---|
| Quadrant | BADHDUFLAG | Total packets | Discarded packets |
| A | 0 | 6 | 0 |
| B | 0 | 6 | 0 |
| C | 0 | 6 | 0 |
| D | 0 | 6 | 0 |
| Mode M0 | |||
|---|---|---|---|
| Quadrant | BADHDUFLAG | Total packets | Discarded packets |
| A | 0 | 681 | 1 |
| B | 0 | 653 | 0 |
| C | 0 | 691 | 0 |
| D | 0 | 682 | 0 |
| Quadrant | Total seconds | Saturated seconds | Saturation percentage |
|---|---|---|---|
| A | 320 | 0 | 0.000000% |
| B | 320 | 0 | 0.000000% |
| C | 320 | 0 | 0.000000% |
| D | 320 | 1 | 0.312500% |
Noise dominated data is calculated using 1-second bins in cleaned event files. If a bin has >2000 counts, and if more than 50% of those come from <1% of pixels, then it is considered to be noise-dominated and hence unusable.
| Quadrant | # 1 sec bins | Bins with >0 counts | Bins with >2000 counts | High rate bins dominated by noise | Noise dominated (total time) | Noise dominated (detector-on time) | Marked lightcurve |
|---|---|---|---|---|---|---|---|
| A | 321 | 321 | 0 | 0 | 0.00% | 0.00% | 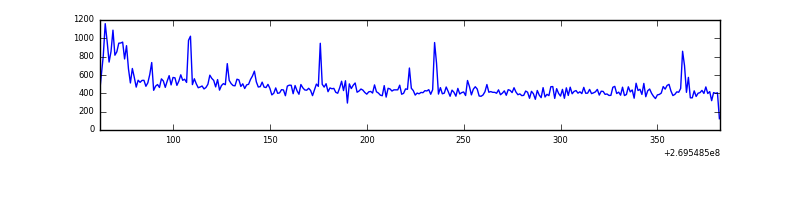 |
| B | 321 | 321 | 0 | 0 | 0.00% | 0.00% | 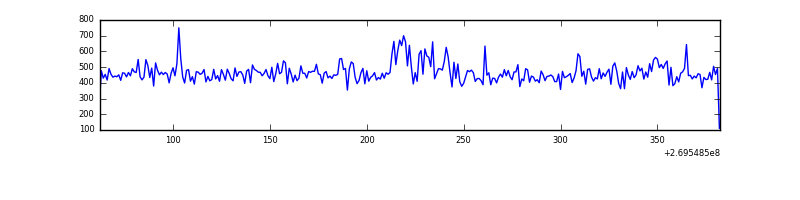 |
| C | 321 | 321 | 0 | 0 | 0.00% | 0.00% | 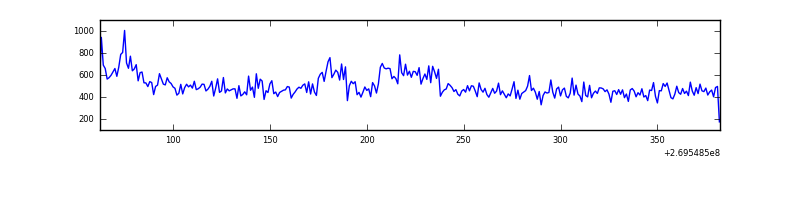 |
| D | 321 | 321 | 1 | 1 | 0.31% | 0.31% | 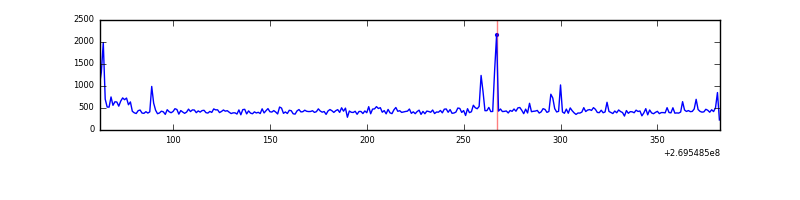 |
Top three noisy pixels from each quadrant. If the there are fewer than three noisy pixels in the level2.evt file, extra rows are filled as -1
| Pixel properties | Quadrant properties | ||||||
|---|---|---|---|---|---|---|---|
| Quadrant | DetID | PixID | Counts | Sigma | Mean | Median | Sigma |
| A | 15 | 239 | 15921 | 1732.17 | 34 | 34 | 9.2 |
| A | 12 | 189 | 2158 | 231.58 | 34 | 34 | 9.2 |
| A | 0 | 226 | 274 | 26.17 | 34 | 34 | 9.2 |
| B | 0 | 190 | 6306 | 694.1 | 35 | 34 | 9.0 |
| B | 3 | 64 | 1145 | 122.95 | 35 | 34 | 9.0 |
| B | 4 | 173 | 1042 | 111.55 | 35 | 34 | 9.0 |
| C | 3 | 233 | 30733 | 3219.65 | 33 | 33 | 9.5 |
| C | 14 | 234 | 374 | 35.76 | 33 | 33 | 9.5 |
| C | 13 | 61 | 237 | 21.39 | 33 | 33 | 9.5 |
| D | 2 | 16 | 7043 | 711.06 | 32 | 31 | 9.9 |
| D | 7 | 55 | 6845 | 690.98 | 32 | 31 | 9.9 |
| D | 10 | 70 | 6639 | 670.09 | 32 | 31 | 9.9 |
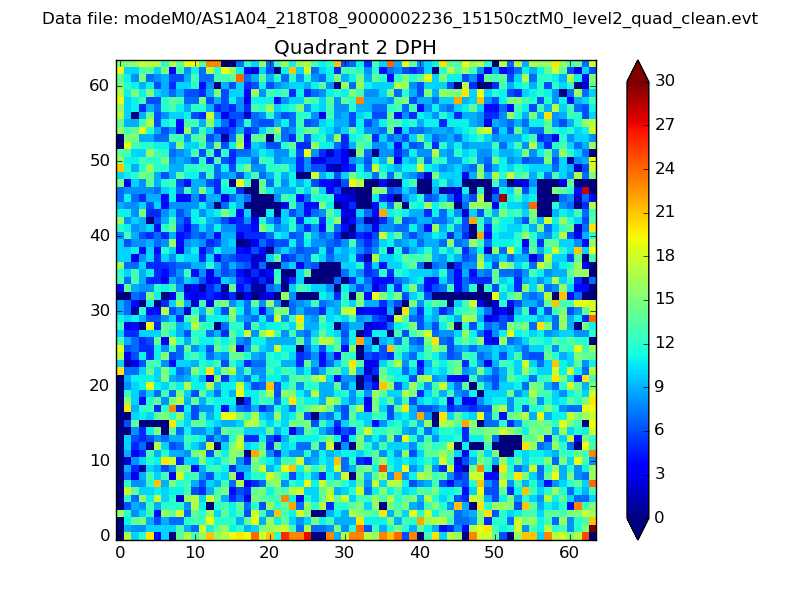
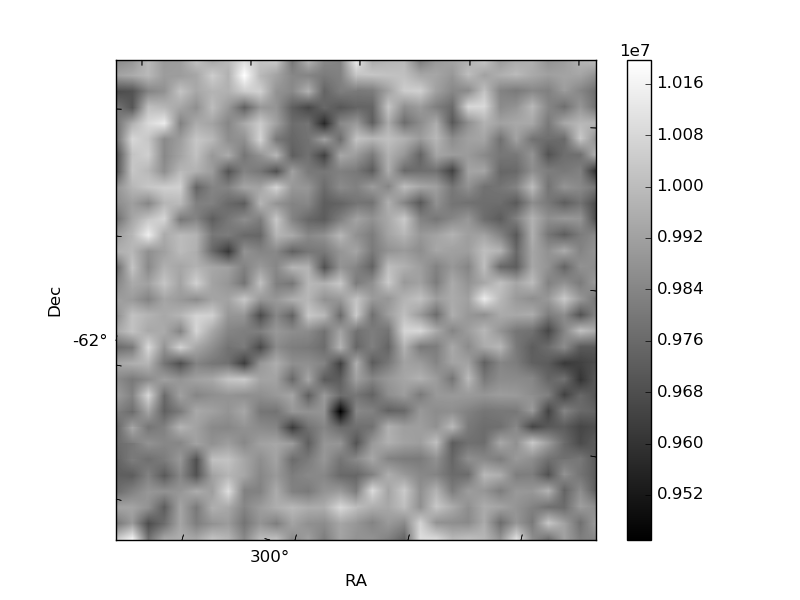
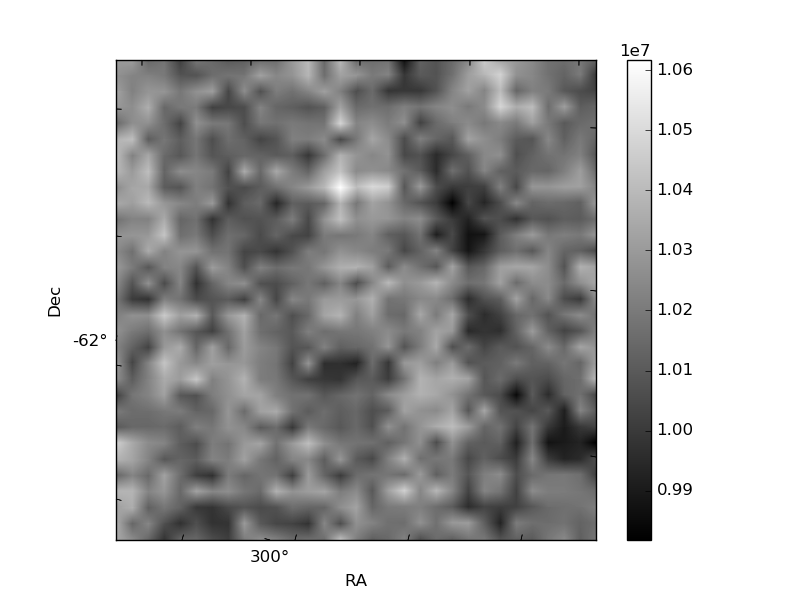
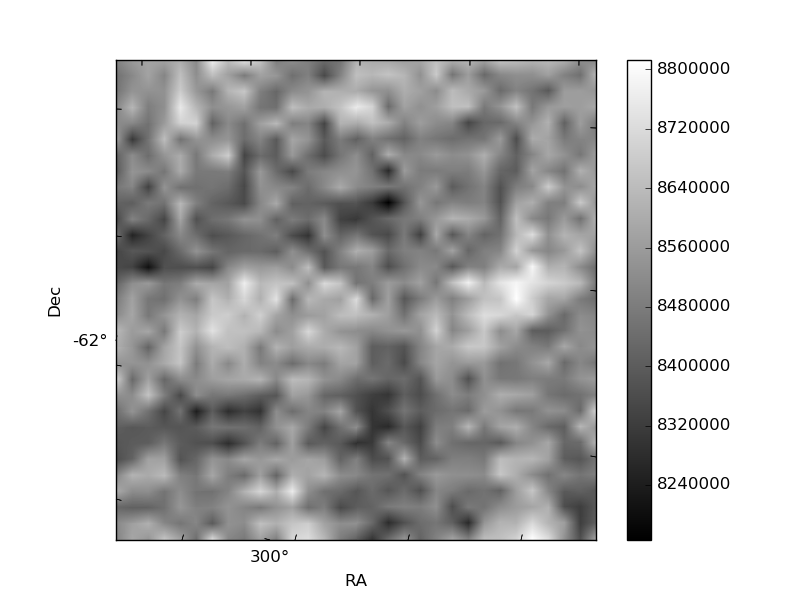
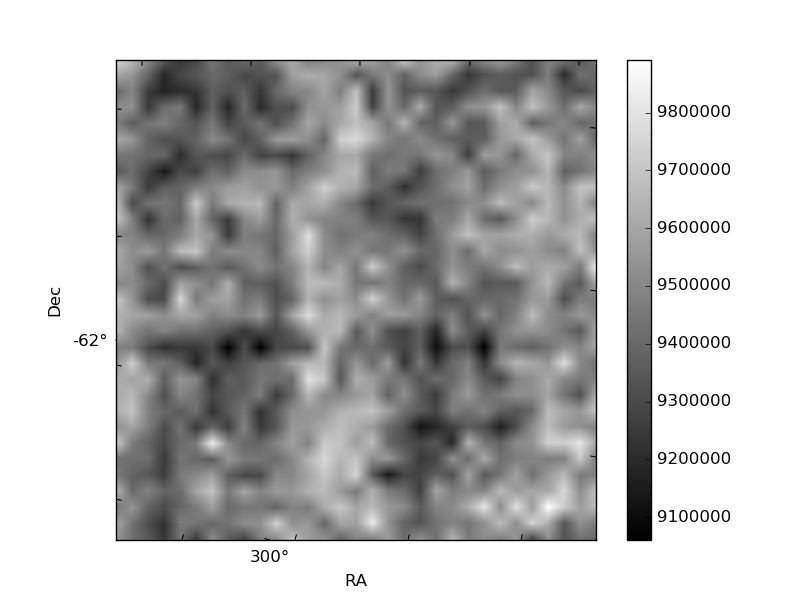
Histogram calculated using DETX and DETY for each event in the final _common_clean file
| Quadrant A | 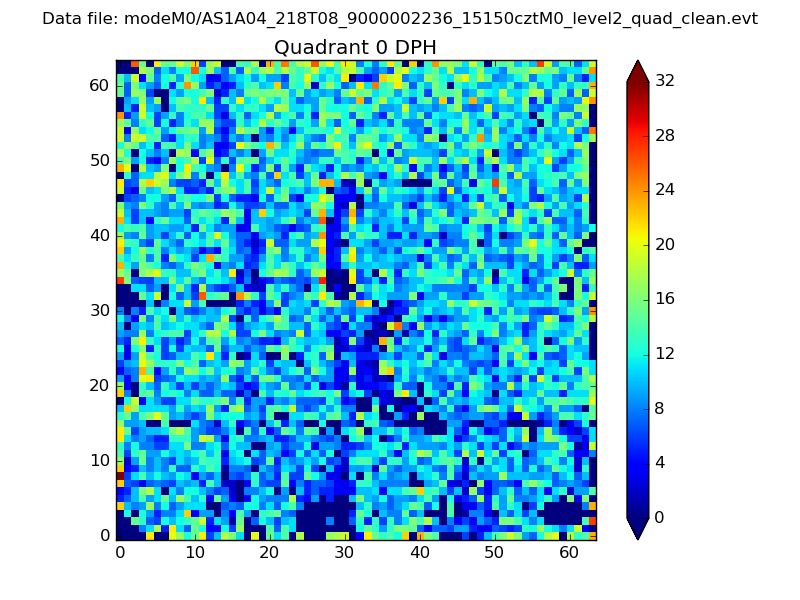 |
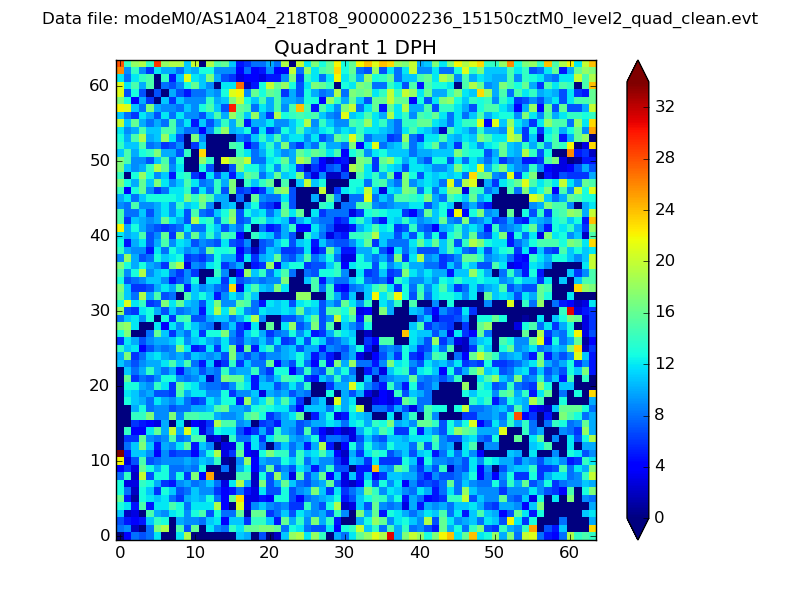 |
Quadrant B |
|---|---|---|---|
| Quadrant D | 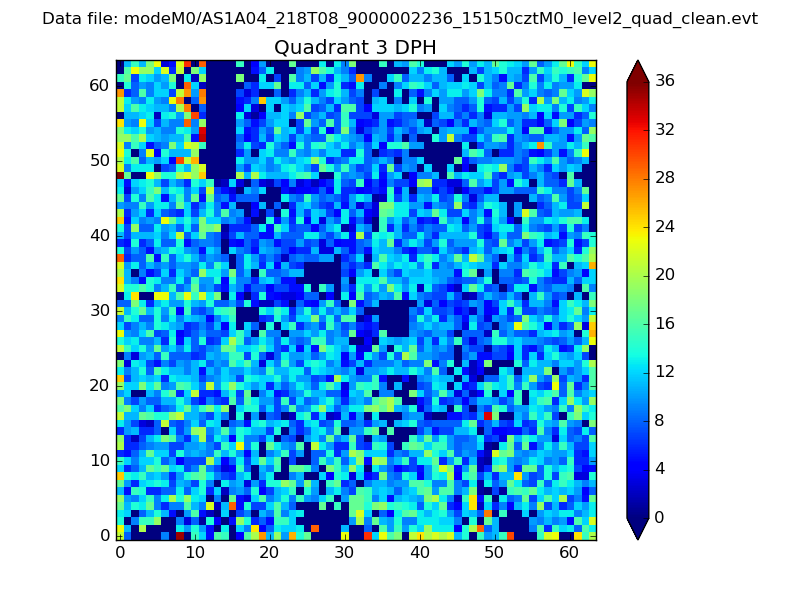 |
 |
Quadrant C |
| Plot type | Count rate plots | Images |
|---|---|---|
| Comparison with Poisson distribution Blue bars denote a histogram of data divided into 1 sec bins. Red curve is a Poisson curve with rate = median count rate of data. |
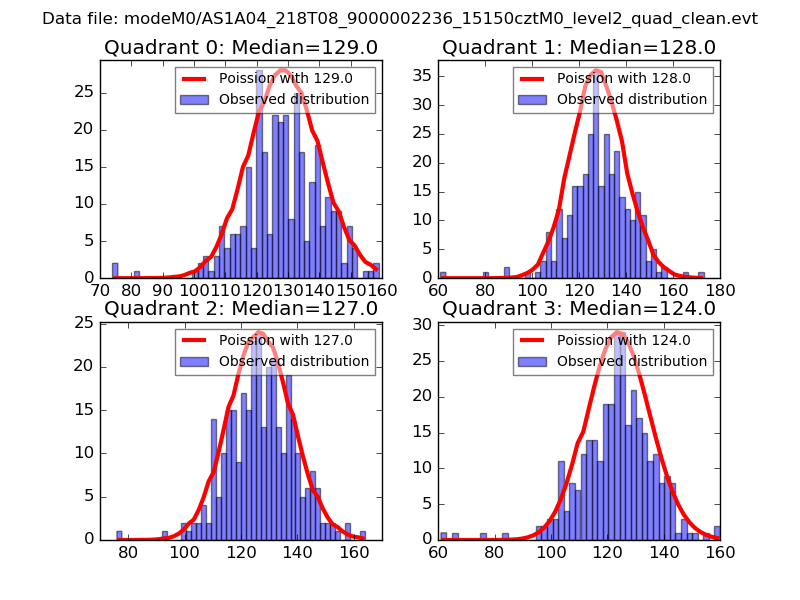 |
 |
| Quadrant-wise count rates Data is divided into 100 sec bins |
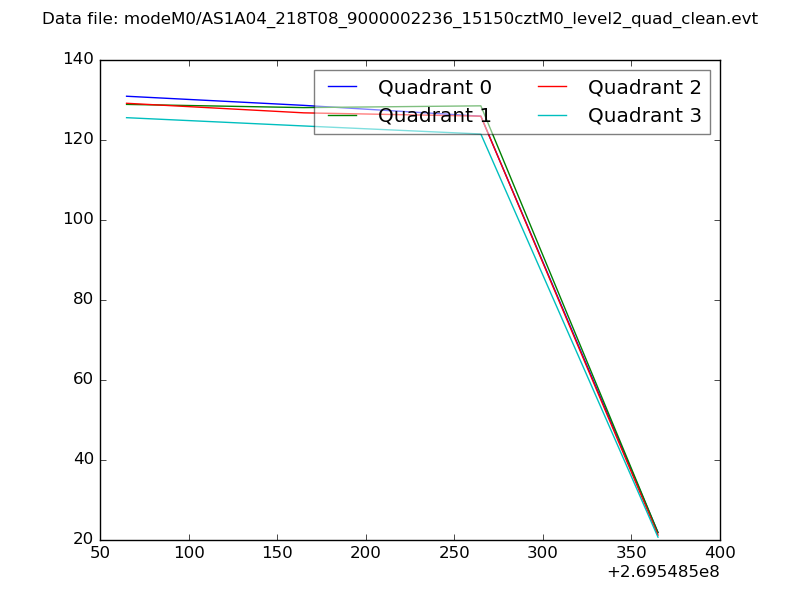 |
|
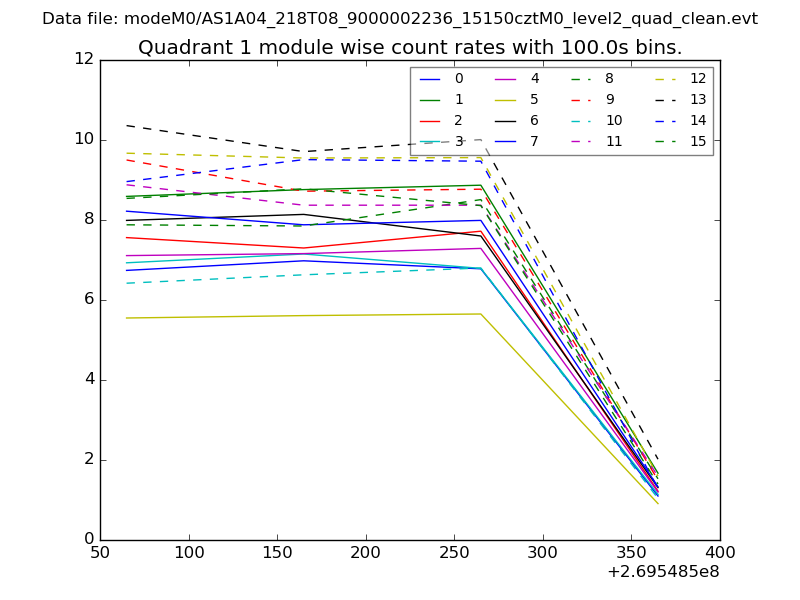
| Module-wise count rates for Quadrant A Data is divided into 100 sec bins |
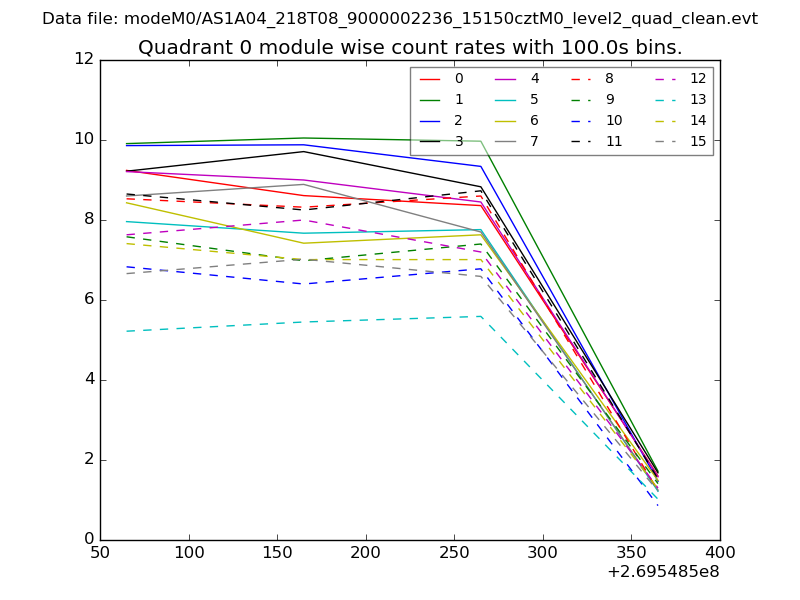 |
 |
| Module-wise count rates for Quadrant B Data is divided into 100 sec bins |
 |
 |
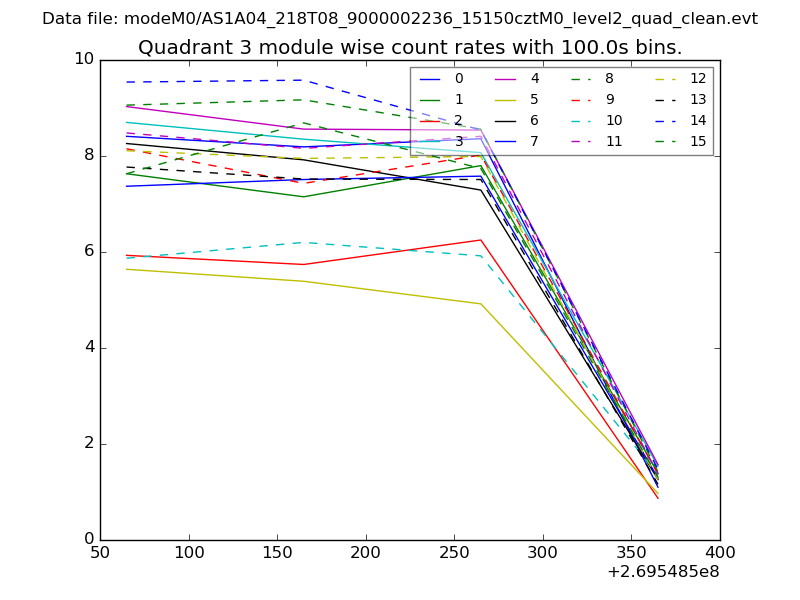
| Module-wise count rates for Quadrant C Data is divided into 100 sec bins |
 |
 |
| Module-wise count rates for Quadrant D Data is divided into 100 sec bins |
 |
 |
| Parameter | Plot |
|---|---|
| CZT HV Monitor | 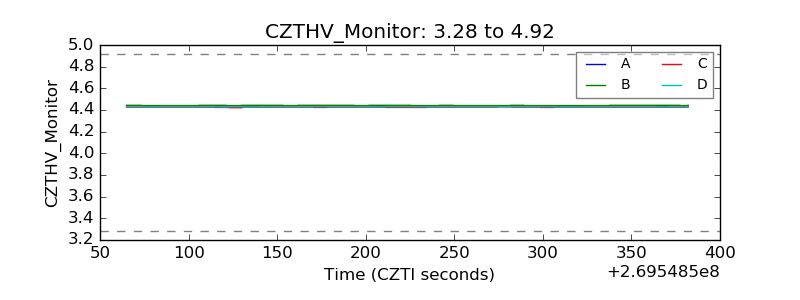 |
| D_VDD | 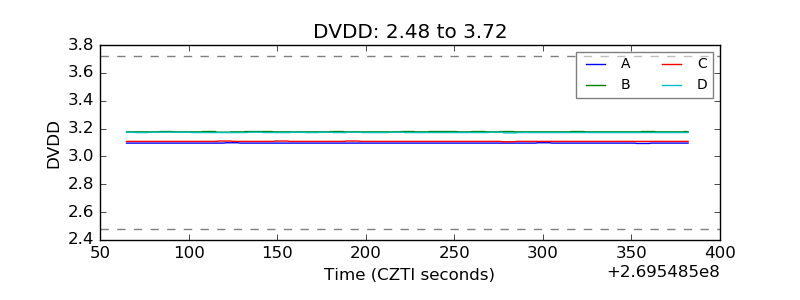 |
| Temperature 1 | 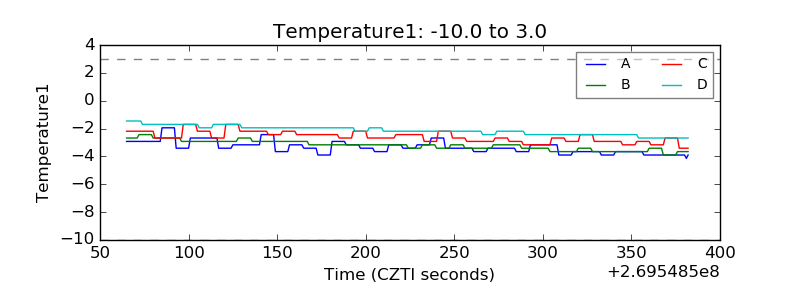 |
| Veto HV Monitor | 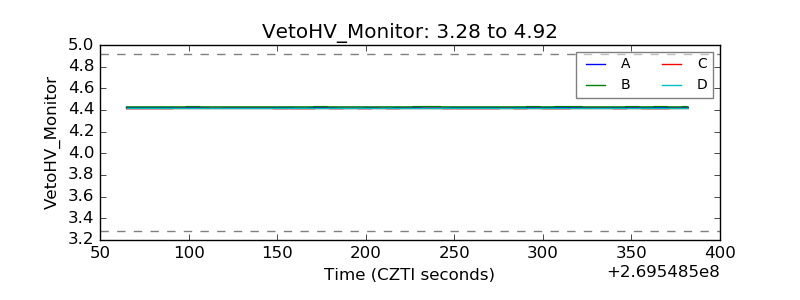 |
| Veto LLD | 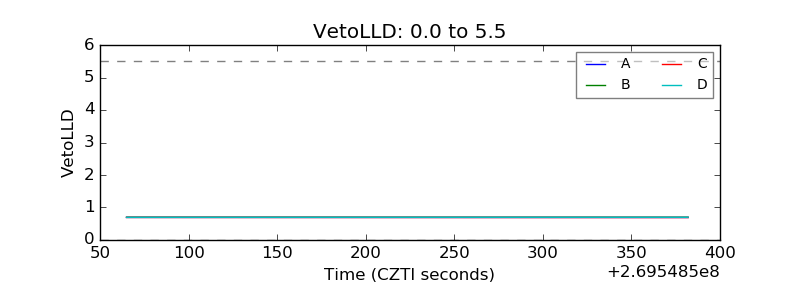 |
| Alpha Counter | 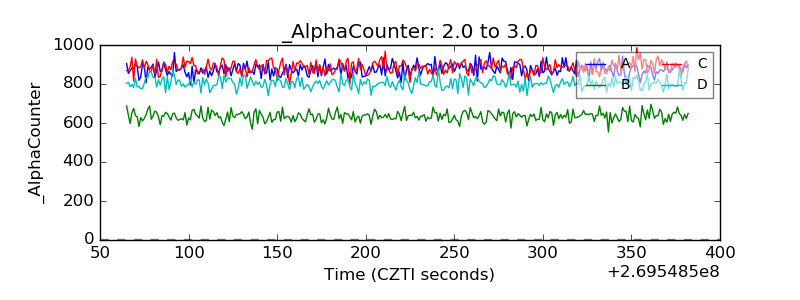 |
| _CPM_Rate | 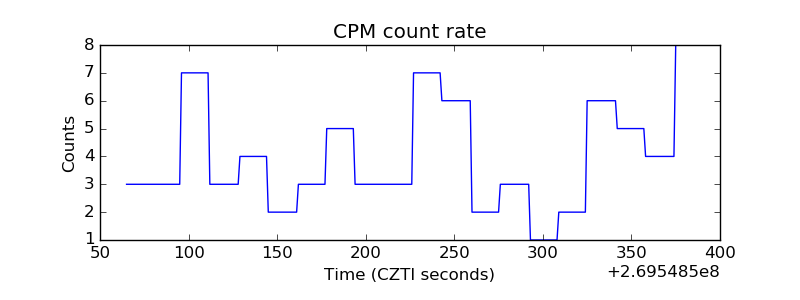 |
| CZT Counter |  |
| +2.5 Volts monitor | 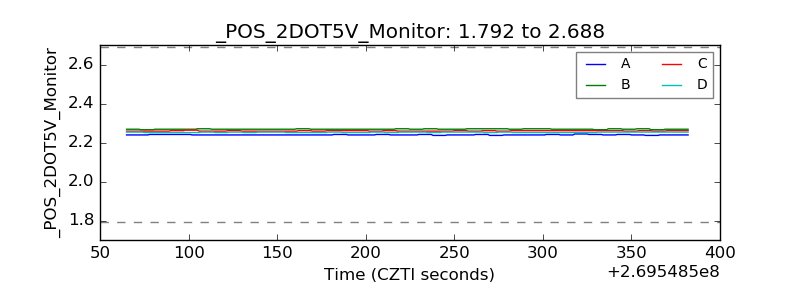 |
| +5 Volts monitor | 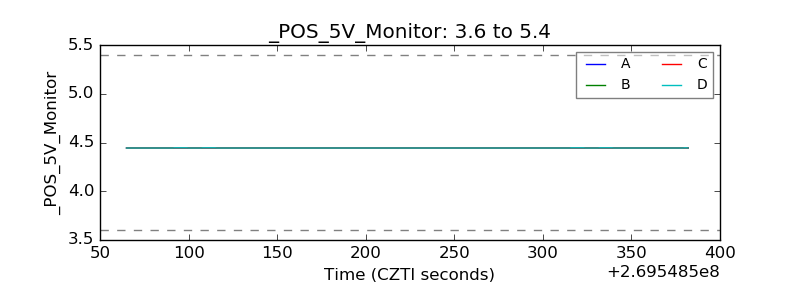 |
| _ROLL_ROT | 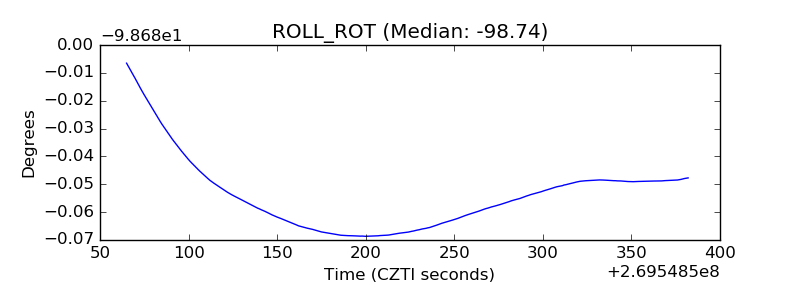 |
| _Roll_DEC | 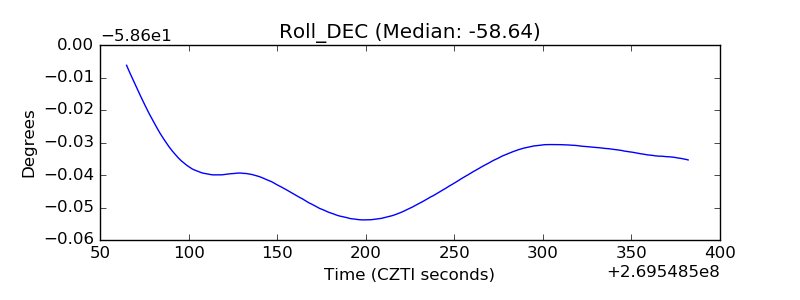 |
| _Roll_RA |  |
| Veto Counter | 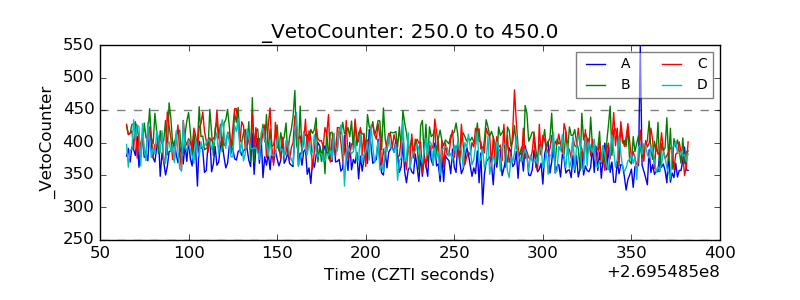 |