| Param | Original file | Final file |
|---|---|---|
| Filename | modeM0/AS1A04_218T08_9000002236_15152cztM0_level2.evt | modeM0/AS1A04_218T08_9000002236_15152cztM0_level2_quad_clean.evt |
| Size (bytes) | 358,421,760 | 70,283,520 |
| Size | 341.8 MB | 67.0 MB |
| Events in quadrant A | 2,666,746 | 450,193 |
| Events in quadrant B | 2,543,857 | 458,076 |
| Events in quadrant C | 2,728,167 | 447,018 |
| Events in quadrant D | 2,577,209 | 423,841 |
| Mode SS | |||
|---|---|---|---|
| Quadrant | BADHDUFLAG | Total packets | Discarded packets |
| A | 0 | 102 | 0 |
| B | 0 | 102 | 0 |
| C | 0 | 102 | 0 |
| D | 0 | 102 | 0 |
| Mode M9 | |||
|---|---|---|---|
| Quadrant | BADHDUFLAG | Total packets | Discarded packets |
| A | 0 | 12 | 0 |
| B | 0 | 12 | 0 |
| C | 0 | 12 | 0 |
| D | 0 | 12 | 0 |
| Mode M0 | |||
|---|---|---|---|
| Quadrant | BADHDUFLAG | Total packets | Discarded packets |
| A | 0 | 11192 | 2 |
| B | 0 | 10824 | 1 |
| C | 0 | 11222 | 1 |
| D | 0 | 11232 | 1 |
| Quadrant | Total seconds | Saturated seconds | Saturation percentage |
|---|---|---|---|
| A | 4975 | 32 | 0.643216% |
| B | 4975 | 50 | 1.005025% |
| C | 4975 | 13 | 0.261307% |
| D | 4975 | 44 | 0.884422% |
Noise dominated data is calculated using 1-second bins in cleaned event files. If a bin has >2000 counts, and if more than 50% of those come from <1% of pixels, then it is considered to be noise-dominated and hence unusable.
| Quadrant | # 1 sec bins | Bins with >0 counts | Bins with >2000 counts | High rate bins dominated by noise | Noise dominated (total time) | Noise dominated (detector-on time) | Marked lightcurve |
|---|---|---|---|---|---|---|---|
| A | 6206 | 4977 | 2 | 2 | 0.03% | 0.04% | 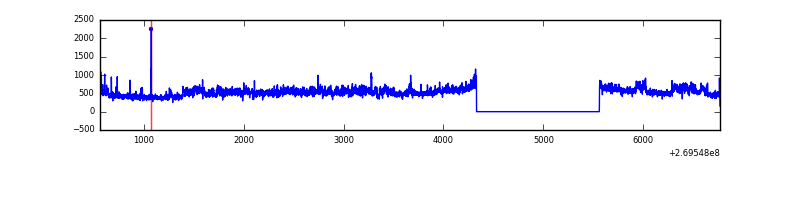 |
| B | 6206 | 4977 | 20 | 20 | 0.32% | 0.40% | 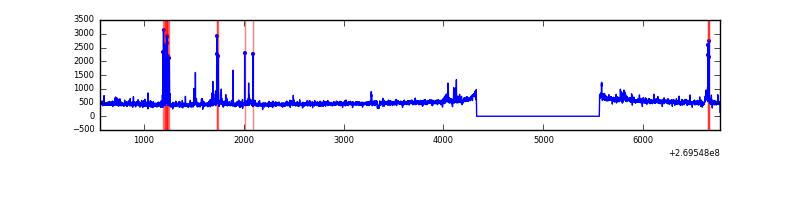 |
| C | 6206 | 4977 | 0 | 0 | 0.00% | 0.00% | 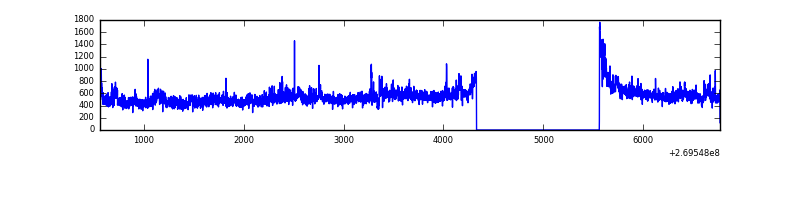 |
| D | 6206 | 4977 | 30 | 30 | 0.48% | 0.60% | 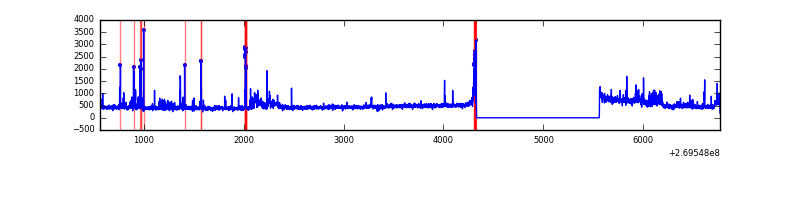 |
Top three noisy pixels from each quadrant. If the there are fewer than three noisy pixels in the level2.evt file, extra rows are filled as -1
| Pixel properties | Quadrant properties | ||||||
|---|---|---|---|---|---|---|---|
| Quadrant | DetID | PixID | Counts | Sigma | Mean | Median | Sigma |
| A | 15 | 239 | 349566 | 2938.3 | 590 | 577 | 118.8 |
| A | 12 | 189 | 37421 | 310.2 | 590 | 577 | 118.8 |
| A | 13 | 248 | 5564 | 41.98 | 590 | 577 | 118.8 |
| B | 3 | 64 | 111472 | 978.98 | 598 | 583 | 113.3 |
| B | 0 | 229 | 60983 | 533.24 | 598 | 583 | 113.3 |
| B | 12 | 111 | 12575 | 105.87 | 598 | 583 | 113.3 |
| C | 3 | 233 | 470542 | 3520.15 | 578 | 582 | 133.5 |
| C | 13 | 61 | 4123 | 26.52 | 578 | 582 | 133.5 |
| C | 14 | 234 | 2104 | 11.4 | 578 | 582 | 133.5 |
| D | 2 | 16 | 236581 | 1702.1 | 569 | 552 | 138.7 |
| D | 10 | 70 | 44738 | 318.64 | 569 | 552 | 138.7 |
| D | 2 | 33 | 43907 | 312.65 | 569 | 552 | 138.7 |
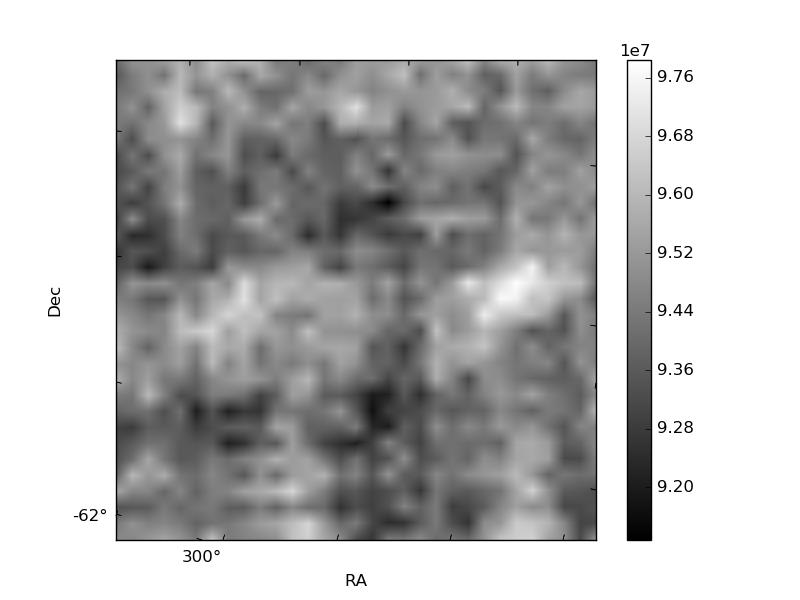
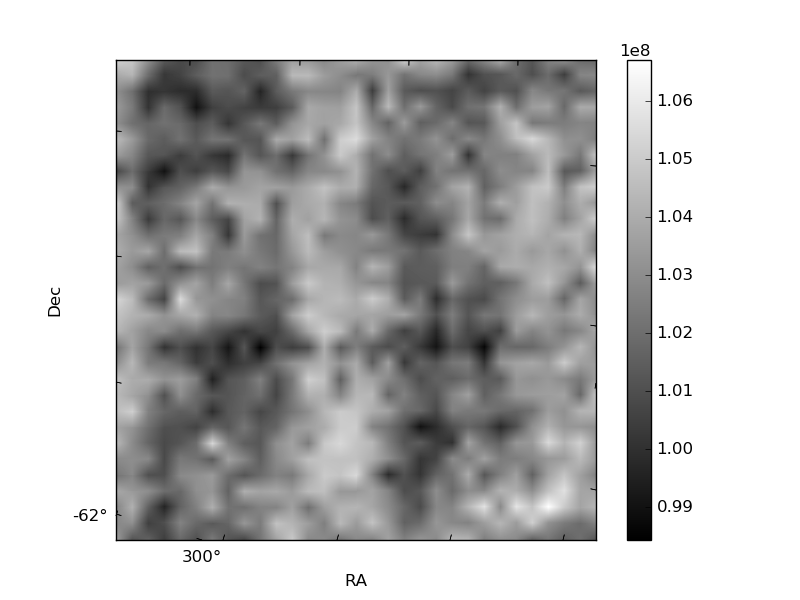
Histogram calculated using DETX and DETY for each event in the final _common_clean file
| Quadrant A |  |
 |
Quadrant B |
|---|---|---|---|
| Quadrant D |  |
 |
Quadrant C |
| Plot type | Count rate plots | Images |
|---|---|---|
| Comparison with Poisson distribution Blue bars denote a histogram of data divided into 1 sec bins. Red curve is a Poisson curve with rate = median count rate of data. |
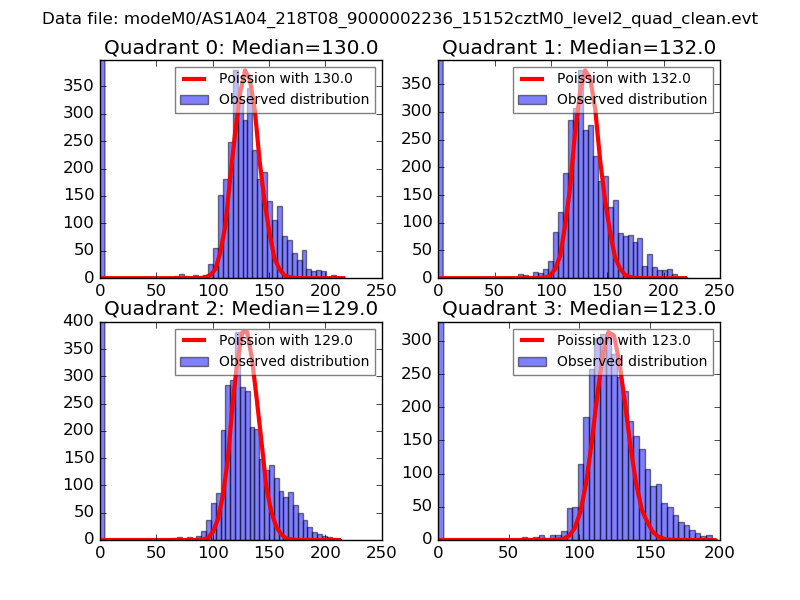 |
 |
| Quadrant-wise count rates Data is divided into 100 sec bins |
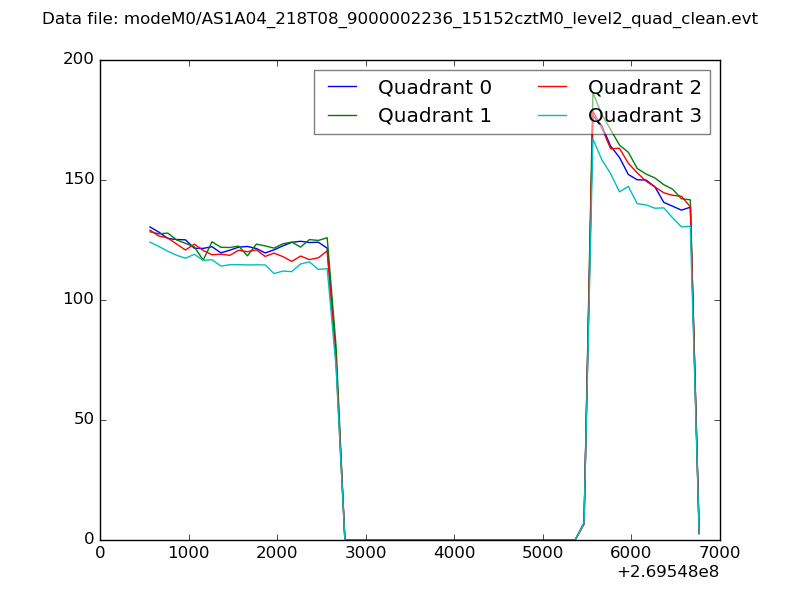 |
|
| Module-wise count rates for Quadrant A Data is divided into 100 sec bins |
 |
 |
| Module-wise count rates for Quadrant B Data is divided into 100 sec bins |
 |
 |
| Module-wise count rates for Quadrant C Data is divided into 100 sec bins |
 |
 |
| Module-wise count rates for Quadrant D Data is divided into 100 sec bins |
 |
 |
| Parameter | Plot |
|---|---|
| CZT HV Monitor |  |
| D_VDD | 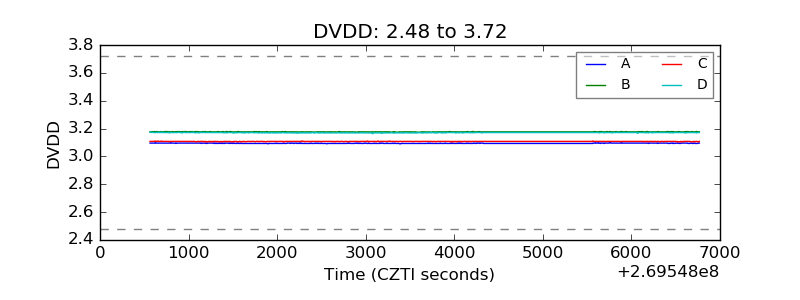 |
| Temperature 1 |  |
| Veto HV Monitor |  |
| Veto LLD |  |
| Alpha Counter |  |
| _CPM_Rate | 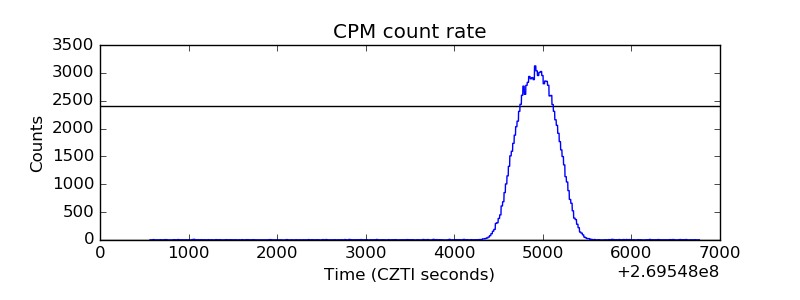 |
| CZT Counter |  |
| +2.5 Volts monitor |  |
| +5 Volts monitor |  |
| _ROLL_ROT |  |
| _Roll_DEC |  |
| _Roll_RA |  |
| Veto Counter |  |