| Param | Original file | Final file |
|---|---|---|
| Filename | modeM0/AS1A04_218T08_9000002236_15153cztM0_level2.evt | modeM0/AS1A04_218T08_9000002236_15153cztM0_level2_quad_clean.evt |
| Size (bytes) | 478,013,760 | 103,933,440 |
| Size | 455.9 MB | 99.1 MB |
| Events in quadrant A | 3,512,105 | 677,889 |
| Events in quadrant B | 3,330,495 | 696,934 |
| Events in quadrant C | 3,529,877 | 685,243 |
| Events in quadrant D | 3,669,569 | 640,893 |
| Mode SS | |||
|---|---|---|---|
| Quadrant | BADHDUFLAG | Total packets | Discarded packets |
| A | 0 | 130 | 0 |
| B | 0 | 130 | 0 |
| C | 0 | 130 | 0 |
| D | 0 | 130 | 0 |
| Mode M9 | |||
|---|---|---|---|
| Quadrant | BADHDUFLAG | Total packets | Discarded packets |
| A | 0 | 17 | 0 |
| B | 0 | 17 | 0 |
| C | 0 | 17 | 0 |
| D | 0 | 18 | 0 |
| Mode M0 | |||
|---|---|---|---|
| Quadrant | BADHDUFLAG | Total packets | Discarded packets |
| A | 0 | 14648 | 3 |
| B | 0 | 13996 | 2 |
| C | 0 | 14437 | 2 |
| D | 0 | 15384 | 2 |
| Quadrant | Total seconds | Saturated seconds | Saturation percentage |
|---|---|---|---|
| A | 6404 | 17 | 0.265459% |
| B | 6404 | 60 | 0.936914% |
| C | 6404 | 18 | 0.281074% |
| D | 6404 | 83 | 1.296065% |
Noise dominated data is calculated using 1-second bins in cleaned event files. If a bin has >2000 counts, and if more than 50% of those come from <1% of pixels, then it is considered to be noise-dominated and hence unusable.
| Quadrant | # 1 sec bins | Bins with >0 counts | Bins with >2000 counts | High rate bins dominated by noise | Noise dominated (total time) | Noise dominated (detector-on time) | Marked lightcurve |
|---|---|---|---|---|---|---|---|
| A | 7745 | 6406 | 0 | 0 | 0.00% | 0.00% | 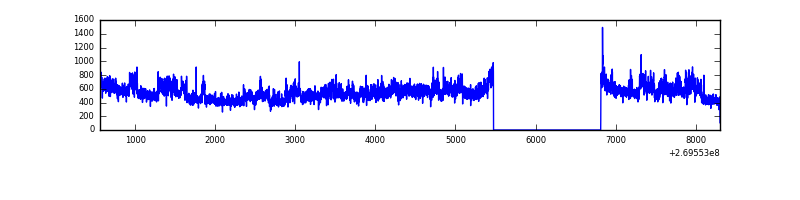 |
| B | 7745 | 6406 | 29 | 29 | 0.37% | 0.45% | 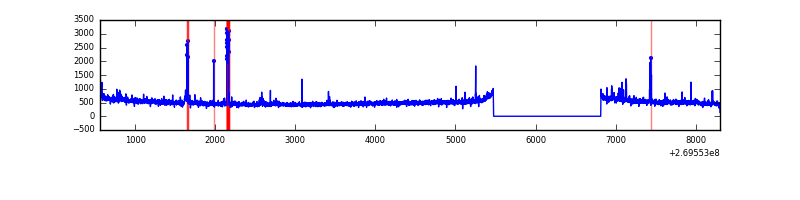 |
| C | 7745 | 6406 | 3 | 3 | 0.04% | 0.05% | 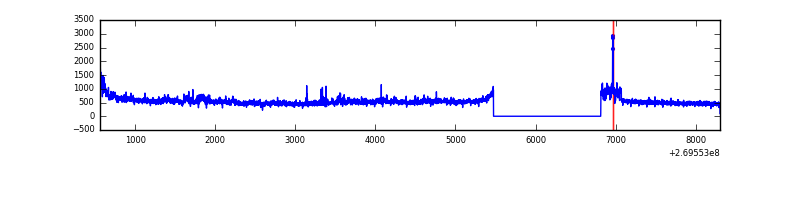 |
| D | 7745 | 6406 | 88 | 88 | 1.14% | 1.37% | 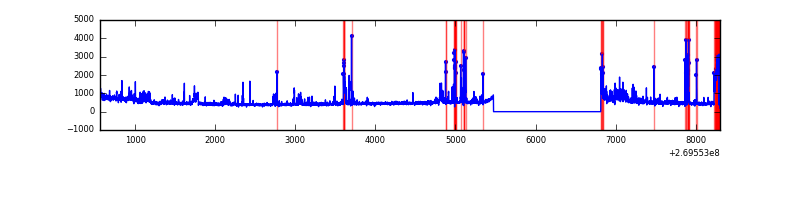 |
Top three noisy pixels from each quadrant. If the there are fewer than three noisy pixels in the level2.evt file, extra rows are filled as -1
| Pixel properties | Quadrant properties | ||||||
|---|---|---|---|---|---|---|---|
| Quadrant | DetID | PixID | Counts | Sigma | Mean | Median | Sigma |
| A | 15 | 239 | 440847 | 2776.26 | 789 | 775 | 158.5 |
| A | 12 | 189 | 33102 | 203.94 | 789 | 775 | 158.5 |
| A | 0 | 226 | 6905 | 38.67 | 789 | 775 | 158.5 |
| B | 3 | 64 | 118440 | 779.45 | 801 | 783 | 150.9 |
| B | 0 | 229 | 48454 | 315.81 | 801 | 783 | 150.9 |
| B | 12 | 111 | 16705 | 105.48 | 801 | 783 | 150.9 |
| C | 3 | 233 | 507640 | 2861.89 | 774 | 780 | 177.1 |
| C | 13 | 61 | 5630 | 27.38 | 774 | 780 | 177.1 |
| C | 9 | 236 | 2331 | 8.76 | 774 | 780 | 177.1 |
| D | 2 | 33 | 340597 | 1864.35 | 759 | 739 | 182.3 |
| D | 2 | 16 | 300890 | 1646.53 | 759 | 739 | 182.3 |
| D | 13 | 172 | 55342 | 299.53 | 759 | 739 | 182.3 |
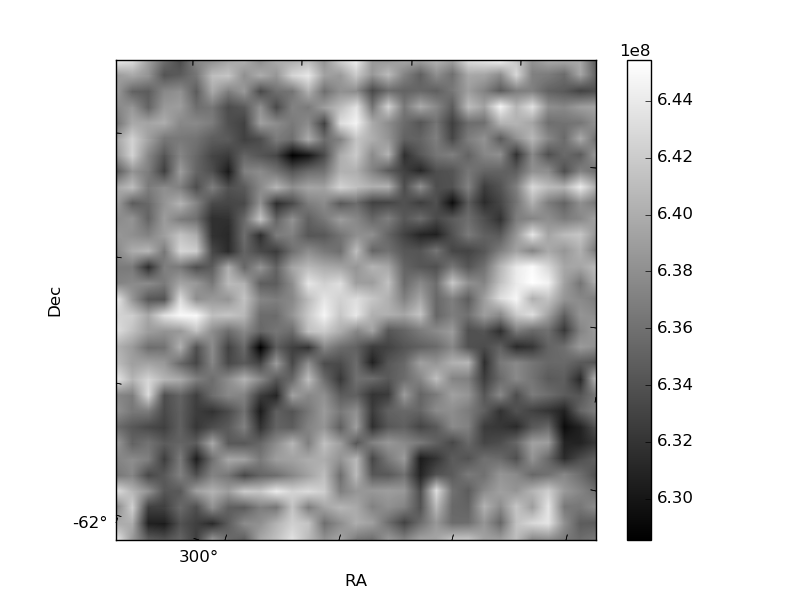
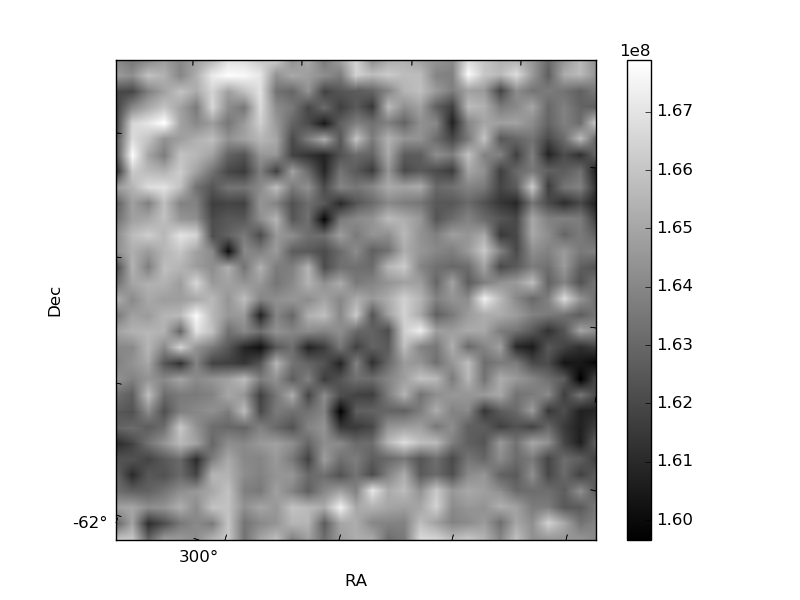
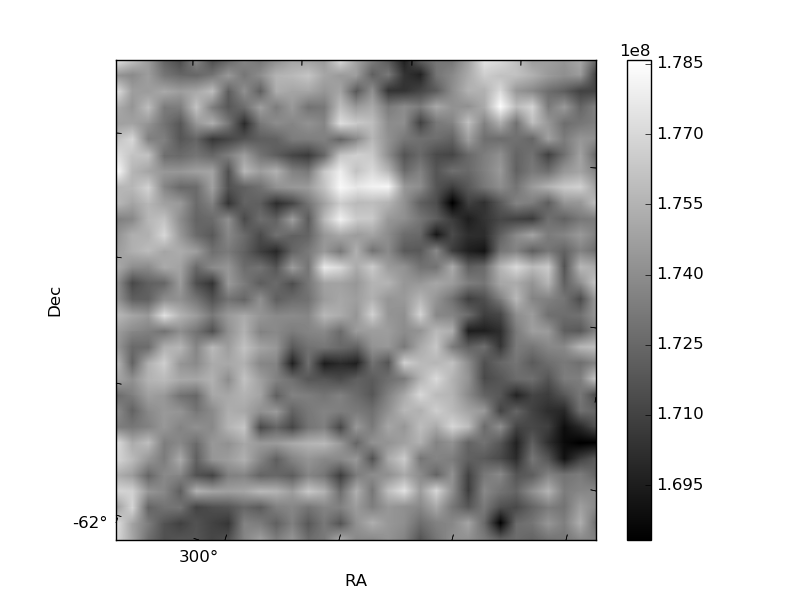
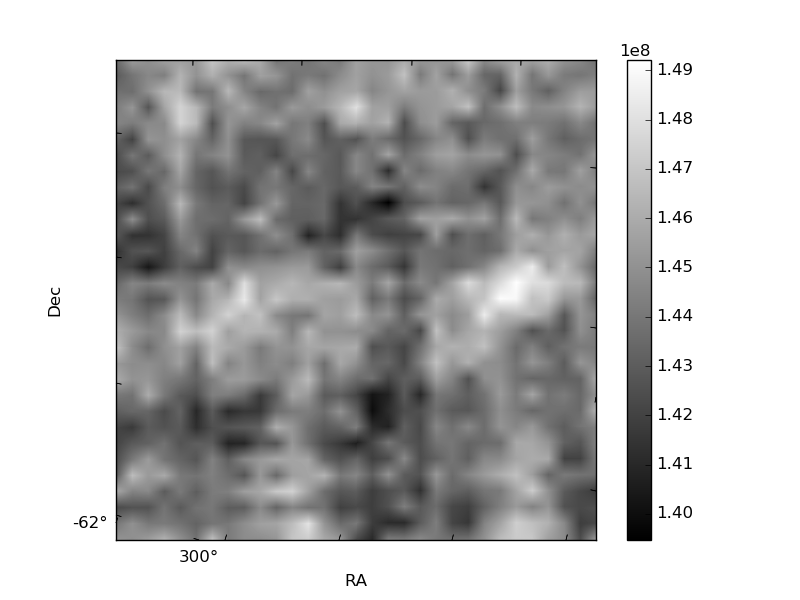
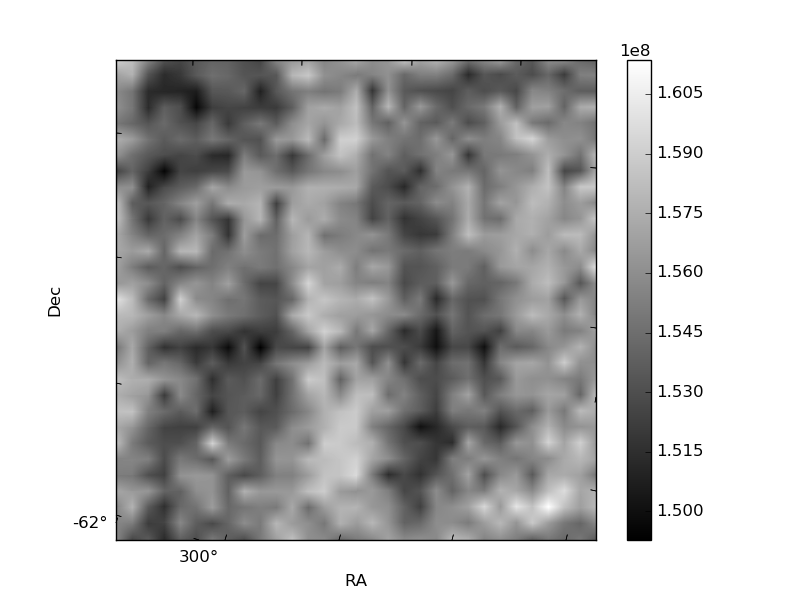
Histogram calculated using DETX and DETY for each event in the final _common_clean file
| Quadrant A | 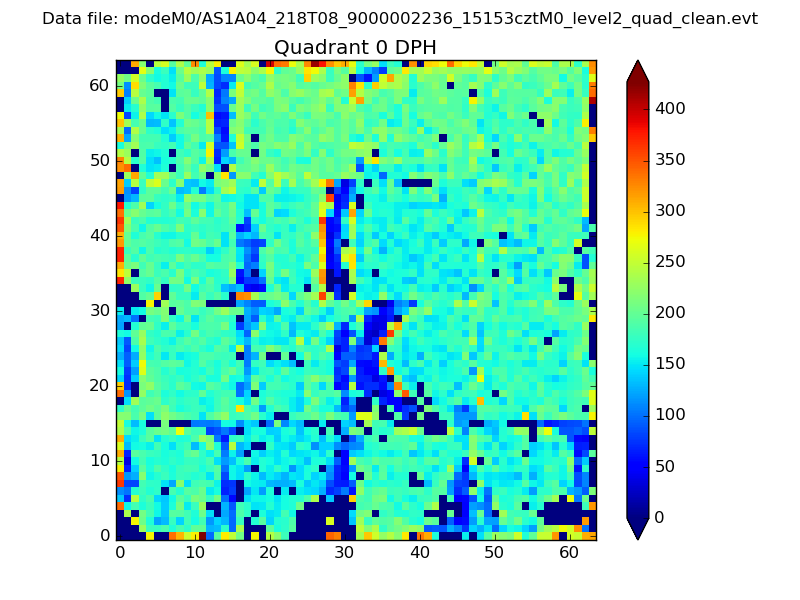 |
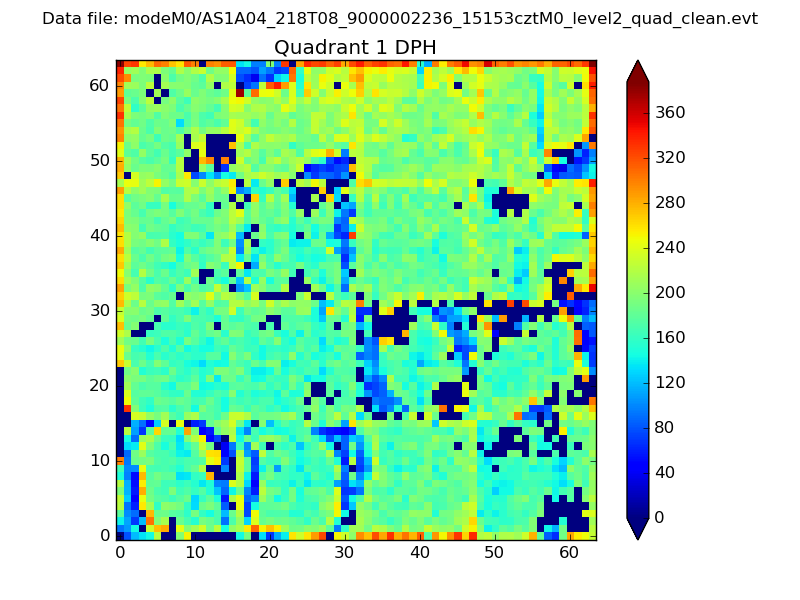 |
Quadrant B |
|---|---|---|---|
| Quadrant D | 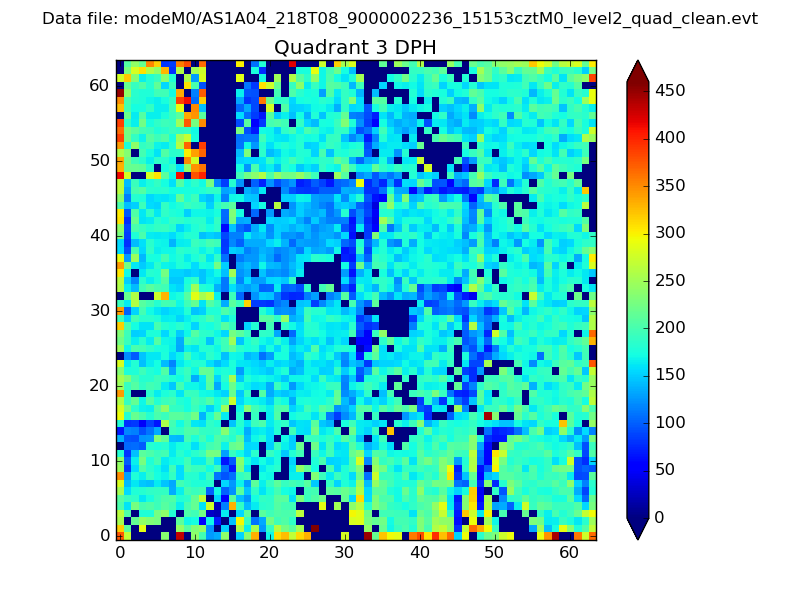 |
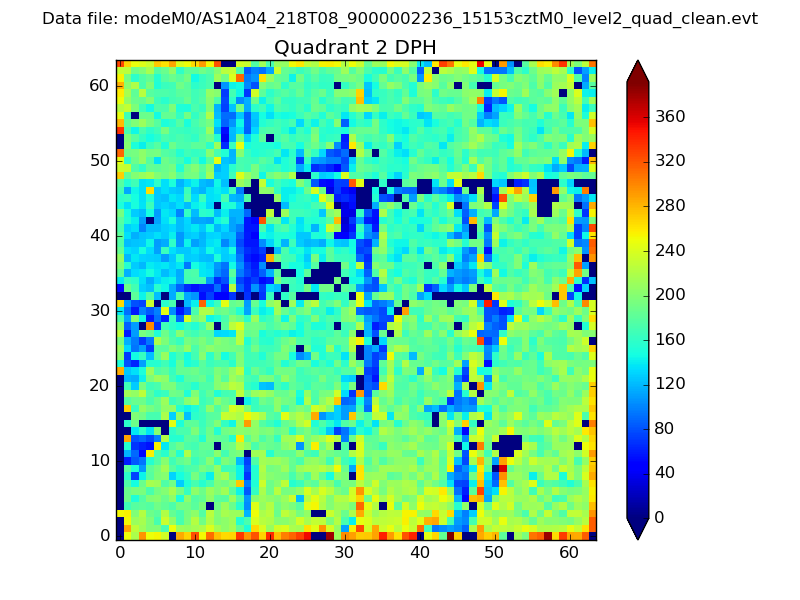 |
Quadrant C |
| Plot type | Count rate plots | Images |
|---|---|---|
| Comparison with Poisson distribution Blue bars denote a histogram of data divided into 1 sec bins. Red curve is a Poisson curve with rate = median count rate of data. |
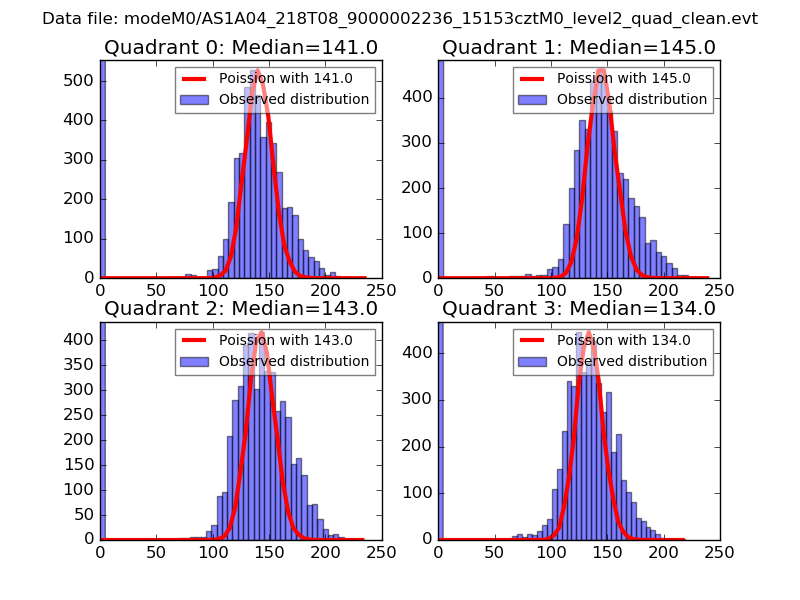 |
 |
| Quadrant-wise count rates Data is divided into 100 sec bins |
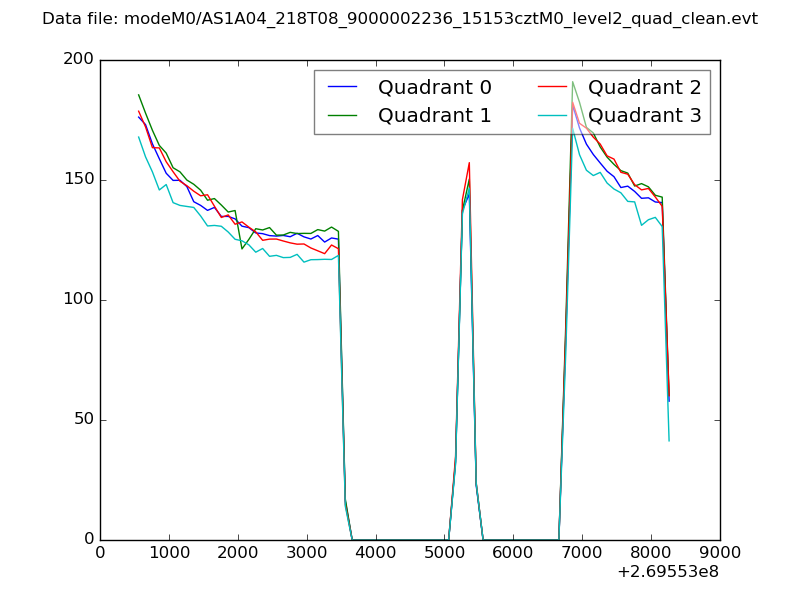 |
|
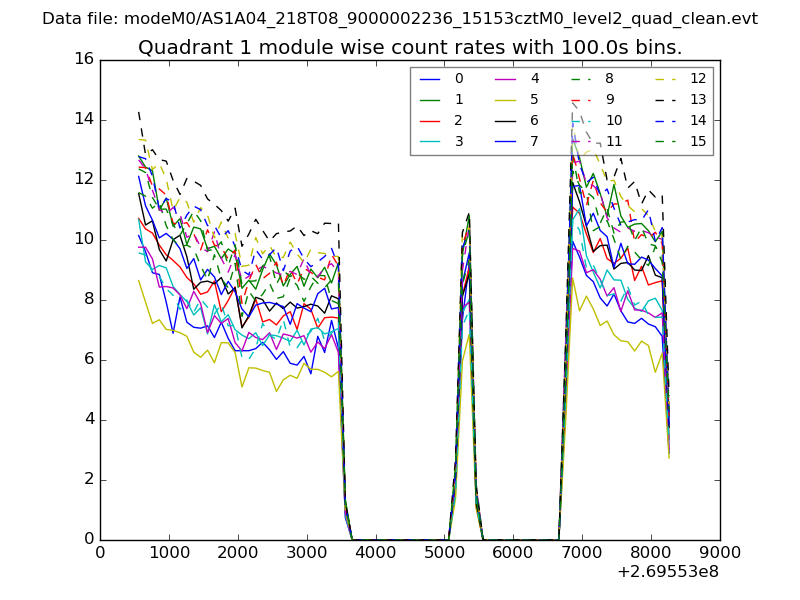
| Module-wise count rates for Quadrant A Data is divided into 100 sec bins |
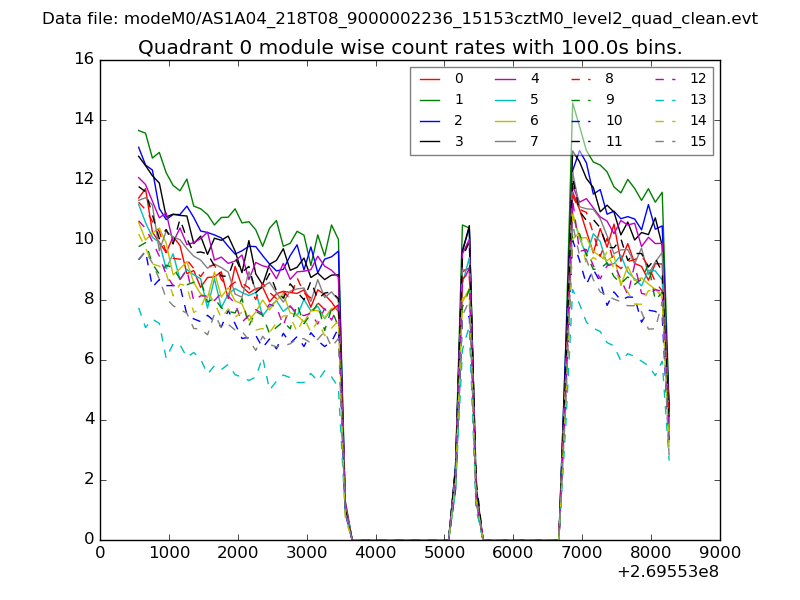 |
 |
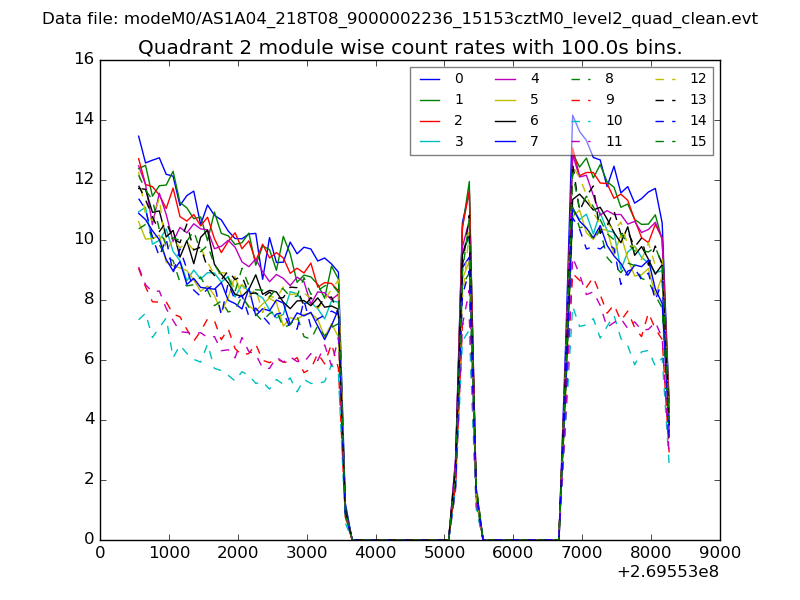
| Module-wise count rates for Quadrant B Data is divided into 100 sec bins |
 |
 |
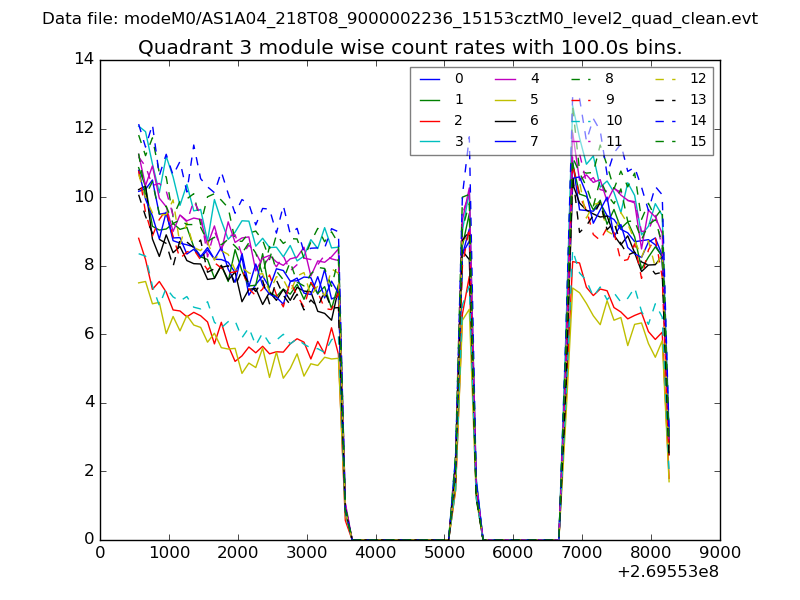
| Module-wise count rates for Quadrant C Data is divided into 100 sec bins |
 |
 |
| Module-wise count rates for Quadrant D Data is divided into 100 sec bins |
 |
 |
| Parameter | Plot |
|---|---|
| CZT HV Monitor | 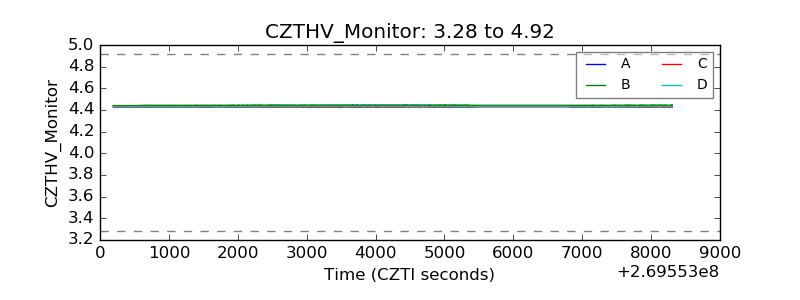 |
| D_VDD | 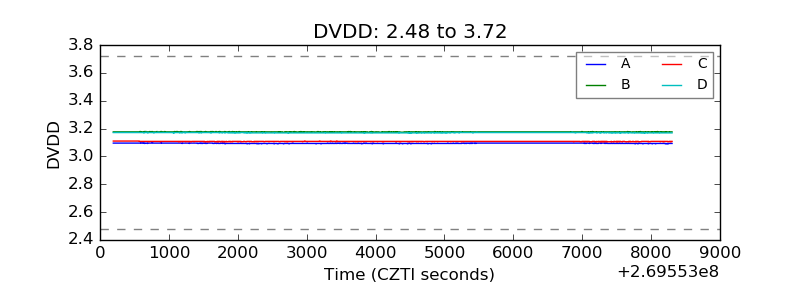 |
| Temperature 1 | 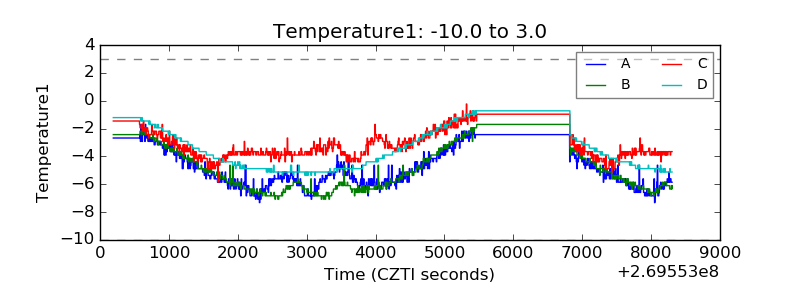 |
| Veto HV Monitor | 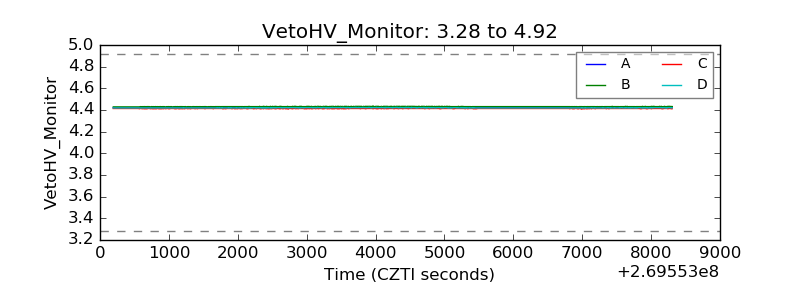 |
| Veto LLD | 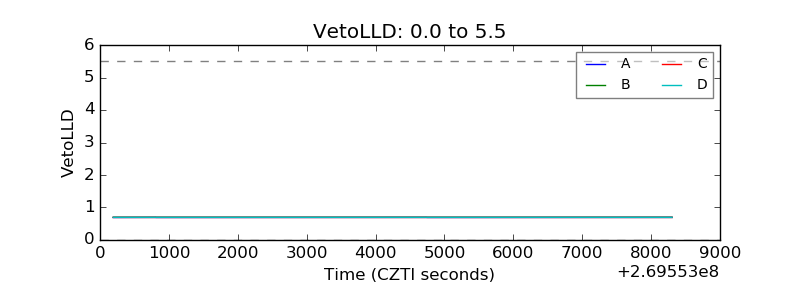 |
| Alpha Counter | 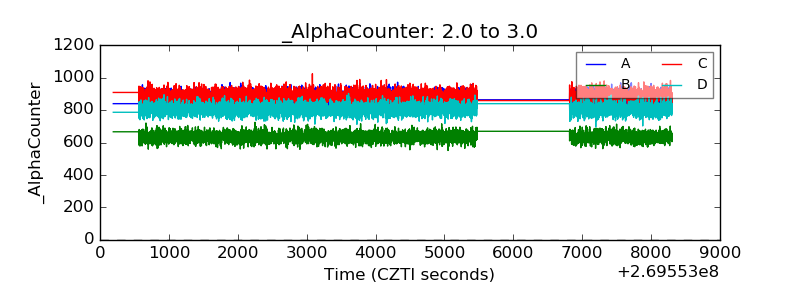 |
| _CPM_Rate | 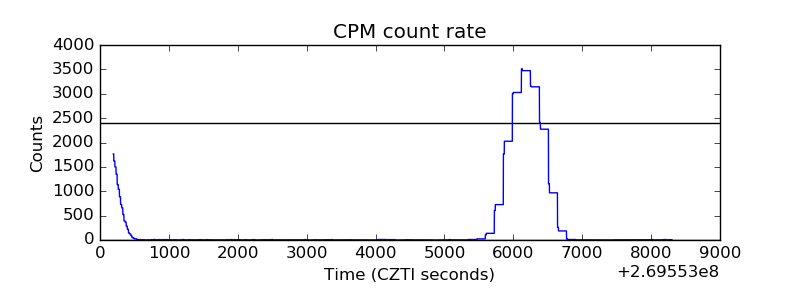 |
| CZT Counter | 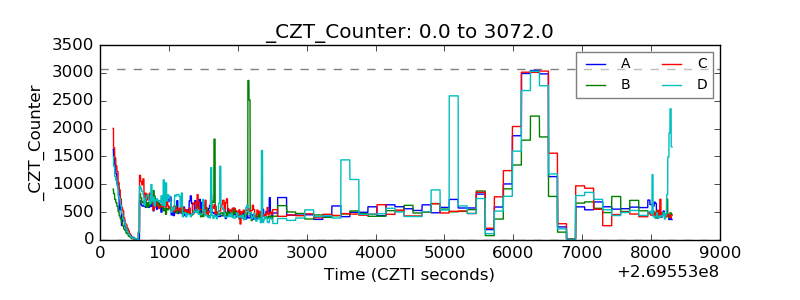 |
| +2.5 Volts monitor | 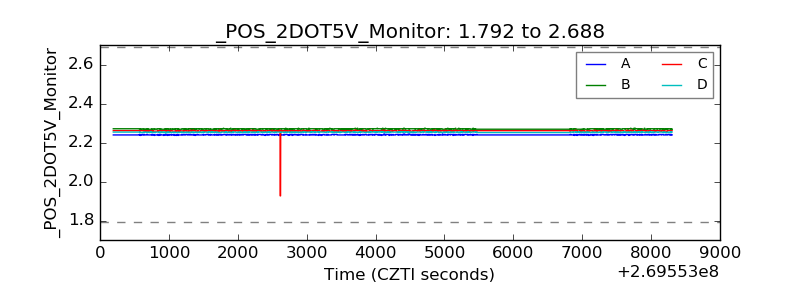 |
| +5 Volts monitor |  |
| _ROLL_ROT | 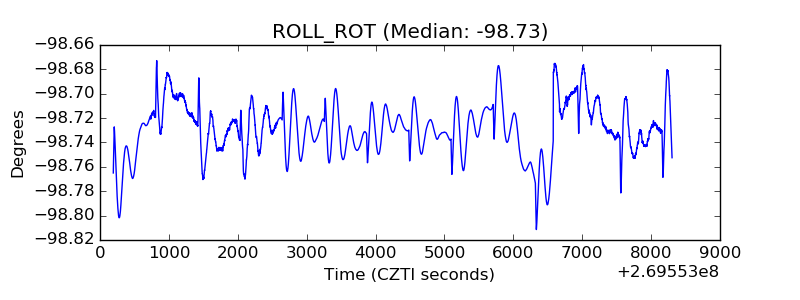 |
| _Roll_DEC | 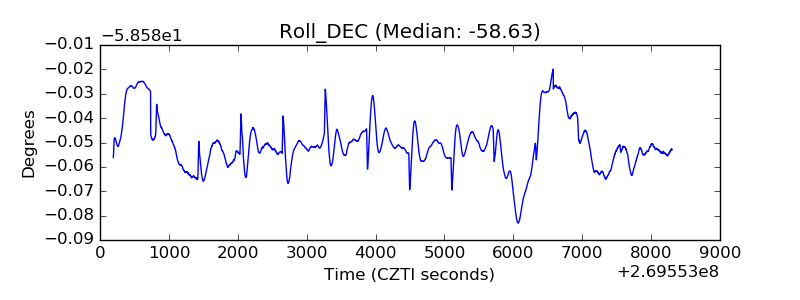 |
| _Roll_RA | 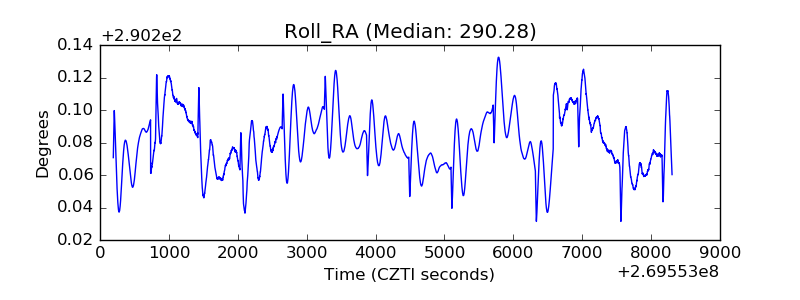 |
| Veto Counter | 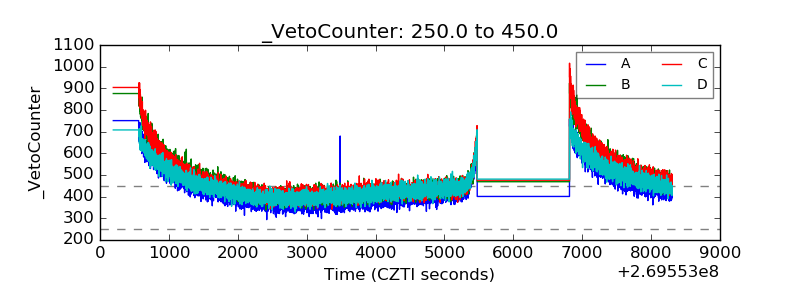 |