| Param | Original file | Final file |
|---|---|---|
| Filename | modeM0/AS1A04_218T08_9000002236_15154cztM0_level2.evt | modeM0/AS1A04_218T08_9000002236_15154cztM0_level2_quad_clean.evt |
| Size (bytes) | 469,428,480 | 107,003,520 |
| Size | 447.7 MB | 102.0 MB |
| Events in quadrant A | 3,521,886 | 693,984 |
| Events in quadrant B | 3,353,384 | 720,363 |
| Events in quadrant C | 3,455,378 | 712,631 |
| Events in quadrant D | 3,451,236 | 667,007 |
| Mode SS | |||
|---|---|---|---|
| Quadrant | BADHDUFLAG | Total packets | Discarded packets |
| A | 0 | 130 | 0 |
| B | 0 | 130 | 0 |
| C | 0 | 130 | 0 |
| D | 0 | 130 | 0 |
| Mode M9 | |||
|---|---|---|---|
| Quadrant | BADHDUFLAG | Total packets | Discarded packets |
| A | 0 | 16 | 0 |
| B | 0 | 16 | 0 |
| C | 0 | 16 | 0 |
| D | 0 | 17 | 0 |
| Mode M0 | |||
|---|---|---|---|
| Quadrant | BADHDUFLAG | Total packets | Discarded packets |
| A | 0 | 14771 | 3 |
| B | 0 | 13952 | 2 |
| C | 0 | 14381 | 2 |
| D | 0 | 14536 | 2 |
| Quadrant | Total seconds | Saturated seconds | Saturation percentage |
|---|---|---|---|
| A | 6405 | 43 | 0.671351% |
| B | 6405 | 60 | 0.936768% |
| C | 6405 | 20 | 0.312256% |
| D | 6405 | 61 | 0.952381% |
Noise dominated data is calculated using 1-second bins in cleaned event files. If a bin has >2000 counts, and if more than 50% of those come from <1% of pixels, then it is considered to be noise-dominated and hence unusable.
| Quadrant | # 1 sec bins | Bins with >0 counts | Bins with >2000 counts | High rate bins dominated by noise | Noise dominated (total time) | Noise dominated (detector-on time) | Marked lightcurve |
|---|---|---|---|---|---|---|---|
| A | 7786 | 6407 | 0 | 0 | 0.00% | 0.00% | 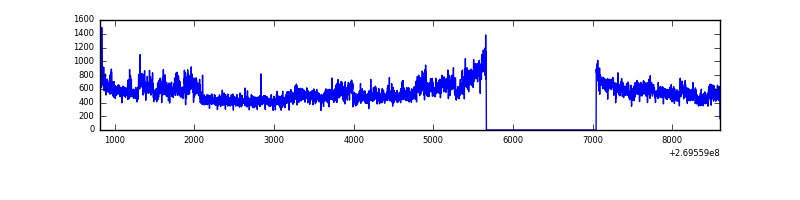 |
| B | 7786 | 6407 | 7 | 7 | 0.09% | 0.11% | 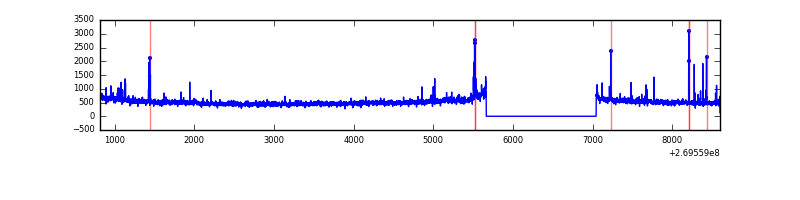 |
| C | 7786 | 6407 | 3 | 3 | 0.04% | 0.05% | 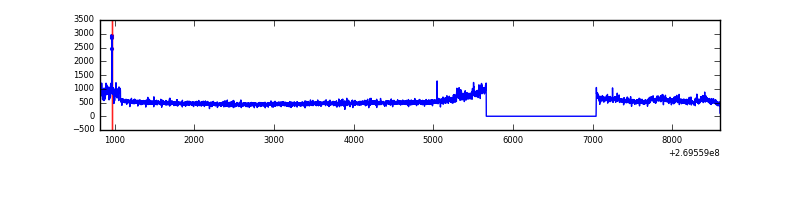 |
| D | 7786 | 6407 | 66 | 66 | 0.85% | 1.03% | 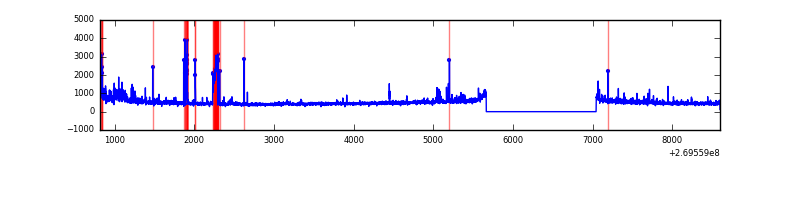 |
Top three noisy pixels from each quadrant. If the there are fewer than three noisy pixels in the level2.evt file, extra rows are filled as -1
| Pixel properties | Quadrant properties | ||||||
|---|---|---|---|---|---|---|---|
| Quadrant | DetID | PixID | Counts | Sigma | Mean | Median | Sigma |
| A | 15 | 239 | 427868 | 2675.74 | 797 | 783 | 159.6 |
| A | 12 | 189 | 24081 | 145.96 | 797 | 783 | 159.6 |
| A | 0 | 226 | 6853 | 38.03 | 797 | 783 | 159.6 |
| B | 4 | 48 | 48133 | 315.31 | 814 | 796 | 150.1 |
| B | 0 | 229 | 45319 | 296.57 | 814 | 796 | 150.1 |
| B | 3 | 64 | 37880 | 247.02 | 814 | 796 | 150.1 |
| C | 3 | 233 | 360128 | 1988.41 | 793 | 800 | 180.7 |
| C | 13 | 61 | 5792 | 27.62 | 793 | 800 | 180.7 |
| C | 9 | 236 | 3157 | 13.04 | 793 | 800 | 180.7 |
| D | 2 | 16 | 270410 | 1453.92 | 776 | 754 | 185.5 |
| D | 2 | 33 | 153125 | 821.55 | 776 | 754 | 185.5 |
| D | 13 | 172 | 55000 | 292.48 | 776 | 754 | 185.5 |
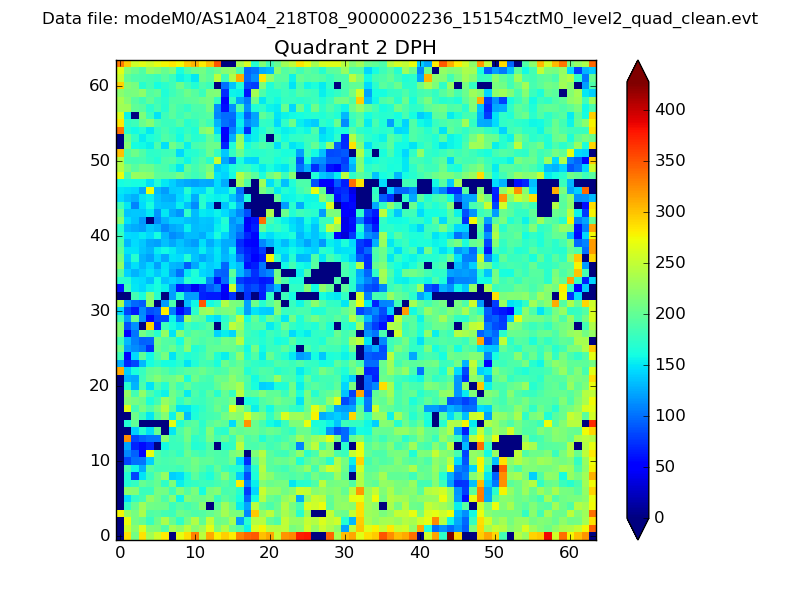
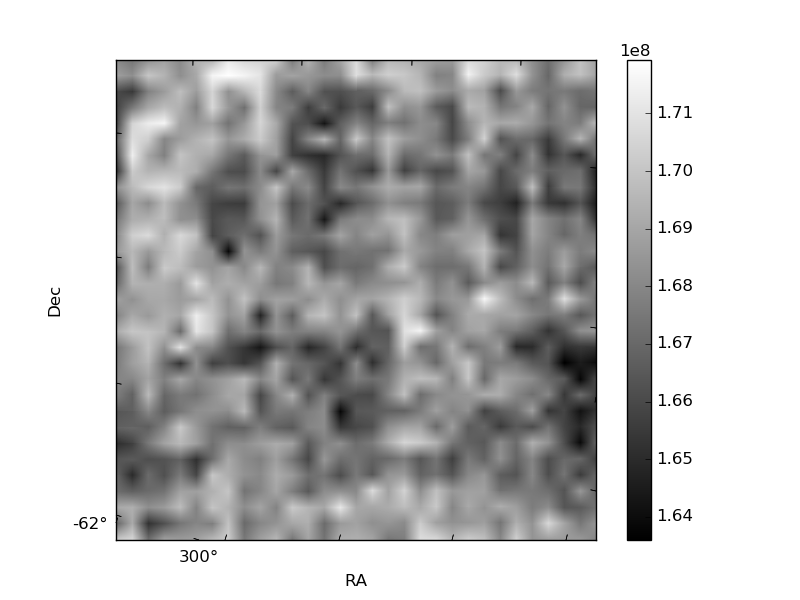
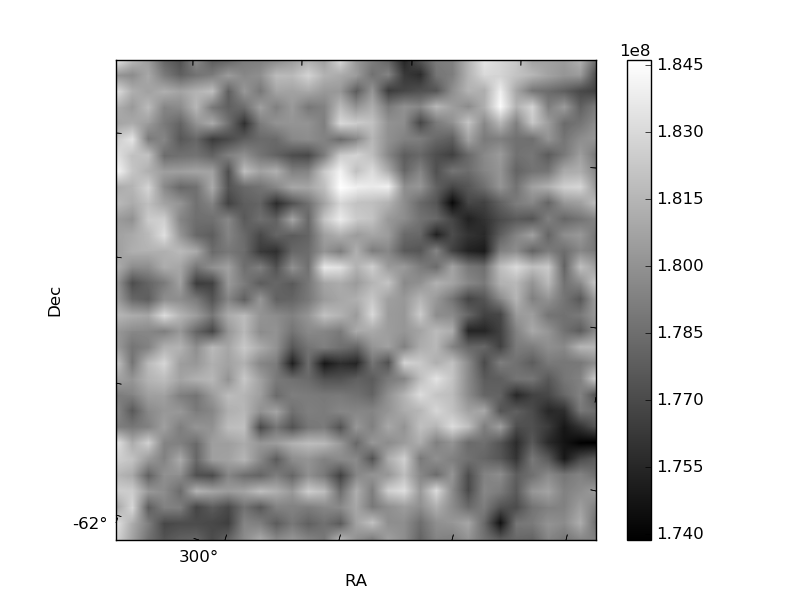
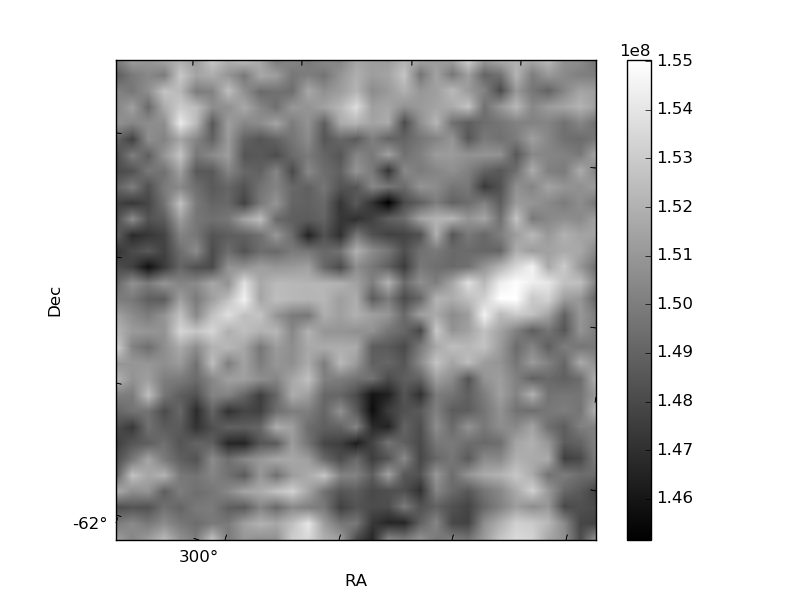
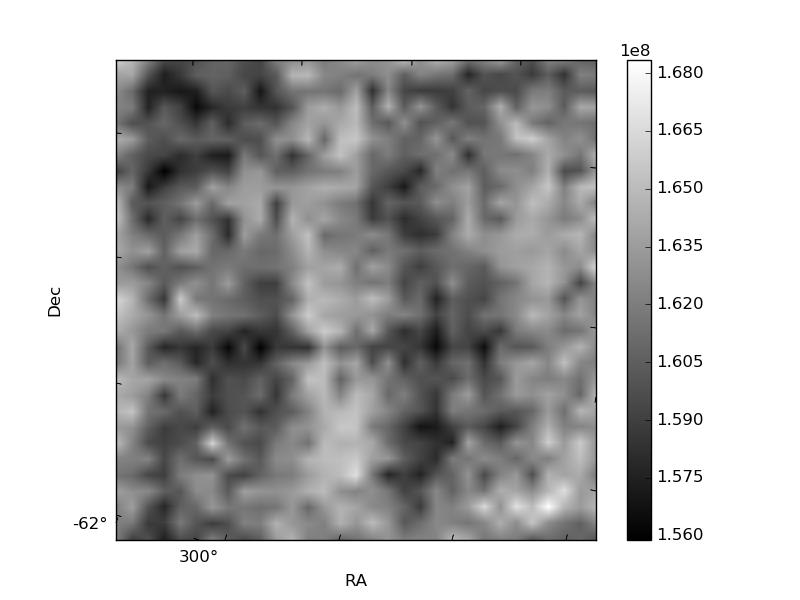
Histogram calculated using DETX and DETY for each event in the final _common_clean file
| Quadrant A | 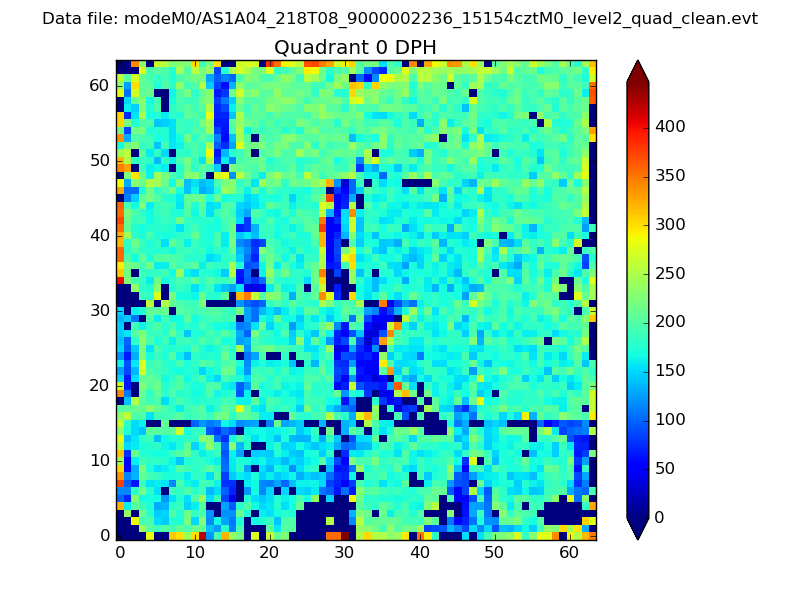 |
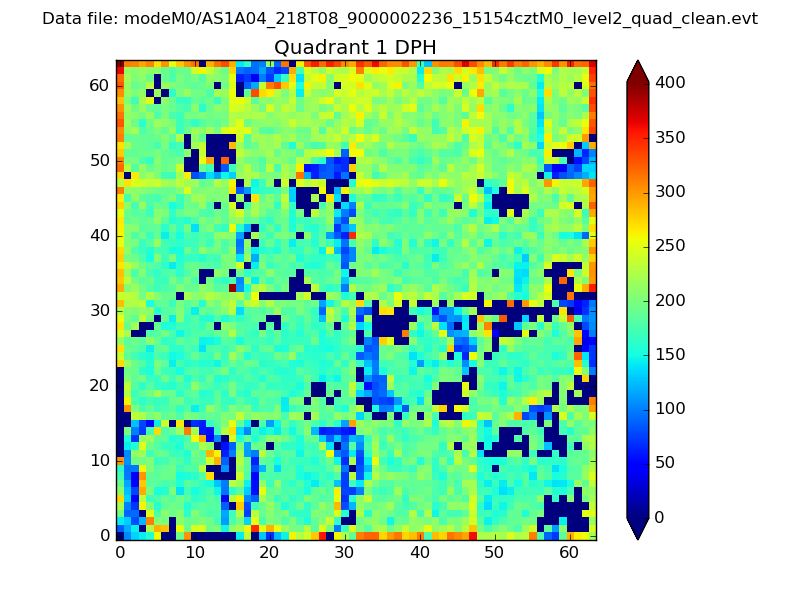 |
Quadrant B |
|---|---|---|---|
| Quadrant D | 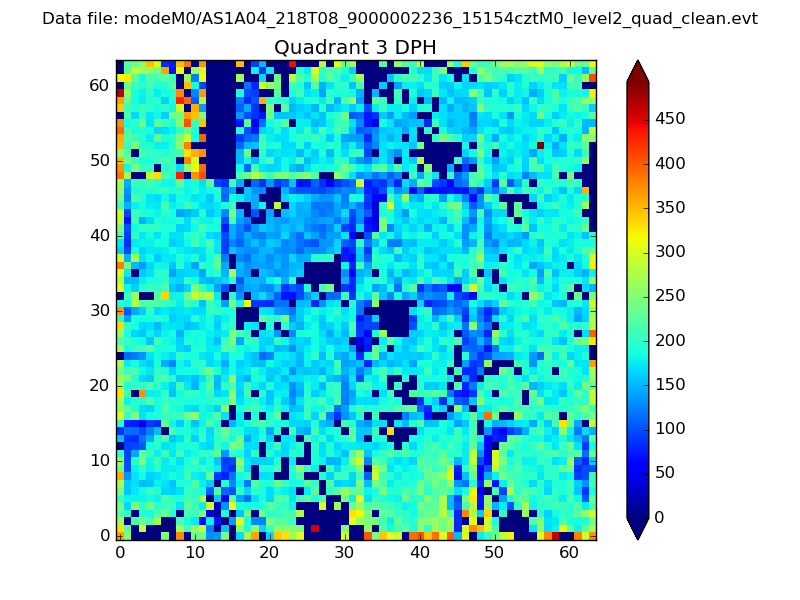 |
 |
Quadrant C |
| Plot type | Count rate plots | Images |
|---|---|---|
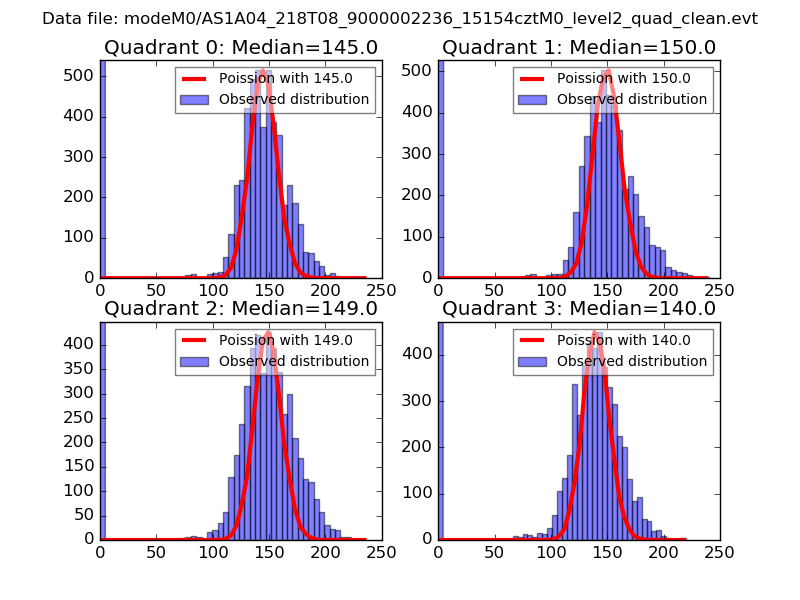
| Comparison with Poisson distribution Blue bars denote a histogram of data divided into 1 sec bins. Red curve is a Poisson curve with rate = median count rate of data. |
 |
 |
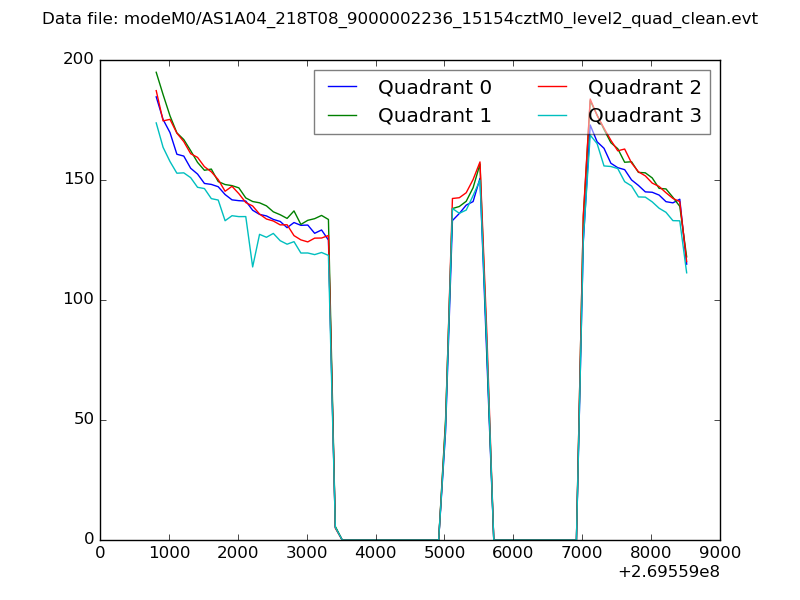
| Quadrant-wise count rates Data is divided into 100 sec bins |
 |
|
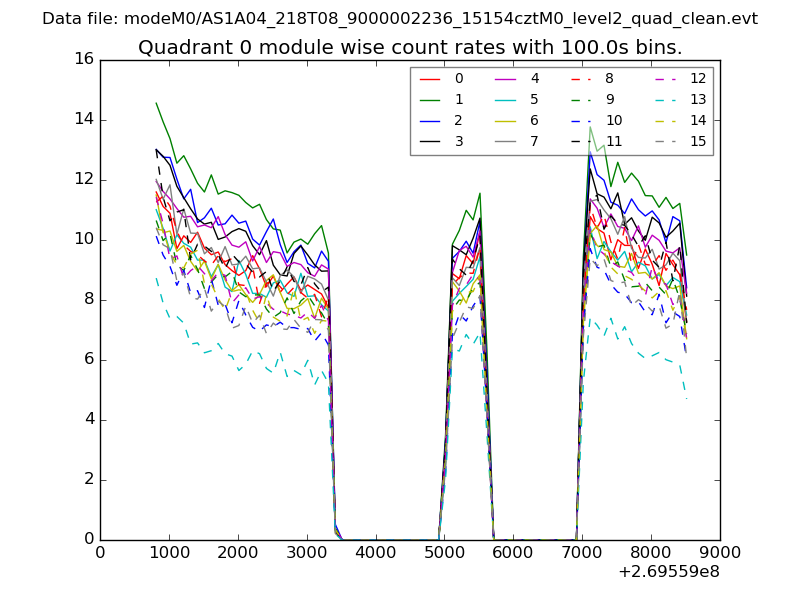
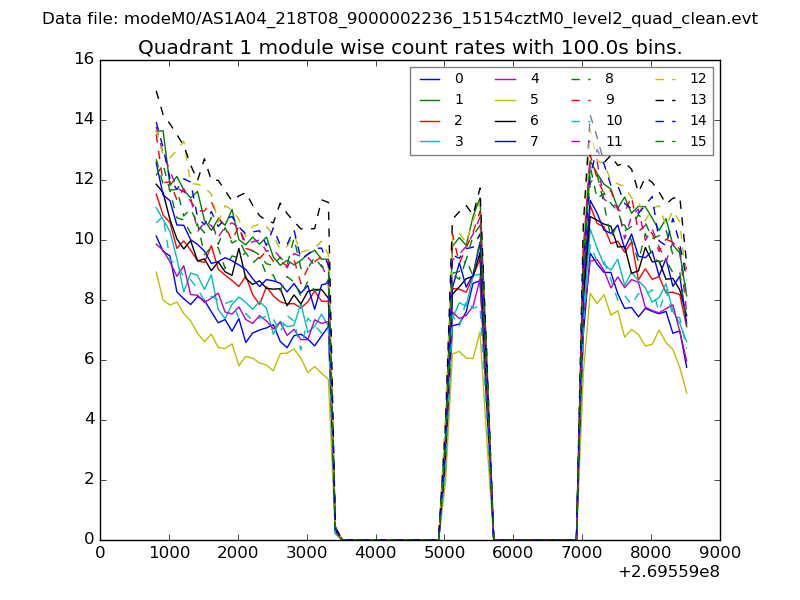
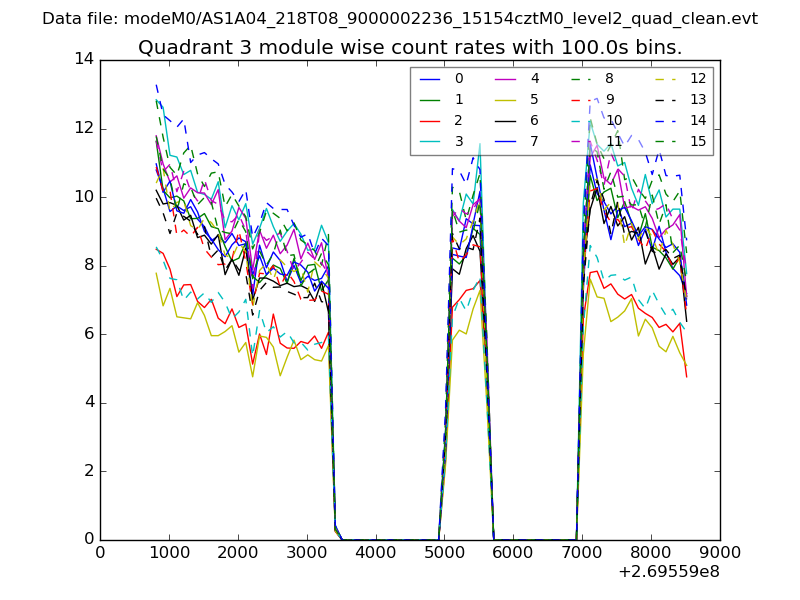
| Module-wise count rates for Quadrant A Data is divided into 100 sec bins |
 |
 |
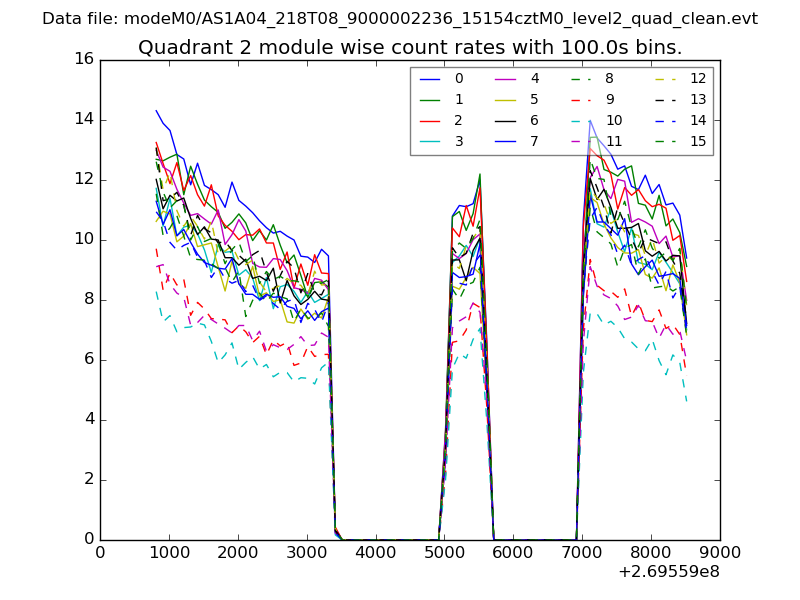
| Module-wise count rates for Quadrant B Data is divided into 100 sec bins |
 |
 |
| Module-wise count rates for Quadrant C Data is divided into 100 sec bins |
 |
 |
| Module-wise count rates for Quadrant D Data is divided into 100 sec bins |
 |
 |
| Parameter | Plot |
|---|---|
| CZT HV Monitor | 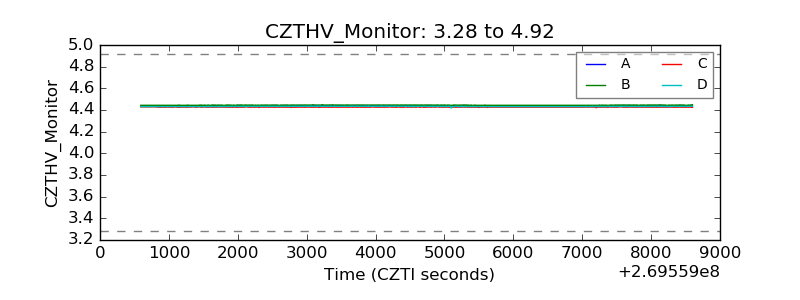 |
| D_VDD | 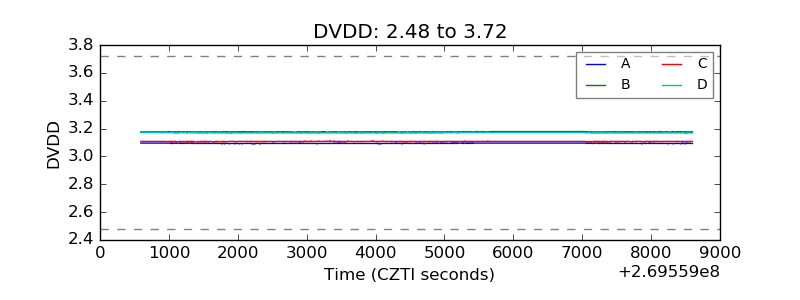 |
| Temperature 1 |  |
| Veto HV Monitor | 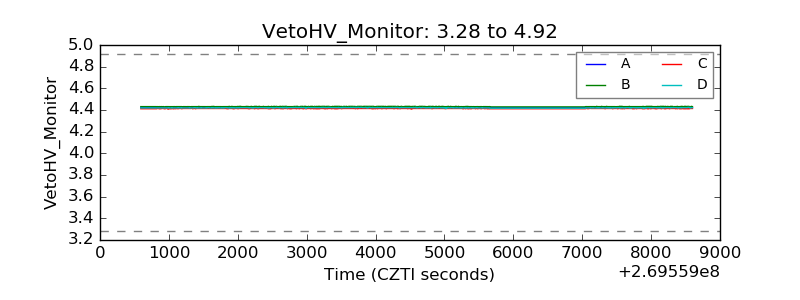 |
| Veto LLD | 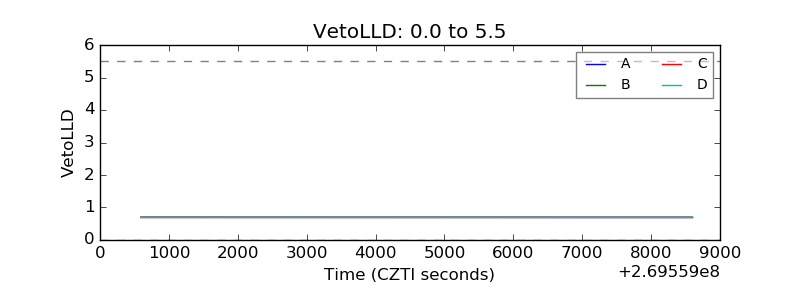 |
| Alpha Counter | 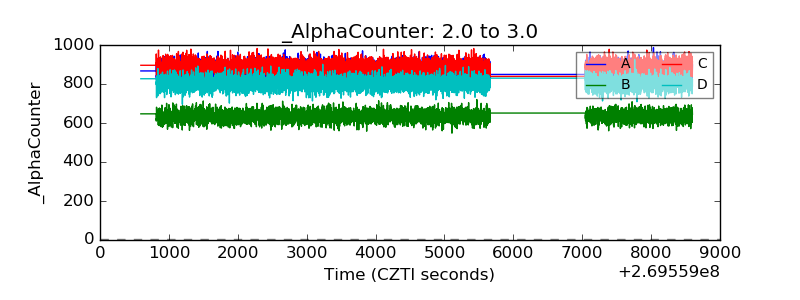 |
| _CPM_Rate | 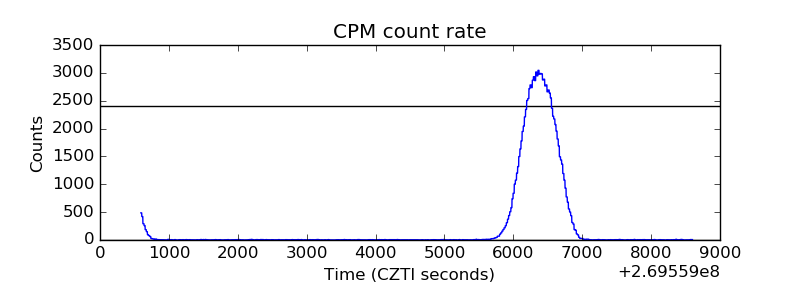 |
| CZT Counter | 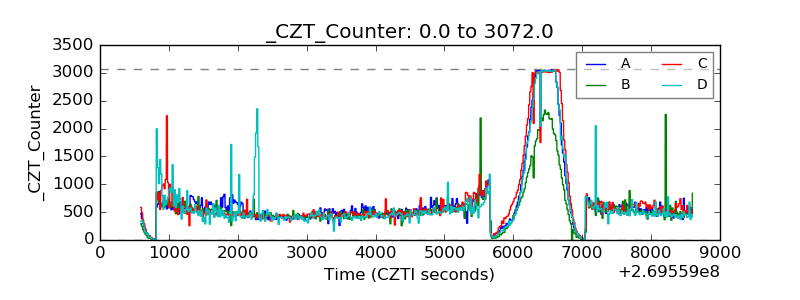 |
| +2.5 Volts monitor |  |
| +5 Volts monitor | 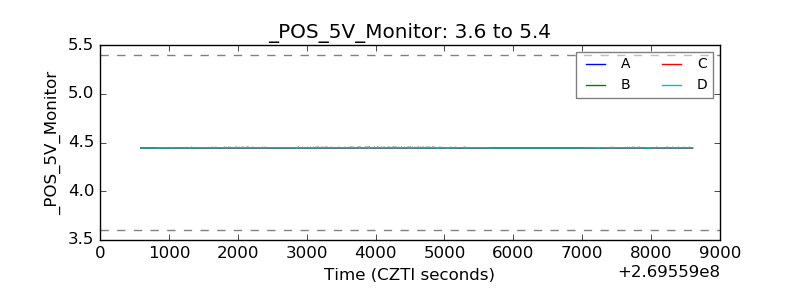 |
| _ROLL_ROT | 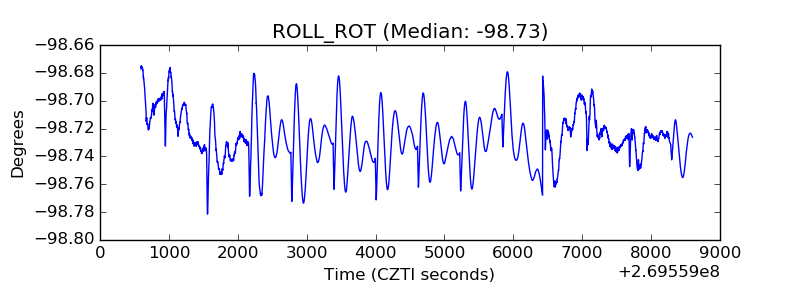 |
| _Roll_DEC | 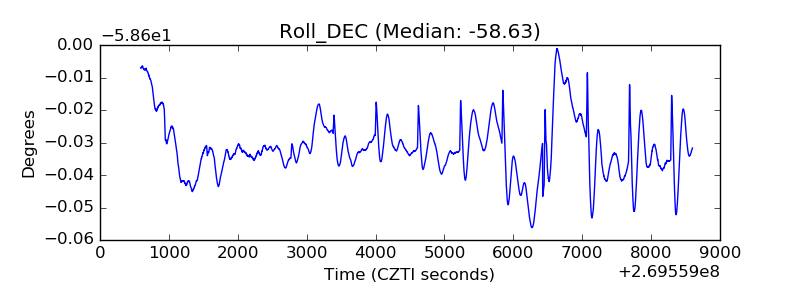 |
| _Roll_RA | 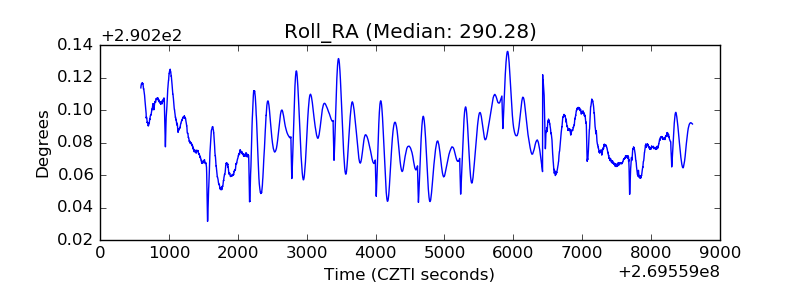 |
| Veto Counter | 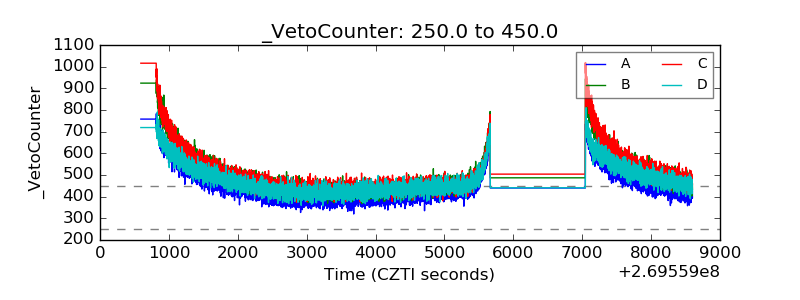 |