| Param | Original file | Final file |
|---|---|---|
| Filename | modeM0/AS1A04_218T08_9000002236_15155cztM0_level2.evt | modeM0/AS1A04_218T08_9000002236_15155cztM0_level2_quad_clean.evt |
| Size (bytes) | 464,267,520 | 105,765,120 |
| Size | 442.8 MB | 100.9 MB |
| Events in quadrant A | 3,589,951 | 681,361 |
| Events in quadrant B | 3,444,200 | 708,989 |
| Events in quadrant C | 3,504,413 | 704,315 |
| Events in quadrant D | 3,087,361 | 662,061 |
| Mode SS | |||
|---|---|---|---|
| Quadrant | BADHDUFLAG | Total packets | Discarded packets |
| A | 0 | 130 | 0 |
| B | 0 | 130 | 0 |
| C | 0 | 130 | 0 |
| D | 0 | 130 | 0 |
| Mode M9 | |||
|---|---|---|---|
| Quadrant | BADHDUFLAG | Total packets | Discarded packets |
| A | 0 | 16 | 0 |
| B | 0 | 16 | 0 |
| C | 0 | 16 | 0 |
| D | 0 | 17 | 0 |
| Mode M0 | |||
|---|---|---|---|
| Quadrant | BADHDUFLAG | Total packets | Discarded packets |
| A | 0 | 15010 | 3 |
| B | 0 | 14130 | 2 |
| C | 0 | 14366 | 2 |
| D | 0 | 13491 | 2 |
| Quadrant | Total seconds | Saturated seconds | Saturation percentage |
|---|---|---|---|
| A | 6399 | 21 | 0.328176% |
| B | 6399 | 27 | 0.421941% |
| C | 6399 | 16 | 0.250039% |
| D | 6399 | 17 | 0.265667% |
Noise dominated data is calculated using 1-second bins in cleaned event files. If a bin has >2000 counts, and if more than 50% of those come from <1% of pixels, then it is considered to be noise-dominated and hence unusable.
| Quadrant | # 1 sec bins | Bins with >0 counts | Bins with >2000 counts | High rate bins dominated by noise | Noise dominated (total time) | Noise dominated (detector-on time) | Marked lightcurve |
|---|---|---|---|---|---|---|---|
| A | 7800 | 6401 | 0 | 0 | 0.00% | 0.00% | 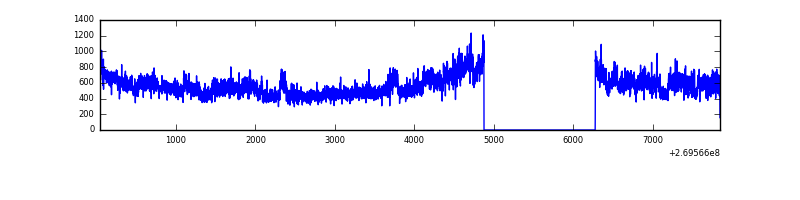 |
| B | 7800 | 6401 | 8 | 8 | 0.10% | 0.12% | 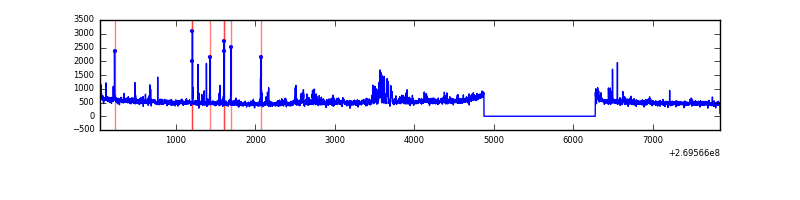 |
| C | 7800 | 6401 | 4 | 4 | 0.05% | 0.06% | 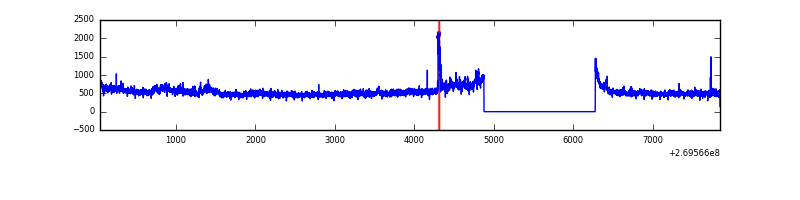 |
| D | 7800 | 6401 | 9 | 9 | 0.12% | 0.14% | 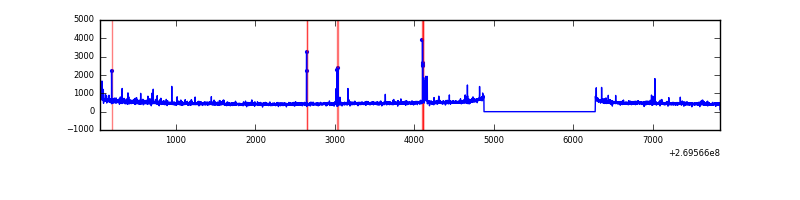 |
Top three noisy pixels from each quadrant. If the there are fewer than three noisy pixels in the level2.evt file, extra rows are filled as -1
| Pixel properties | Quadrant properties | ||||||
|---|---|---|---|---|---|---|---|
| Quadrant | DetID | PixID | Counts | Sigma | Mean | Median | Sigma |
| A | 15 | 239 | 534806 | 3414.73 | 788 | 774 | 156.4 |
| A | 12 | 189 | 24585 | 152.25 | 788 | 774 | 156.4 |
| A | 0 | 226 | 6915 | 39.26 | 788 | 774 | 156.4 |
| B | 0 | 229 | 146514 | 982.89 | 806 | 786 | 148.3 |
| B | 3 | 64 | 75412 | 503.33 | 806 | 786 | 148.3 |
| B | 4 | 48 | 29050 | 190.63 | 806 | 786 | 148.3 |
| C | 3 | 233 | 416673 | 2319.86 | 789 | 796 | 179.3 |
| C | 13 | 61 | 5669 | 27.18 | 789 | 796 | 179.3 |
| C | 9 | 236 | 5247 | 24.83 | 789 | 796 | 179.3 |
| D | 2 | 16 | 67899 | 359.52 | 774 | 754 | 186.8 |
| D | 2 | 33 | 42854 | 225.42 | 774 | 754 | 186.8 |
| D | 2 | 234 | 23092 | 119.61 | 774 | 754 | 186.8 |
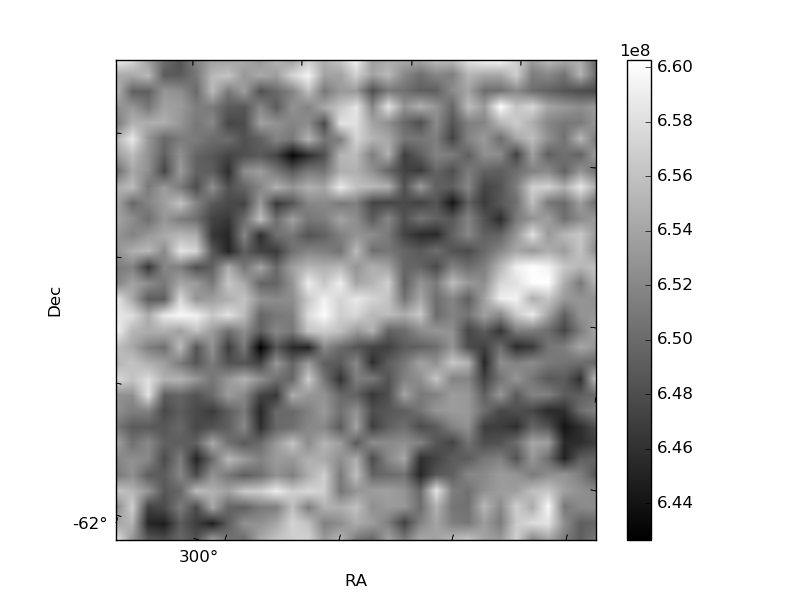
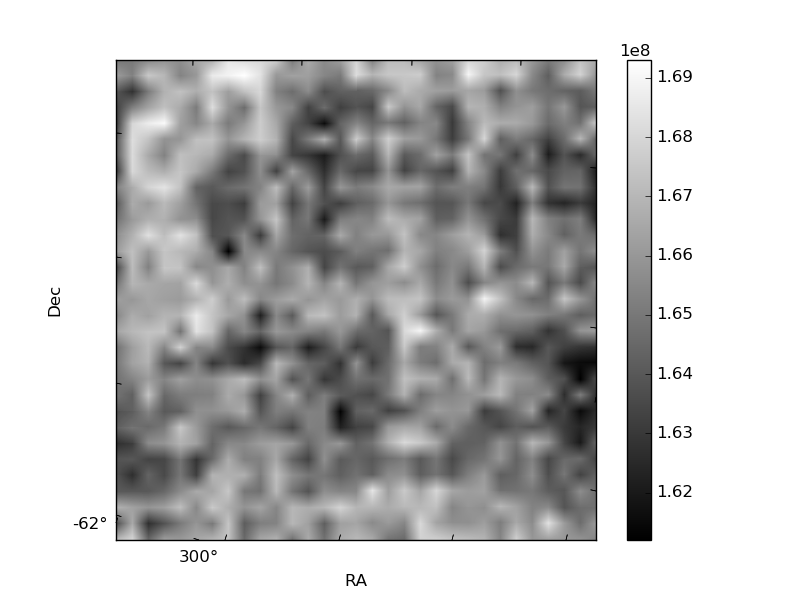
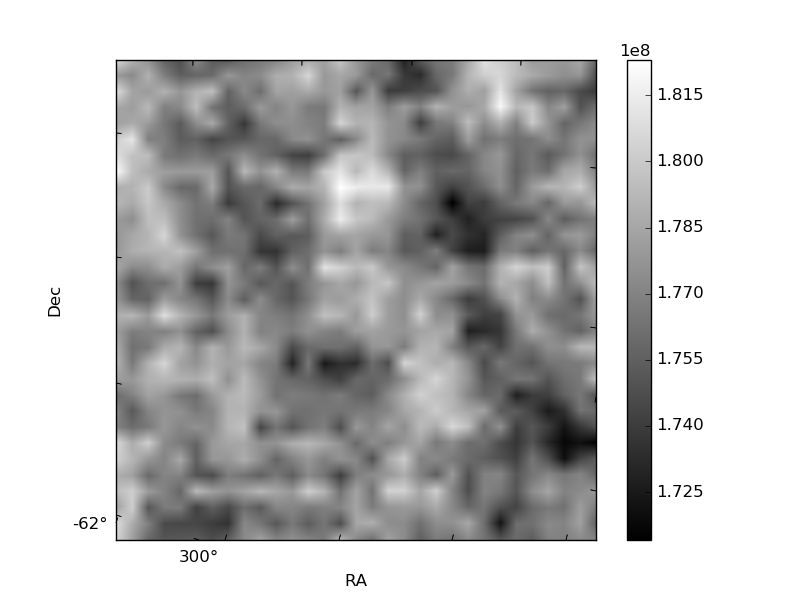
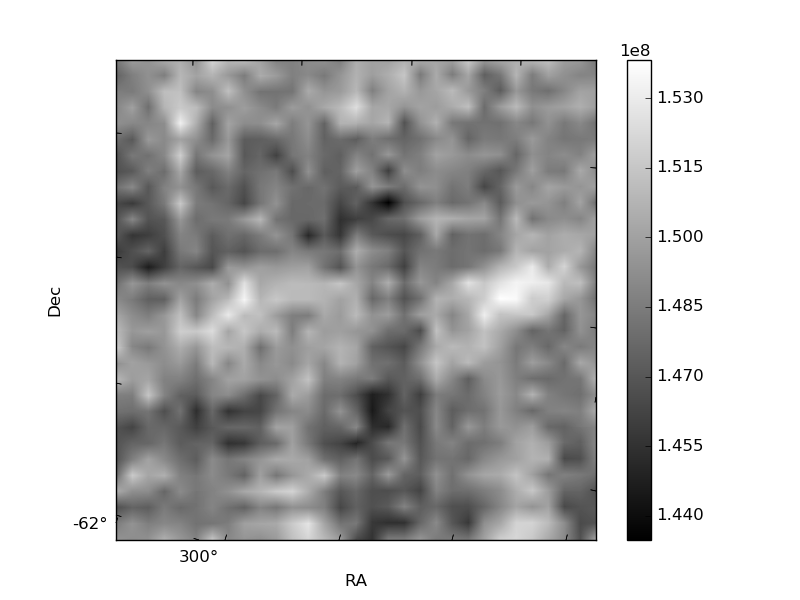
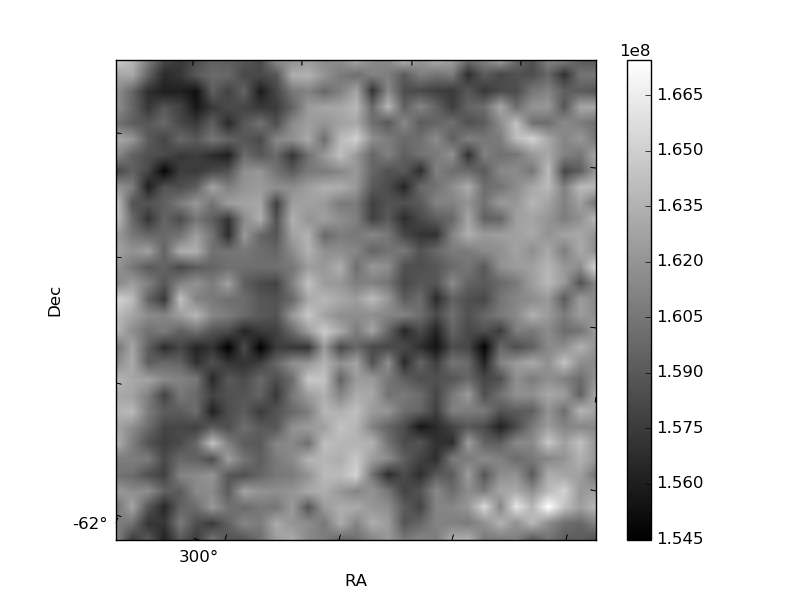
Histogram calculated using DETX and DETY for each event in the final _common_clean file
| Quadrant A | 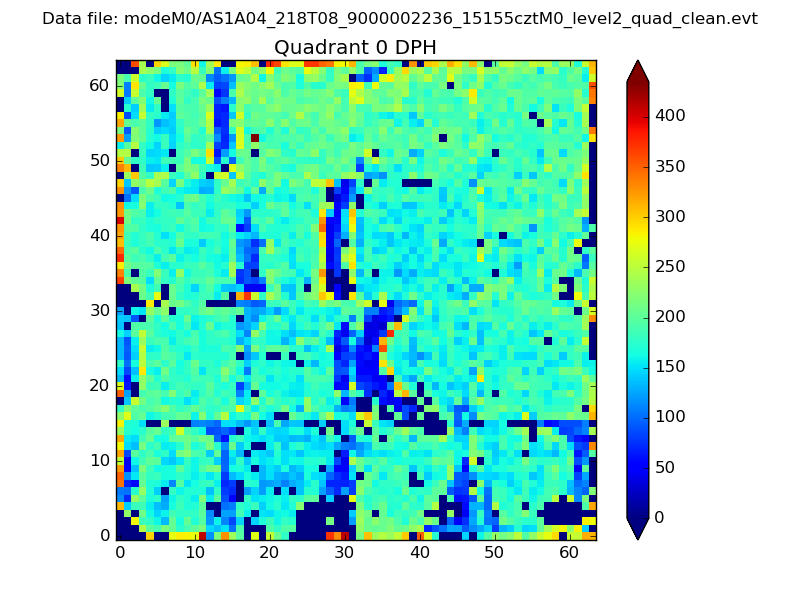 |
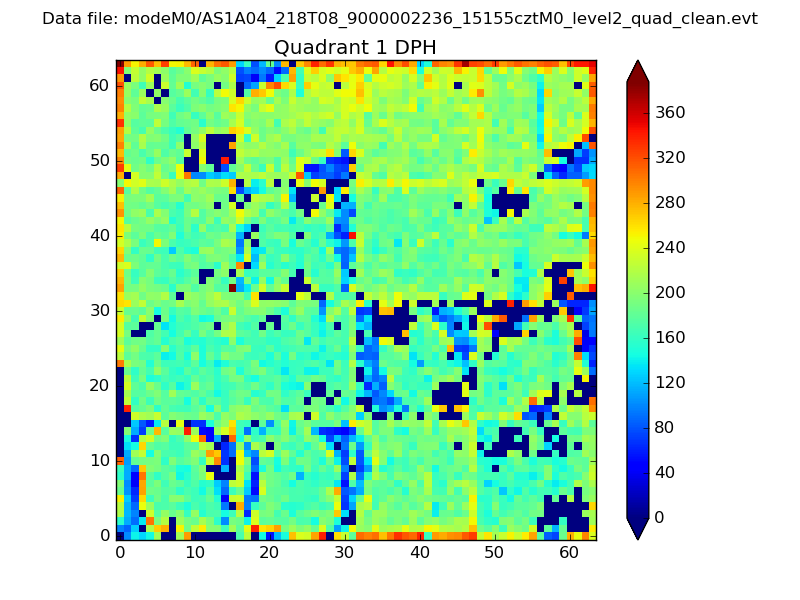 |
Quadrant B |
|---|---|---|---|
| Quadrant D | 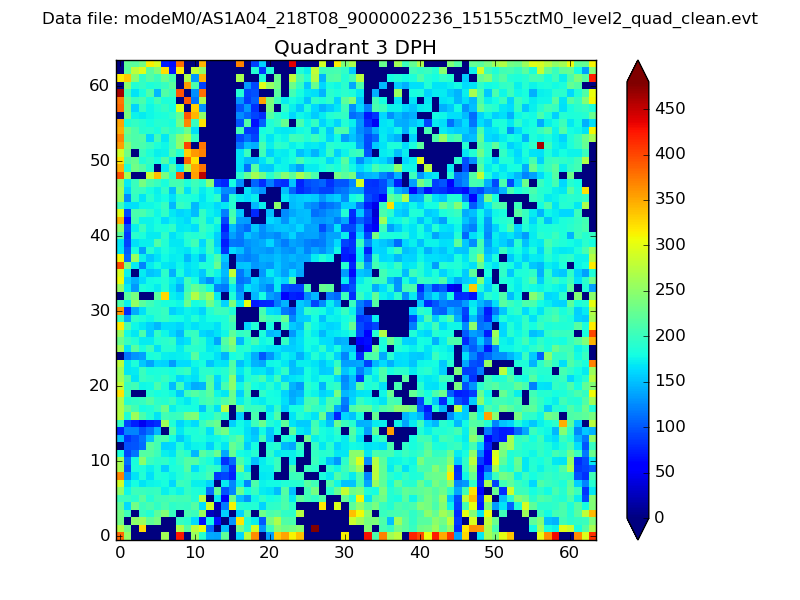 |
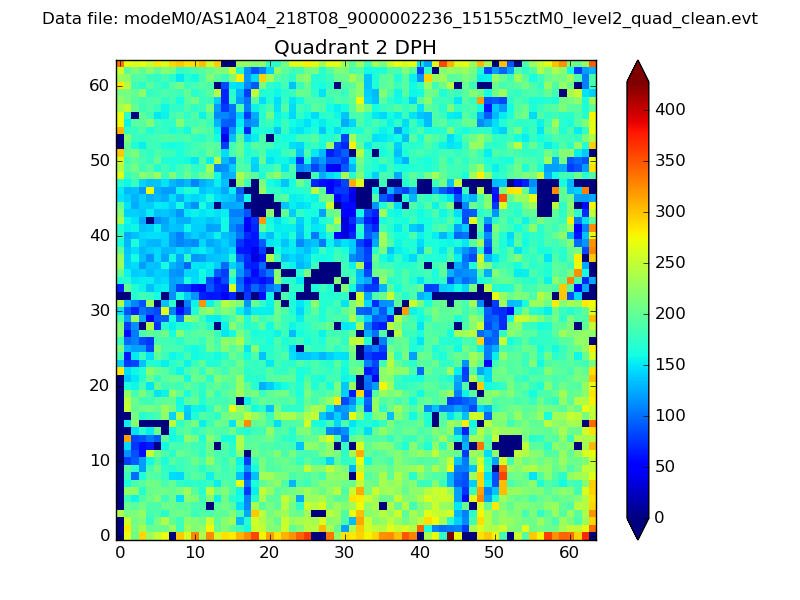 |
Quadrant C |
| Plot type | Count rate plots | Images |
|---|---|---|
| Comparison with Poisson distribution Blue bars denote a histogram of data divided into 1 sec bins. Red curve is a Poisson curve with rate = median count rate of data. |
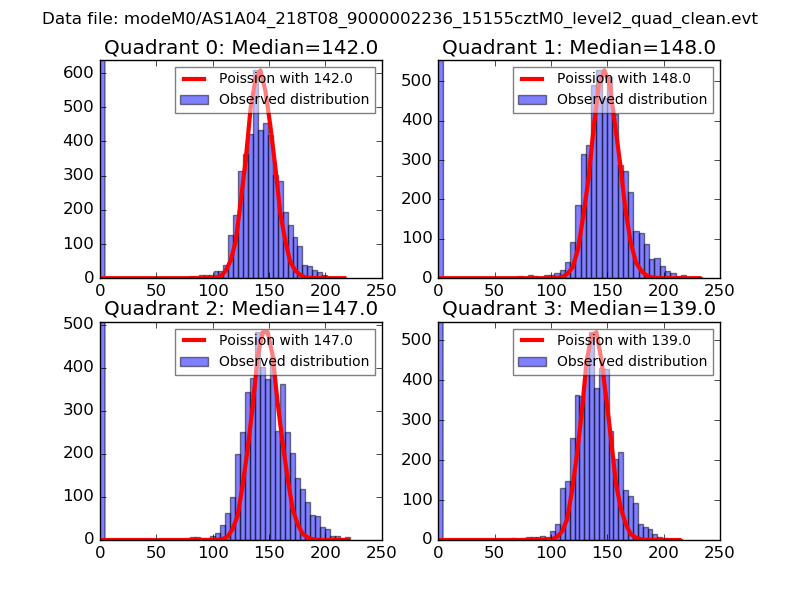 |
 |
| Quadrant-wise count rates Data is divided into 100 sec bins |
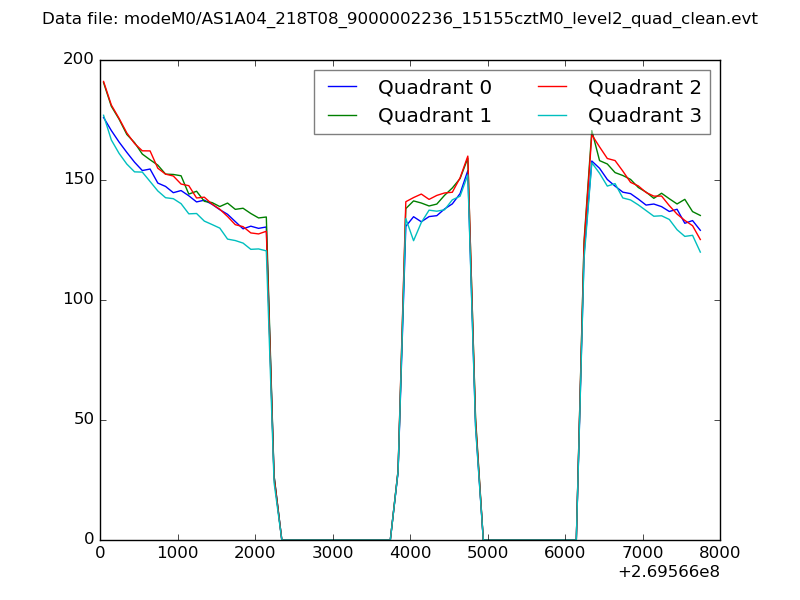 |
|
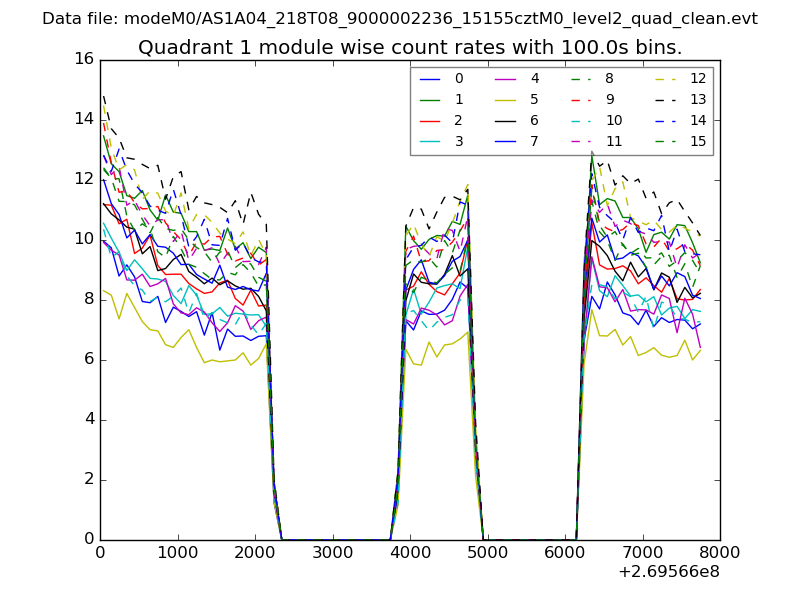
| Module-wise count rates for Quadrant A Data is divided into 100 sec bins |
 |
 |
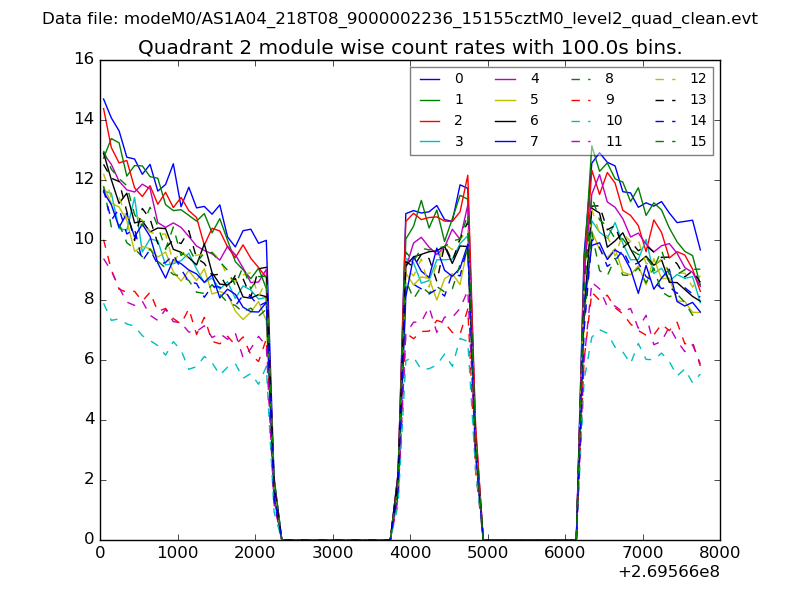
| Module-wise count rates for Quadrant B Data is divided into 100 sec bins |
 |
 |
| Module-wise count rates for Quadrant C Data is divided into 100 sec bins |
 |
 |
| Module-wise count rates for Quadrant D Data is divided into 100 sec bins |
 |
 |
| Parameter | Plot |
|---|---|
| CZT HV Monitor |  |
| D_VDD | 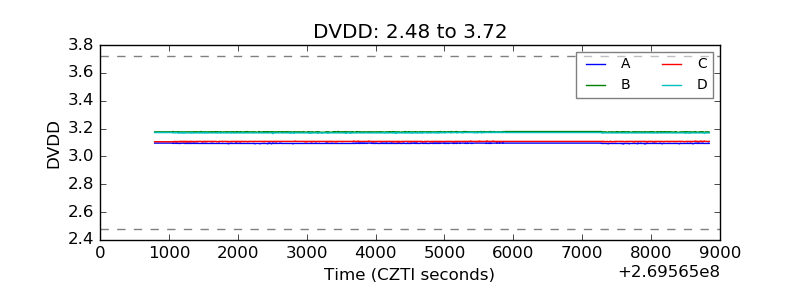 |
| Temperature 1 | 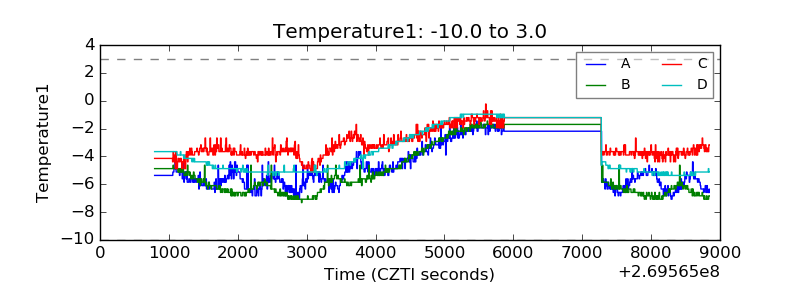 |
| Veto HV Monitor |  |
| Veto LLD | 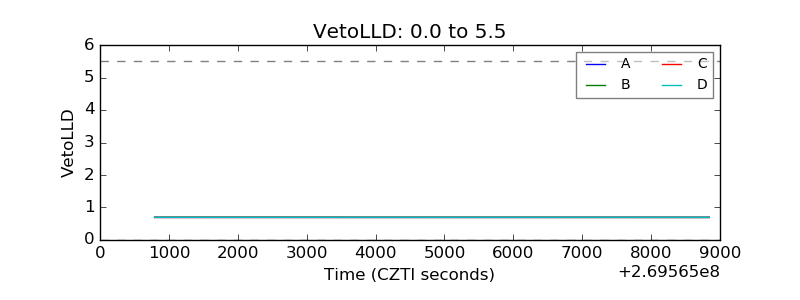 |
| Alpha Counter | 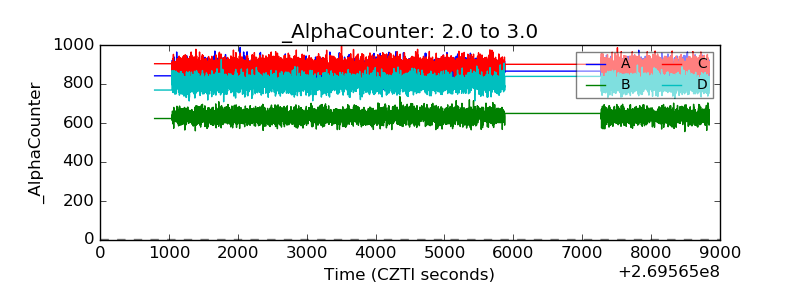 |
| _CPM_Rate | 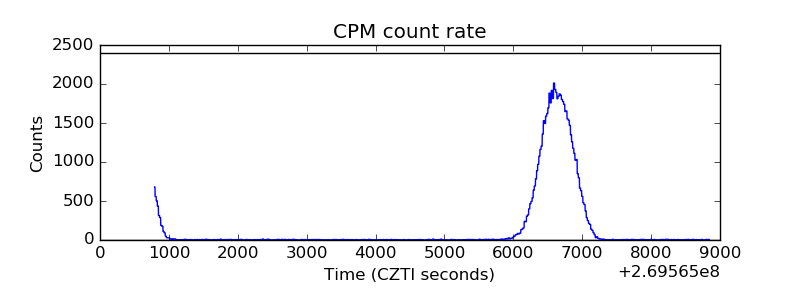 |
| CZT Counter | 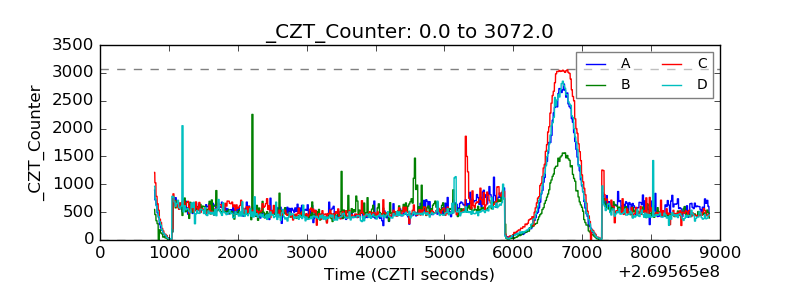 |
| +2.5 Volts monitor |  |
| +5 Volts monitor |  |
| _ROLL_ROT | 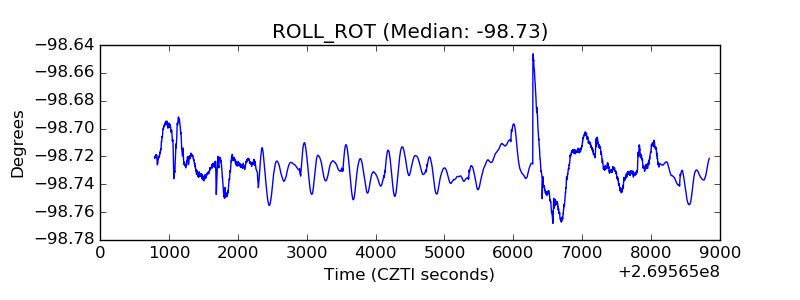 |
| _Roll_DEC | 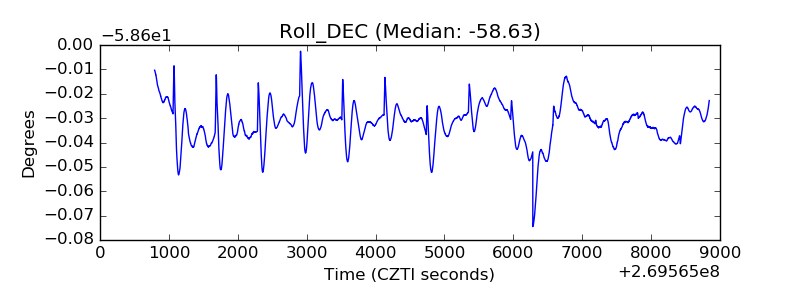 |
| _Roll_RA | 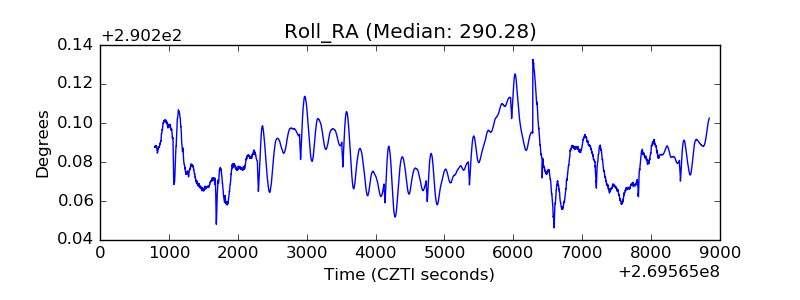 |
| Veto Counter | 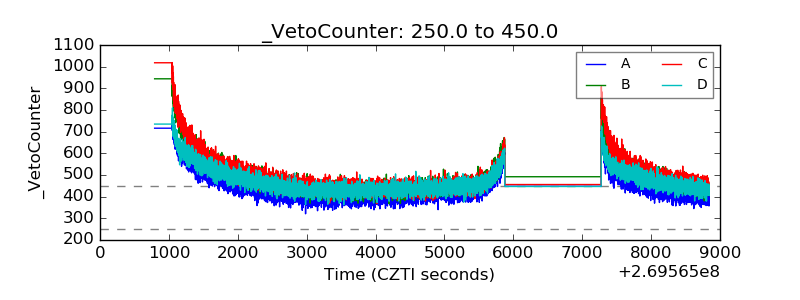 |