| Param | Original file | Final file |
|---|---|---|
| Filename | modeM0/AS1A04_218T08_9000002236_15156cztM0_level2.evt | modeM0/AS1A04_218T08_9000002236_15156cztM0_level2_quad_clean.evt |
| Size (bytes) | 455,065,920 | 102,170,880 |
| Size | 434.0 MB | 97.4 MB |
| Events in quadrant A | 3,650,852 | 655,398 |
| Events in quadrant B | 3,199,161 | 677,565 |
| Events in quadrant C | 3,243,518 | 675,315 |
| Events in quadrant D | 3,249,161 | 635,327 |
| Mode SS | |||
|---|---|---|---|
| Quadrant | BADHDUFLAG | Total packets | Discarded packets |
| A | 0 | 132 | 0 |
| B | 0 | 132 | 0 |
| C | 0 | 132 | 0 |
| D | 0 | 132 | 0 |
| Mode M9 | |||
|---|---|---|---|
| Quadrant | BADHDUFLAG | Total packets | Discarded packets |
| A | 0 | 12 | 0 |
| B | 0 | 12 | 0 |
| C | 0 | 12 | 0 |
| D | 0 | 12 | 0 |
| Mode M0 | |||
|---|---|---|---|
| Quadrant | BADHDUFLAG | Total packets | Discarded packets |
| A | 0 | 15408 | 3 |
| B | 0 | 13483 | 2 |
| C | 0 | 13515 | 2 |
| D | 0 | 14022 | 2 |
| Quadrant | Total seconds | Saturated seconds | Saturation percentage |
|---|---|---|---|
| A | 6460 | 34 | 0.526316% |
| B | 6460 | 45 | 0.696594% |
| C | 6460 | 28 | 0.433437% |
| D | 6461 | 56 | 0.866739% |
Noise dominated data is calculated using 1-second bins in cleaned event files. If a bin has >2000 counts, and if more than 50% of those come from <1% of pixels, then it is considered to be noise-dominated and hence unusable.
| Quadrant | # 1 sec bins | Bins with >0 counts | Bins with >2000 counts | High rate bins dominated by noise | Noise dominated (total time) | Noise dominated (detector-on time) | Marked lightcurve |
|---|---|---|---|---|---|---|---|
| A | 7696 | 6462 | 2 | 2 | 0.03% | 0.03% | 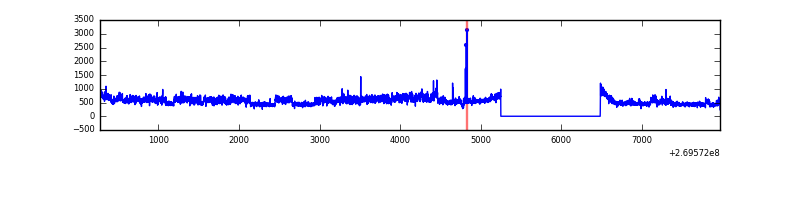 |
| B | 7696 | 6462 | 0 | 0 | 0.00% | 0.00% | 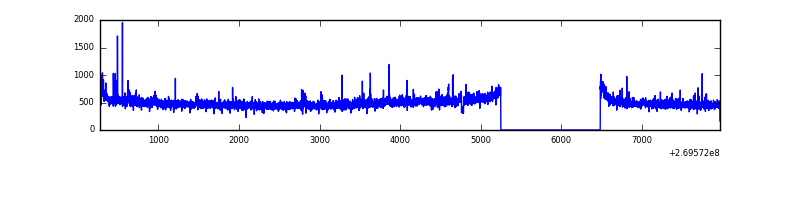 |
| C | 7696 | 6462 | 0 | 0 | 0.00% | 0.00% | 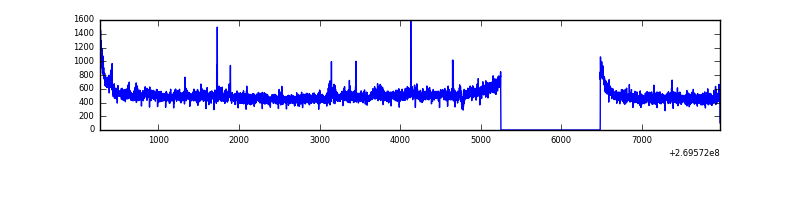 |
| D | 7697 | 6463 | 36 | 36 | 0.47% | 0.56% | 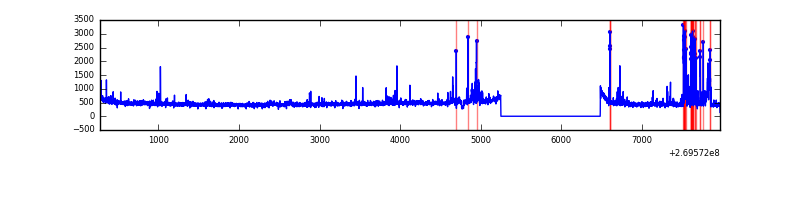 |
Top three noisy pixels from each quadrant. If the there are fewer than three noisy pixels in the level2.evt file, extra rows are filled as -1
| Pixel properties | Quadrant properties | ||||||
|---|---|---|---|---|---|---|---|
| Quadrant | DetID | PixID | Counts | Sigma | Mean | Median | Sigma |
| A | 15 | 239 | 623985 | 3990.16 | 782 | 765 | 156.2 |
| A | 12 | 189 | 11888 | 71.21 | 782 | 765 | 156.2 |
| A | 13 | 248 | 10888 | 64.81 | 782 | 765 | 156.2 |
| B | 0 | 229 | 23841 | 155.72 | 796 | 776 | 148.1 |
| B | 12 | 111 | 17326 | 111.73 | 796 | 776 | 148.1 |
| B | 3 | 64 | 15304 | 98.08 | 796 | 776 | 148.1 |
| C | 3 | 233 | 182899 | 1017.37 | 784 | 789 | 179.0 |
| C | 13 | 61 | 5458 | 26.08 | 784 | 789 | 179.0 |
| C | 9 | 236 | 2875 | 11.65 | 784 | 789 | 179.0 |
| D | 10 | 70 | 196124 | 1049.72 | 771 | 750 | 186.1 |
| D | 2 | 16 | 37550 | 197.72 | 771 | 750 | 186.1 |
| D | 2 | 234 | 22134 | 114.89 | 771 | 750 | 186.1 |
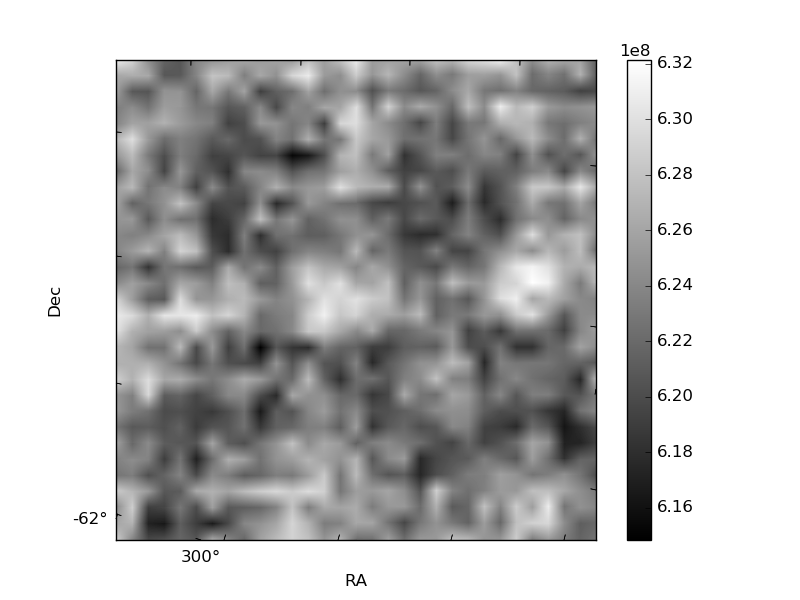
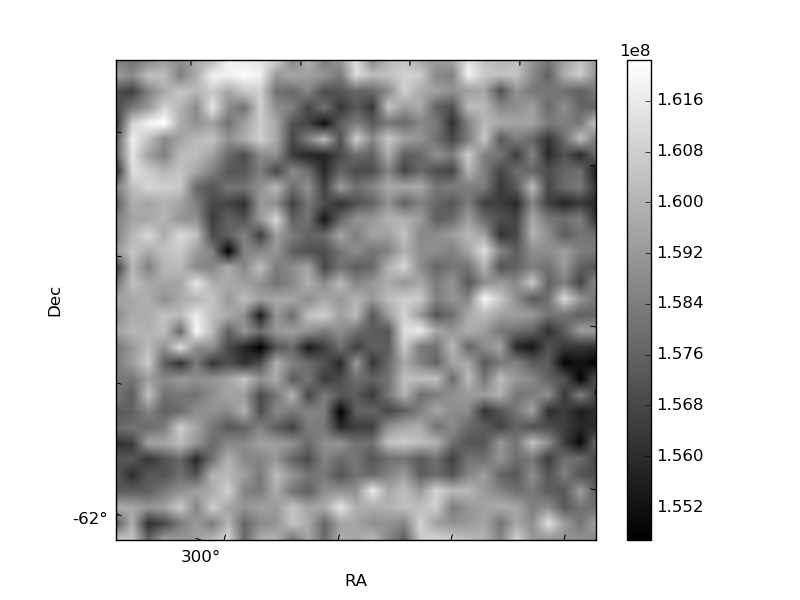
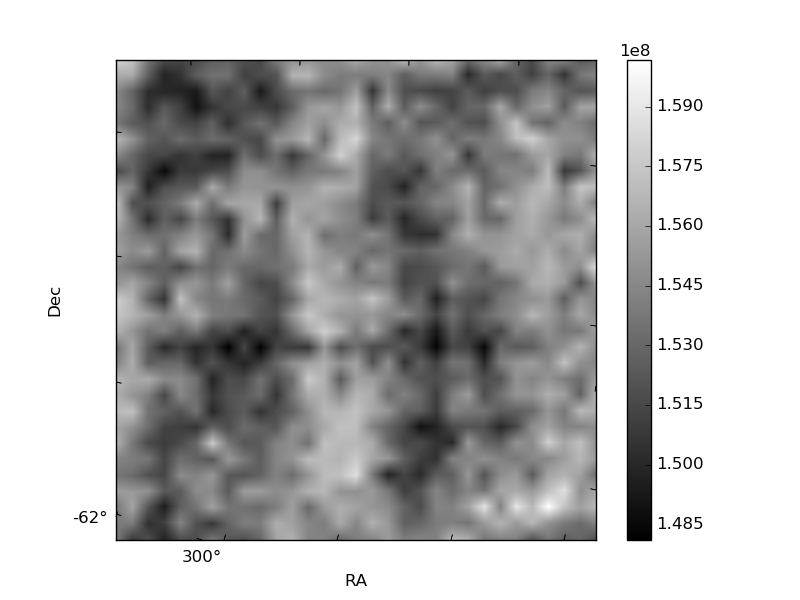
Histogram calculated using DETX and DETY for each event in the final _common_clean file
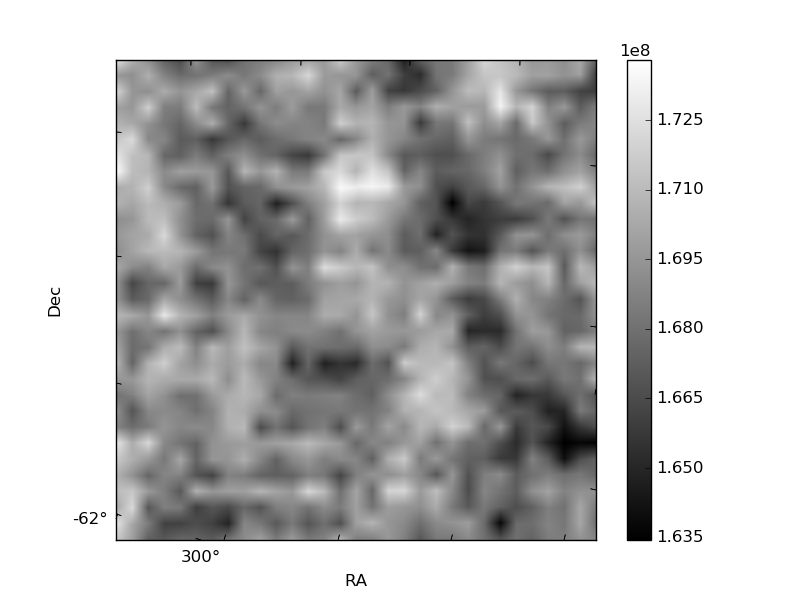
| Quadrant A | 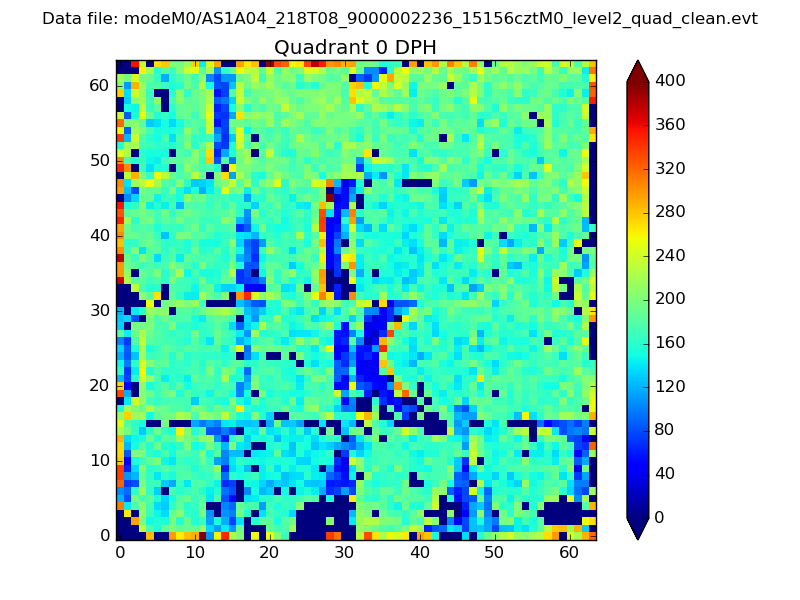 |
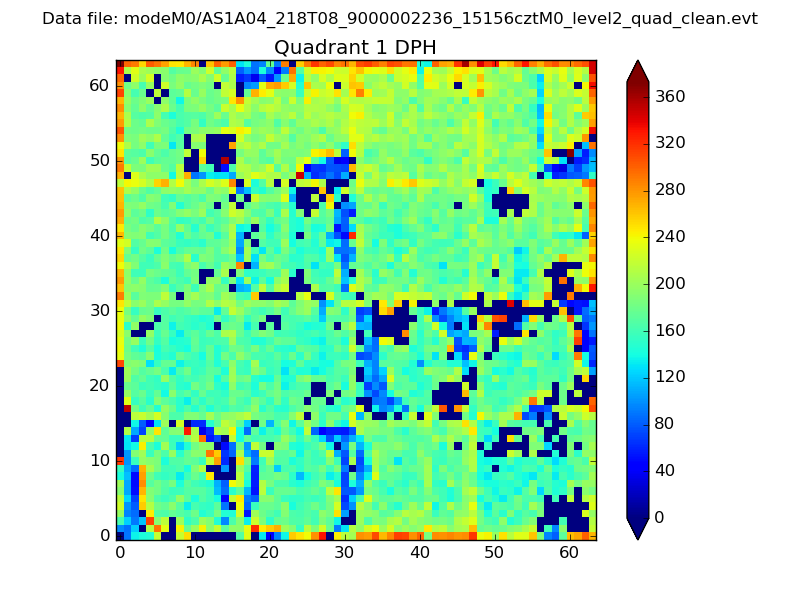 |
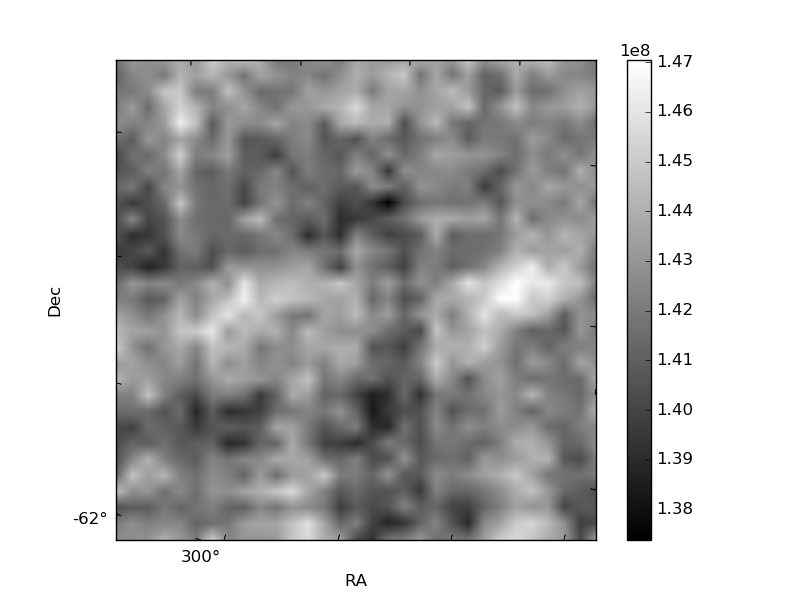
Quadrant B |
|---|---|---|---|
| Quadrant D | 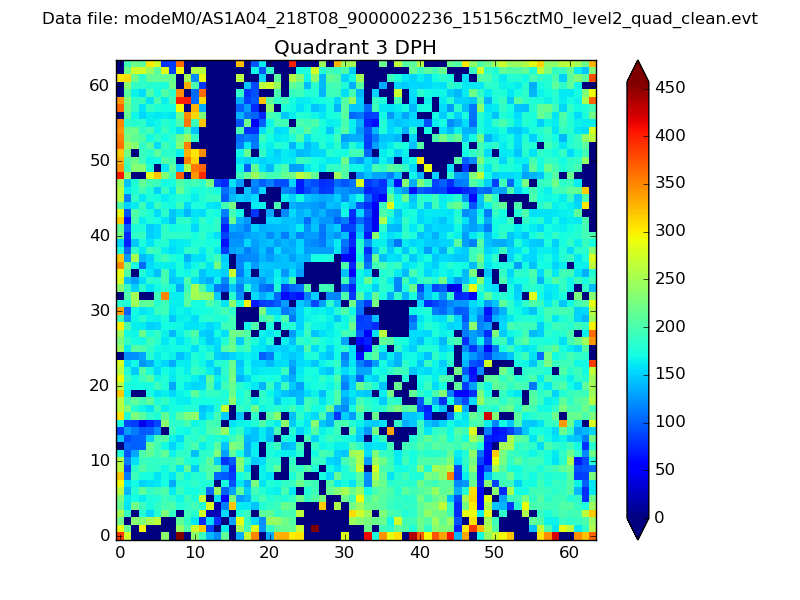 |
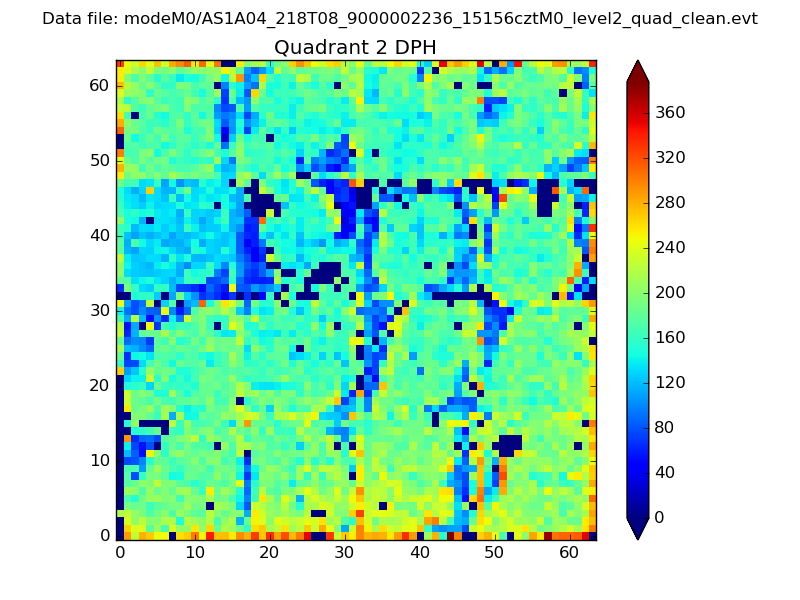 |
Quadrant C |
| Plot type | Count rate plots | Images |
|---|---|---|
| Comparison with Poisson distribution Blue bars denote a histogram of data divided into 1 sec bins. Red curve is a Poisson curve with rate = median count rate of data. |
 |
 |
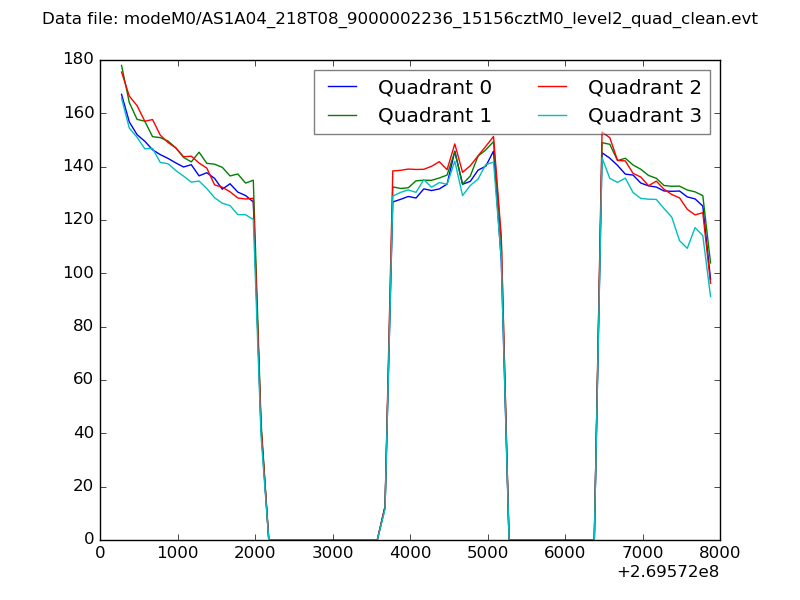
| Quadrant-wise count rates Data is divided into 100 sec bins |
 |
|
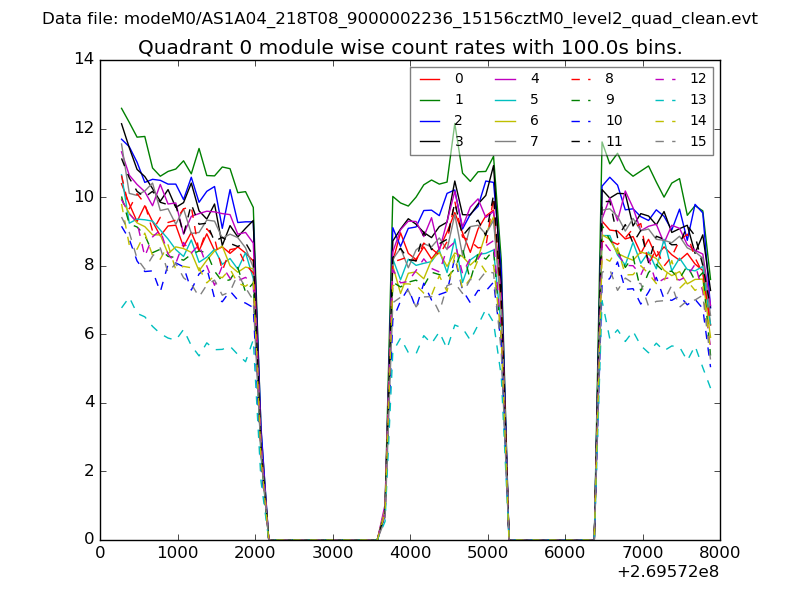
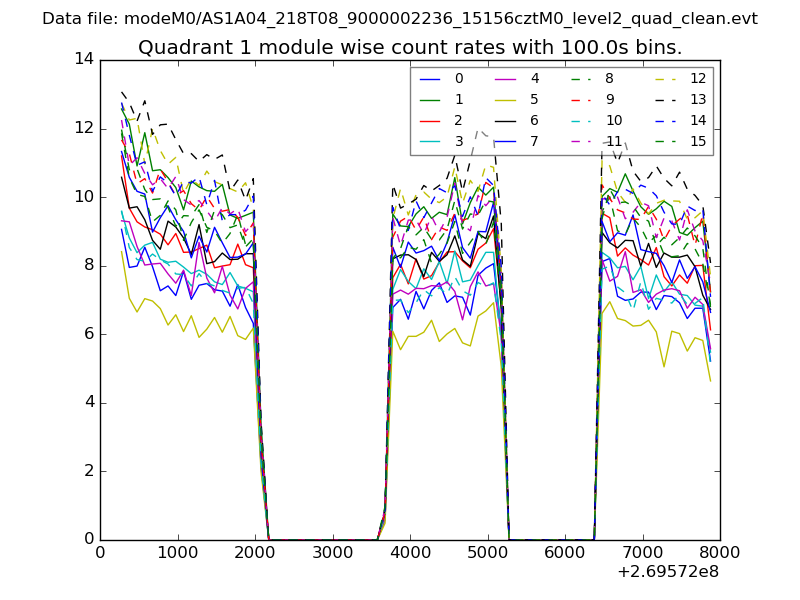
| Module-wise count rates for Quadrant A Data is divided into 100 sec bins |
 |
 |
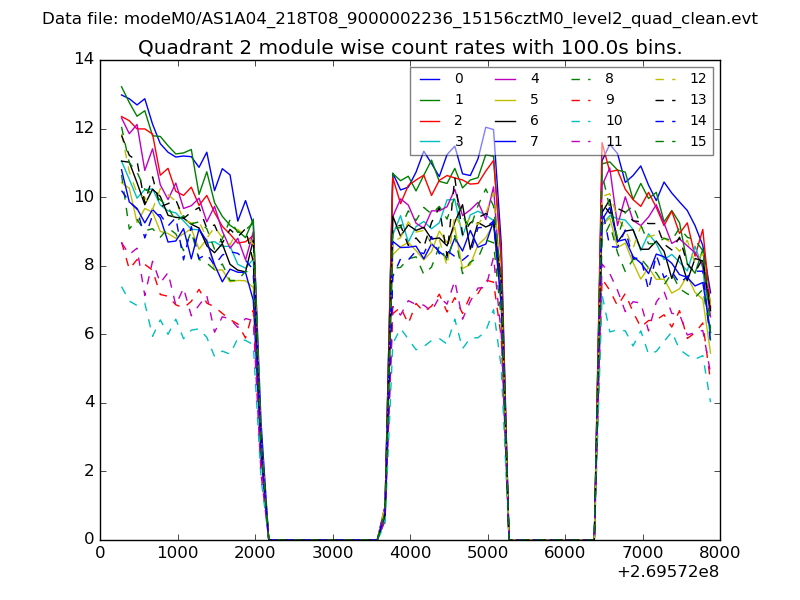
| Module-wise count rates for Quadrant B Data is divided into 100 sec bins |
 |
 |
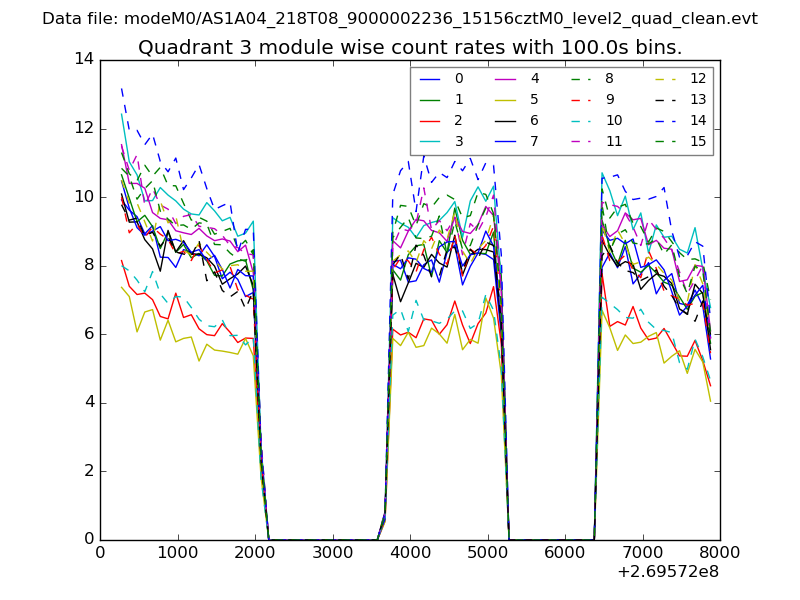
| Module-wise count rates for Quadrant C Data is divided into 100 sec bins |
 |
 |
| Module-wise count rates for Quadrant D Data is divided into 100 sec bins |
 |
 |
| Parameter | Plot |
|---|---|
| CZT HV Monitor | 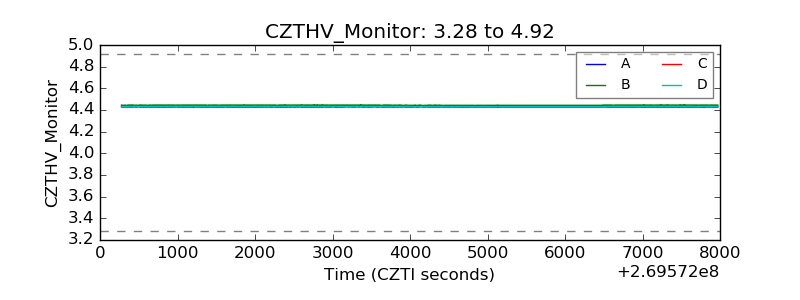 |
| D_VDD | 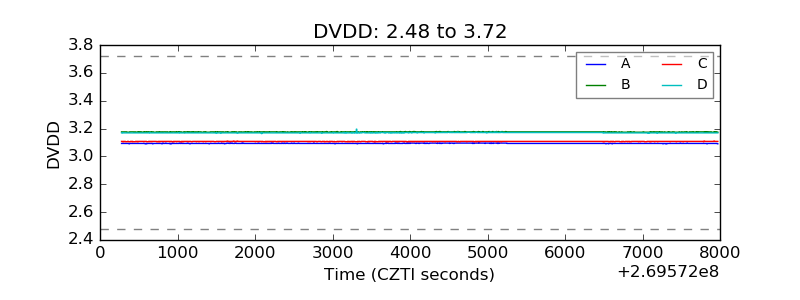 |
| Temperature 1 | 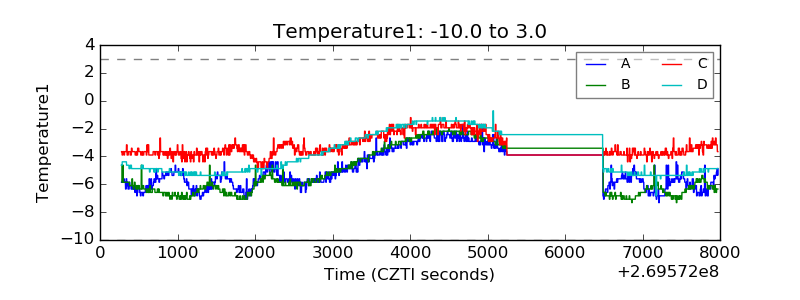 |
| Veto HV Monitor | 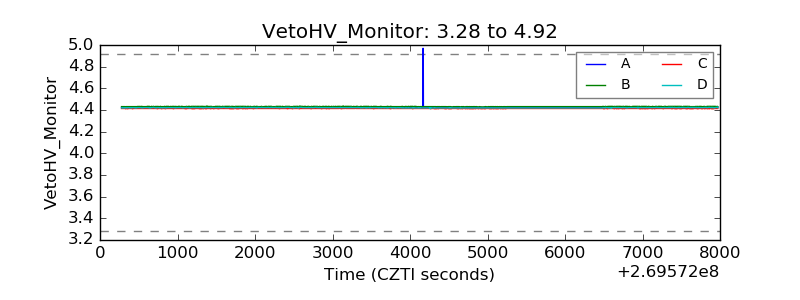 |
| Veto LLD | 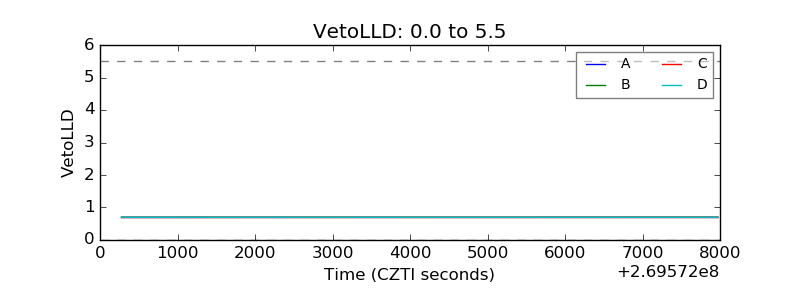 |
| Alpha Counter | 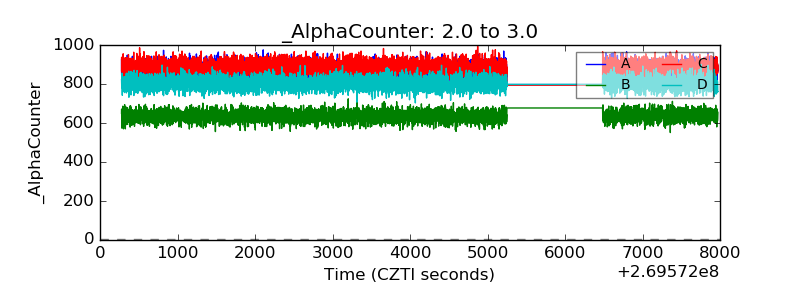 |
| _CPM_Rate | 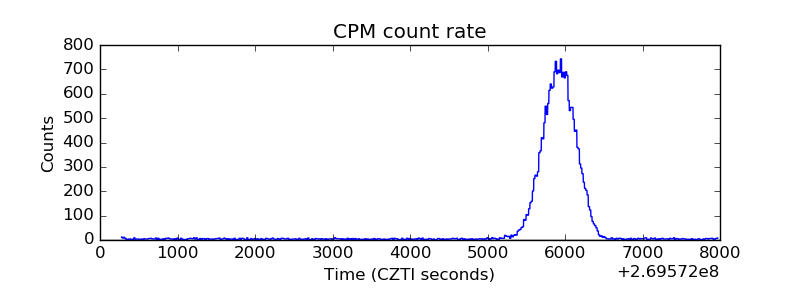 |
| CZT Counter | 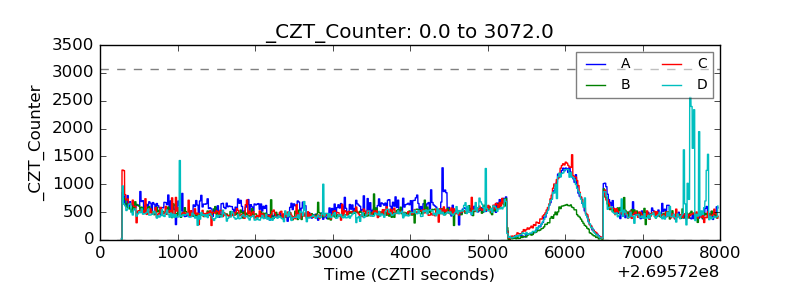 |
| +2.5 Volts monitor |  |
| +5 Volts monitor | 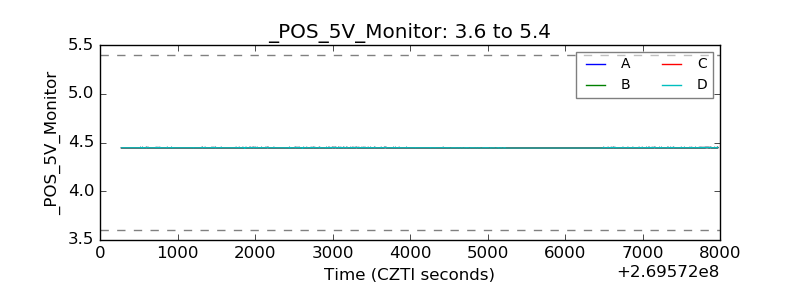 |
| _ROLL_ROT | 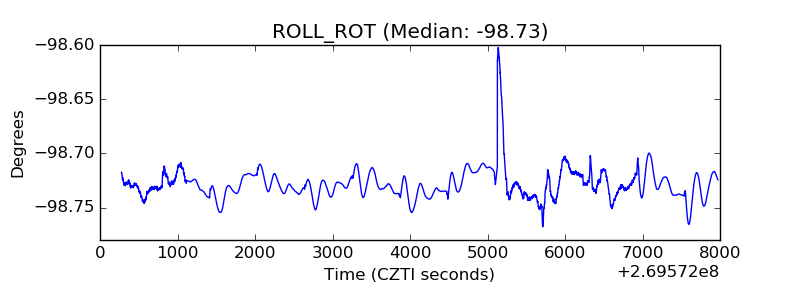 |
| _Roll_DEC | 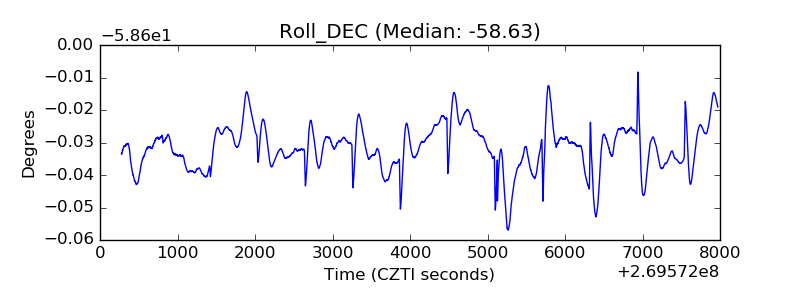 |
| _Roll_RA | 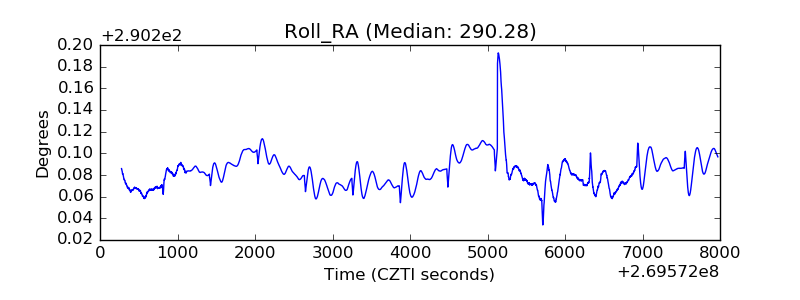 |
| Veto Counter | 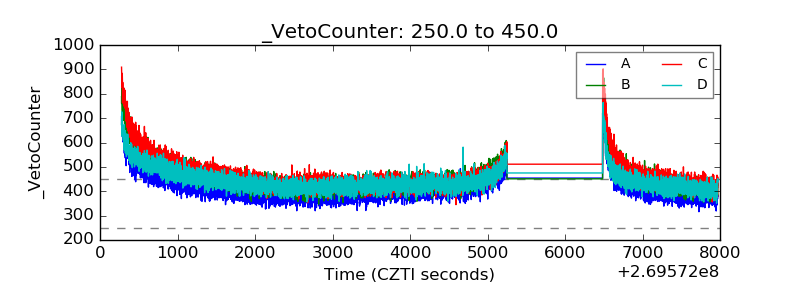 |