| Param | Original file | Final file |
|---|---|---|
| Filename | modeM0/AS1A04_218T08_9000002236_15157cztM0_level2.evt | modeM0/AS1A04_218T08_9000002236_15157cztM0_level2_quad_clean.evt |
| Size (bytes) | 495,259,200 | 103,158,720 |
| Size | 472.3 MB | 98.4 MB |
| Events in quadrant A | 4,052,389 | 658,435 |
| Events in quadrant B | 3,521,506 | 672,986 |
| Events in quadrant C | 3,318,383 | 672,941 |
| Events in quadrant D | 3,634,119 | 634,899 |
| Mode SS | |||
|---|---|---|---|
| Quadrant | BADHDUFLAG | Total packets | Discarded packets |
| A | 0 | 142 | 0 |
| B | 0 | 142 | 0 |
| C | 0 | 142 | 0 |
| D | 0 | 142 | 0 |
| Mode M9 | |||
|---|---|---|---|
| Quadrant | BADHDUFLAG | Total packets | Discarded packets |
| A | 0 | 21 | 0 |
| B | 0 | 21 | 0 |
| C | 0 | 21 | 0 |
| D | 0 | 21 | 0 |
| Mode M0 | |||
|---|---|---|---|
| Quadrant | BADHDUFLAG | Total packets | Discarded packets |
| A | 0 | 16977 | 3 |
| B | 0 | 14900 | 2 |
| C | 0 | 14352 | 2 |
| D | 0 | 15540 | 2 |
| Quadrant | Total seconds | Saturated seconds | Saturation percentage |
|---|---|---|---|
| A | 6967 | 76 | 1.090857% |
| B | 6967 | 90 | 1.291804% |
| C | 6967 | 61 | 0.875556% |
| D | 6967 | 109 | 1.564518% |
Noise dominated data is calculated using 1-second bins in cleaned event files. If a bin has >2000 counts, and if more than 50% of those come from <1% of pixels, then it is considered to be noise-dominated and hence unusable.
| Quadrant | # 1 sec bins | Bins with >0 counts | Bins with >2000 counts | High rate bins dominated by noise | Noise dominated (total time) | Noise dominated (detector-on time) | Marked lightcurve |
|---|---|---|---|---|---|---|---|
| A | 9078 | 6971 | 12 | 12 | 0.13% | 0.17% | 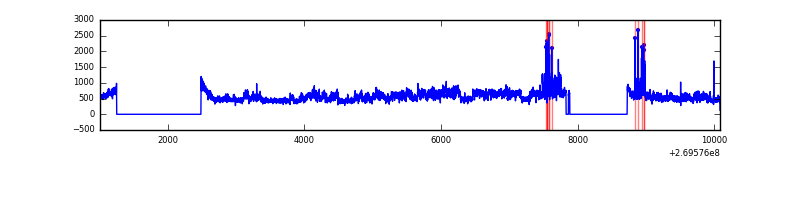 |
| B | 9078 | 6971 | 4 | 4 | 0.04% | 0.06% | 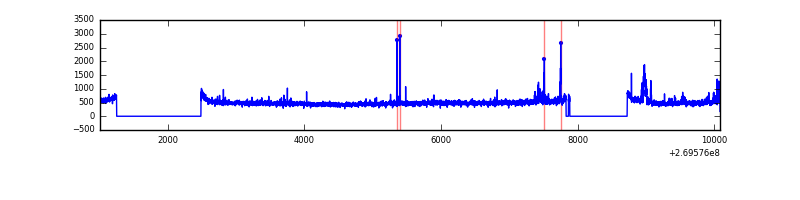 |
| C | 9078 | 6970 | 0 | 0 | 0.00% | 0.00% |  |
| D | 9078 | 6971 | 64 | 64 | 0.71% | 0.92% | 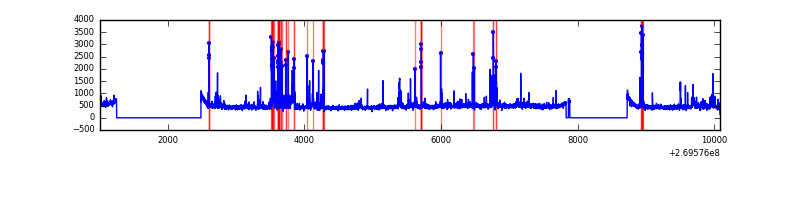 |
Top three noisy pixels from each quadrant. If the there are fewer than three noisy pixels in the level2.evt file, extra rows are filled as -1
| Pixel properties | Quadrant properties | ||||||
|---|---|---|---|---|---|---|---|
| Quadrant | DetID | PixID | Counts | Sigma | Mean | Median | Sigma |
| A | 15 | 239 | 842148 | 5035.79 | 831 | 813 | 167.1 |
| A | 12 | 189 | 14580 | 82.4 | 831 | 813 | 167.1 |
| A | 0 | 226 | 7234 | 38.43 | 831 | 813 | 167.1 |
| B | 3 | 64 | 176642 | 1112.34 | 841 | 818 | 158.1 |
| B | 4 | 48 | 27167 | 166.69 | 841 | 818 | 158.1 |
| B | 12 | 111 | 18741 | 113.39 | 841 | 818 | 158.1 |
| C | 3 | 233 | 100886 | 528.8 | 824 | 826 | 189.2 |
| C | 13 | 61 | 5884 | 26.73 | 824 | 826 | 189.2 |
| C | 14 | 234 | 3708 | 15.23 | 824 | 826 | 189.2 |
| D | 10 | 70 | 333844 | 1691.12 | 812 | 787 | 196.9 |
| D | 2 | 16 | 77865 | 391.37 | 812 | 787 | 196.9 |
| D | 2 | 33 | 71197 | 357.51 | 812 | 787 | 196.9 |
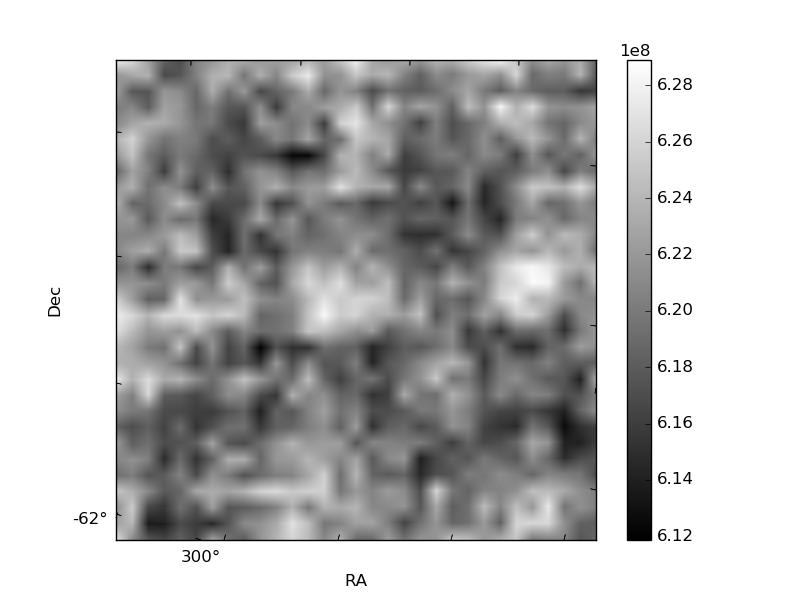
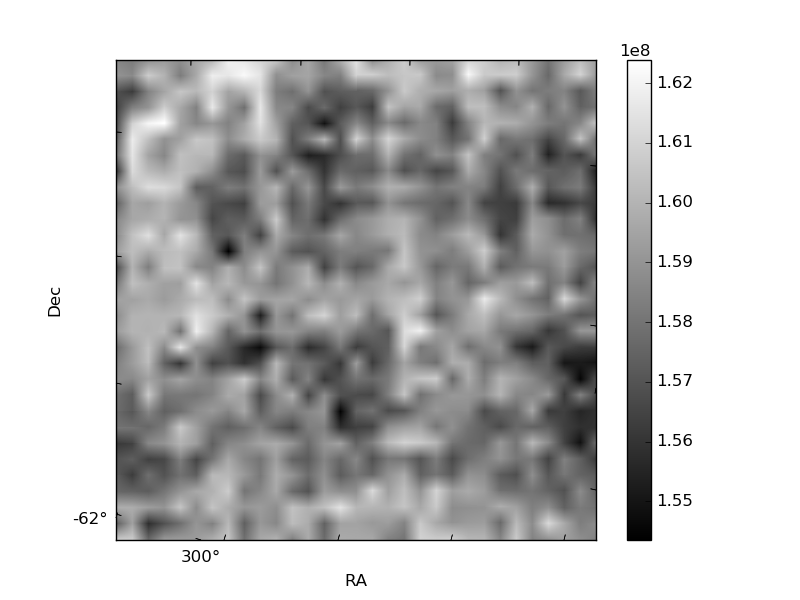
Histogram calculated using DETX and DETY for each event in the final _common_clean file
| Quadrant A | 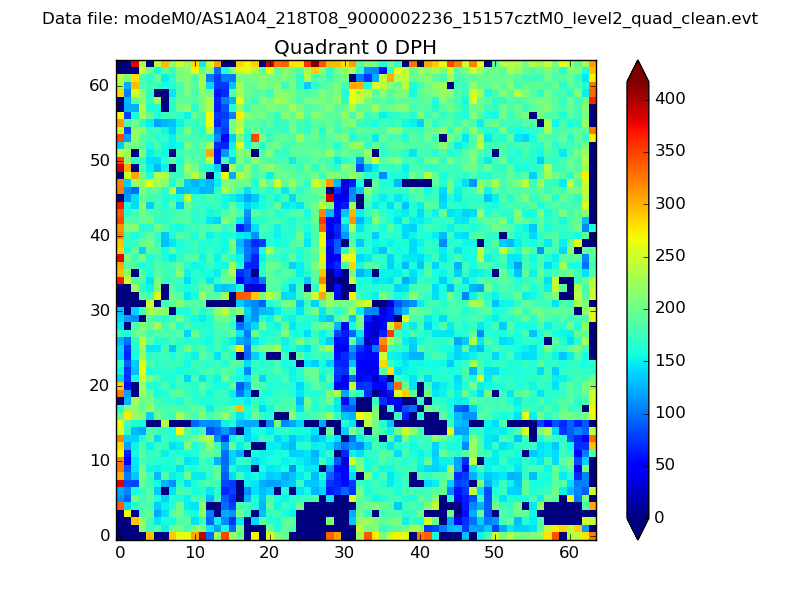 |
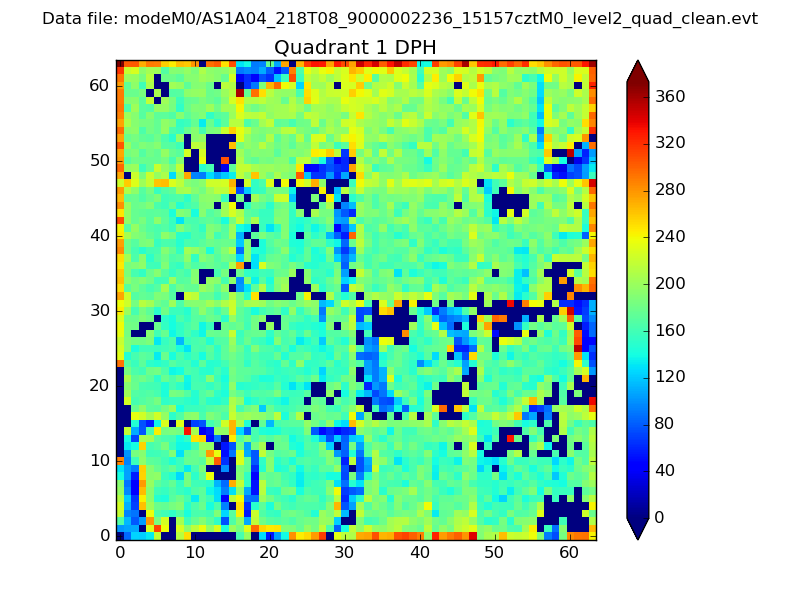 |
Quadrant B |
|---|---|---|---|
| Quadrant D |  |
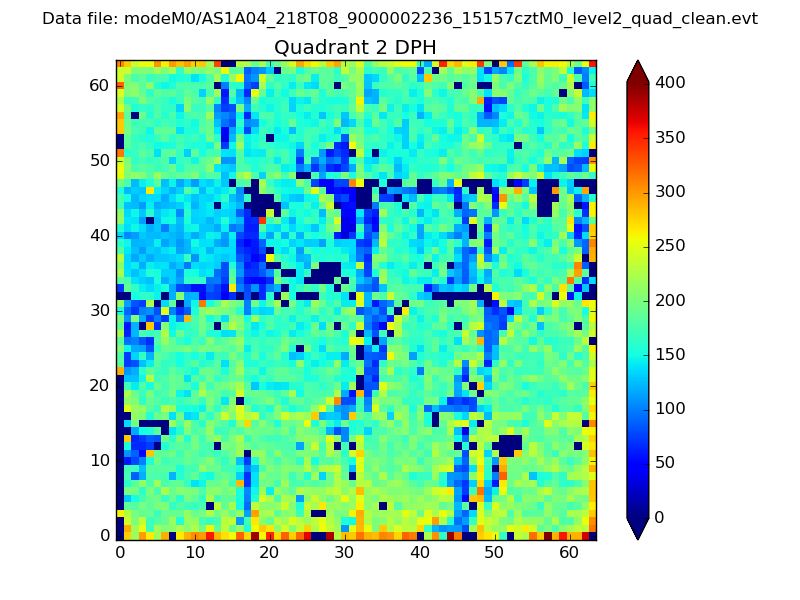 |
Quadrant C |
| Plot type | Count rate plots | Images |
|---|---|---|
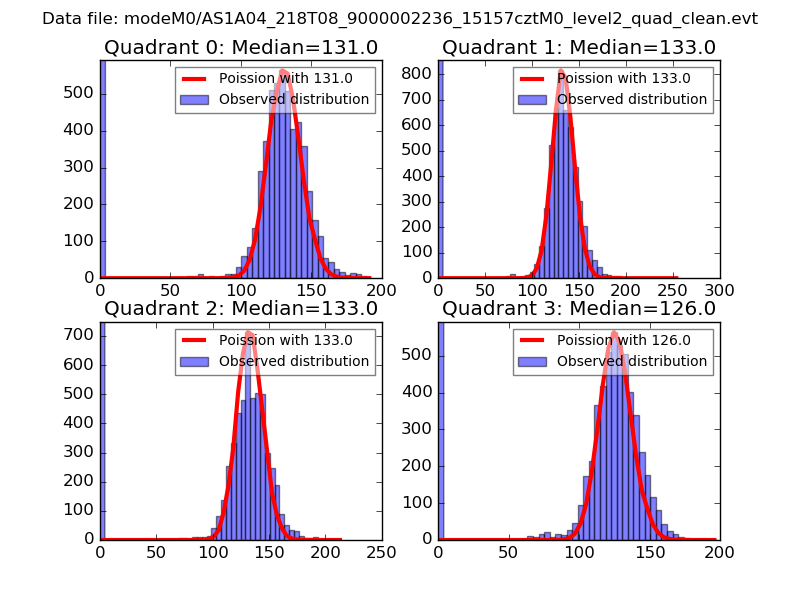
| Comparison with Poisson distribution Blue bars denote a histogram of data divided into 1 sec bins. Red curve is a Poisson curve with rate = median count rate of data. |
 |
 |
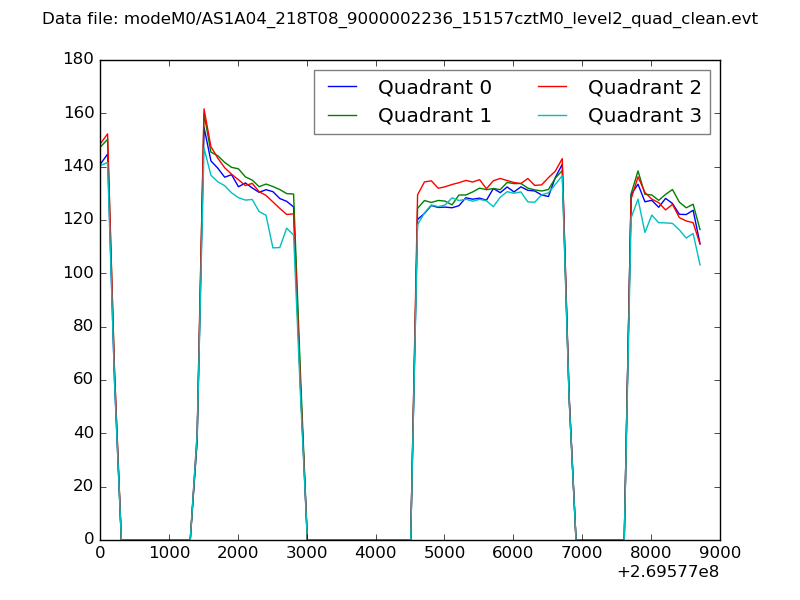
| Quadrant-wise count rates Data is divided into 100 sec bins |
 |
|
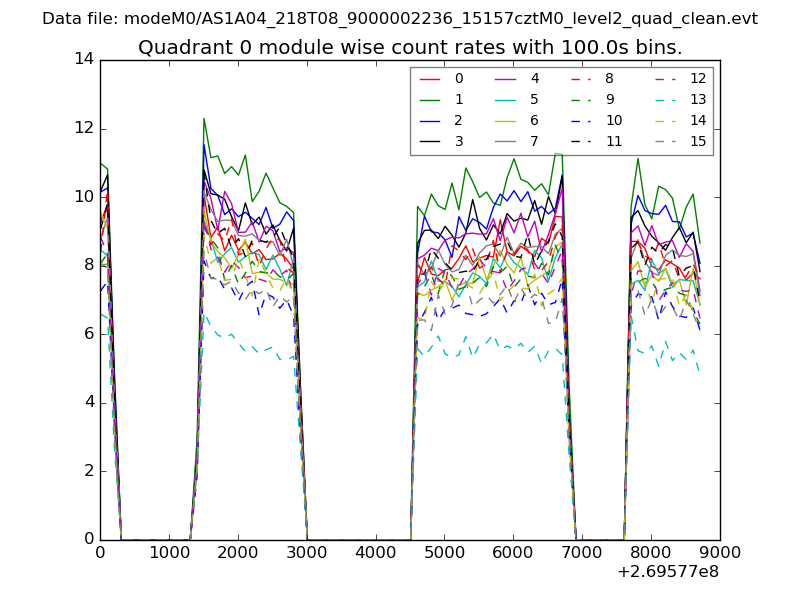
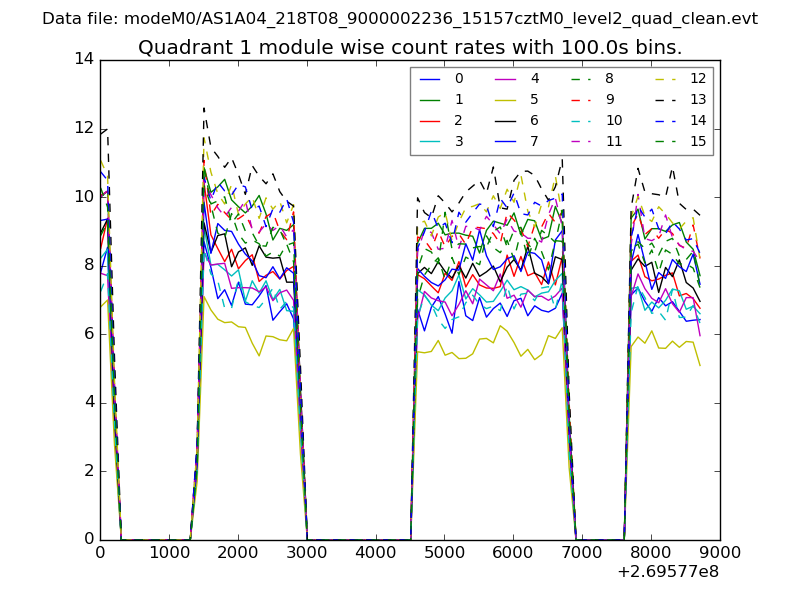
| Module-wise count rates for Quadrant A Data is divided into 100 sec bins |
 |
 |
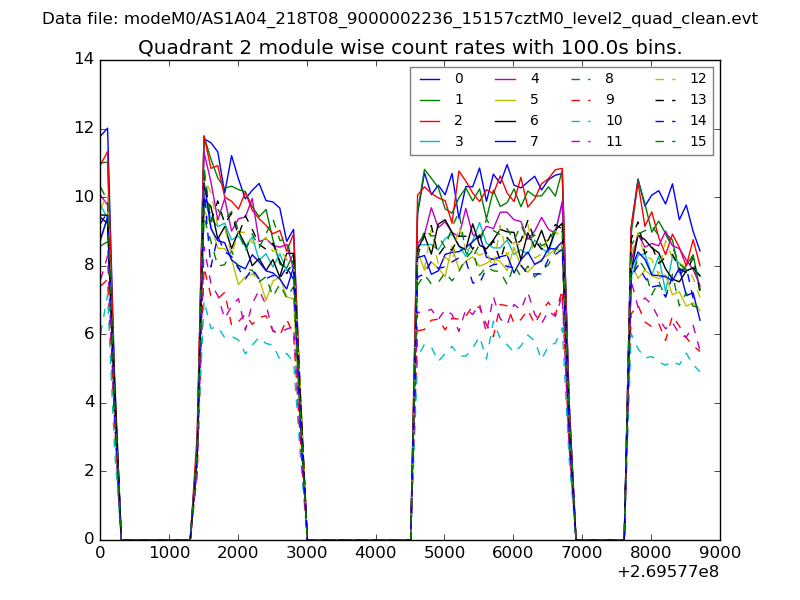
| Module-wise count rates for Quadrant B Data is divided into 100 sec bins |
 |
 |
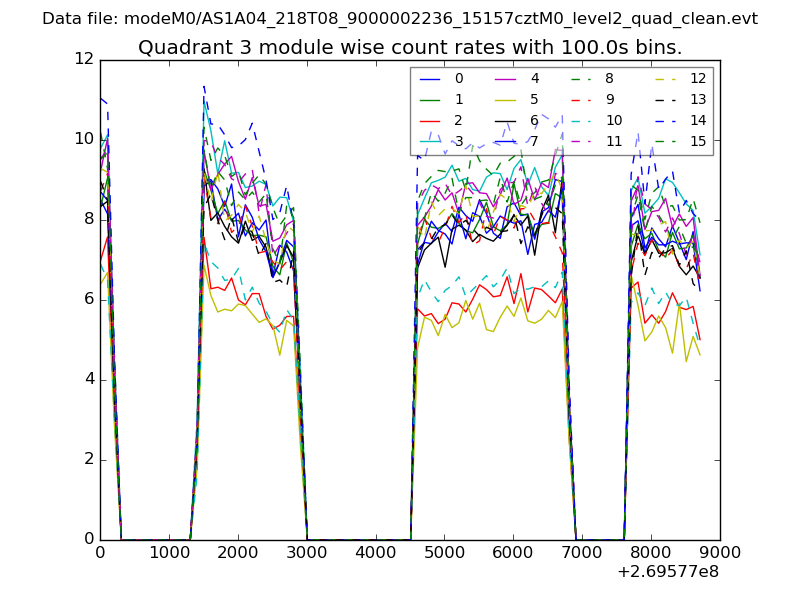
| Module-wise count rates for Quadrant C Data is divided into 100 sec bins |
 |
 |
| Module-wise count rates for Quadrant D Data is divided into 100 sec bins |
 |
 |
| Parameter | Plot |
|---|---|
| CZT HV Monitor |  |
| D_VDD | 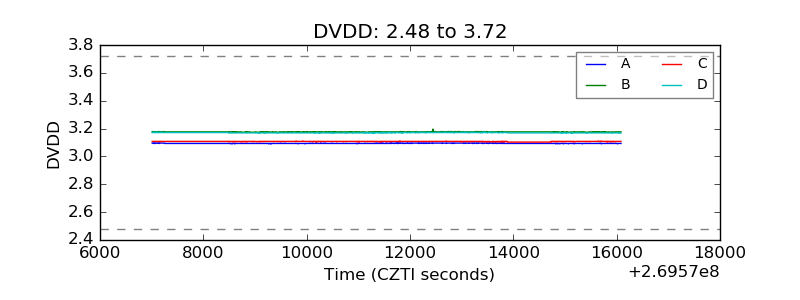 |
| Temperature 1 | 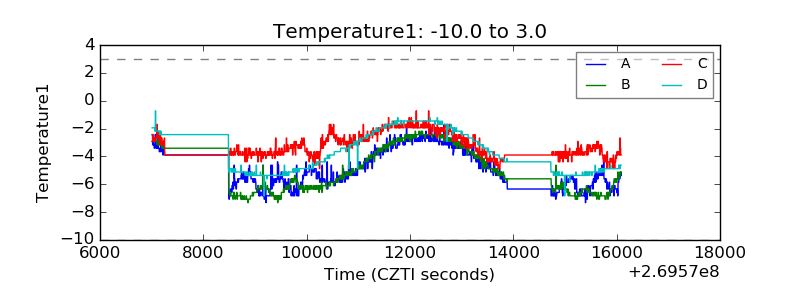 |
| Veto HV Monitor | 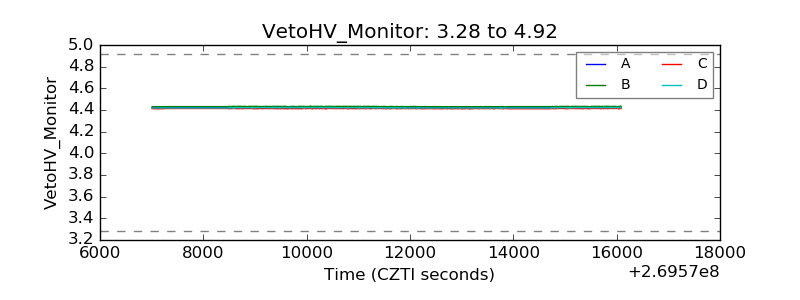 |
| Veto LLD | 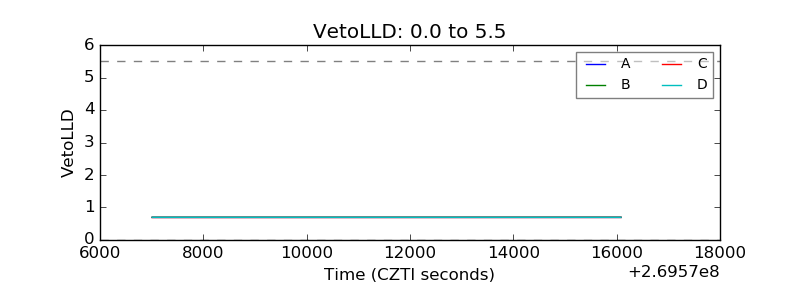 |
| Alpha Counter | 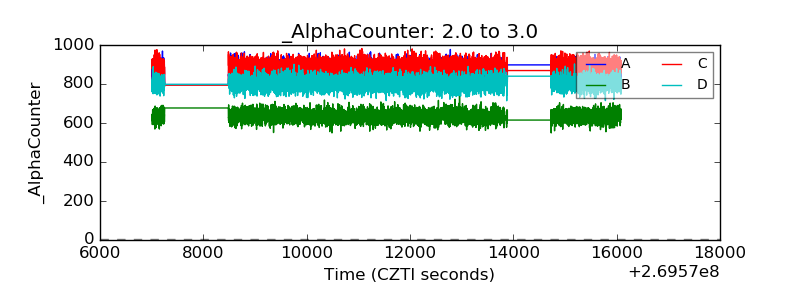 |
| _CPM_Rate | 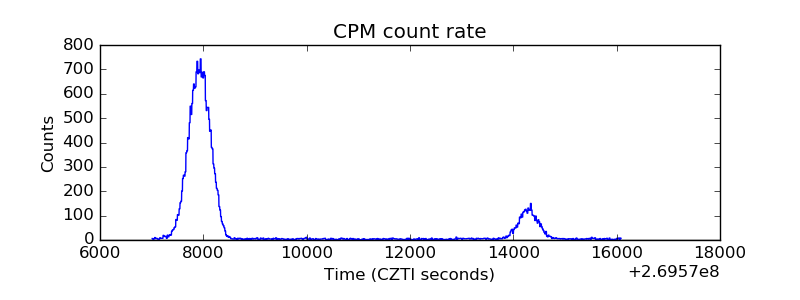 |
| CZT Counter | 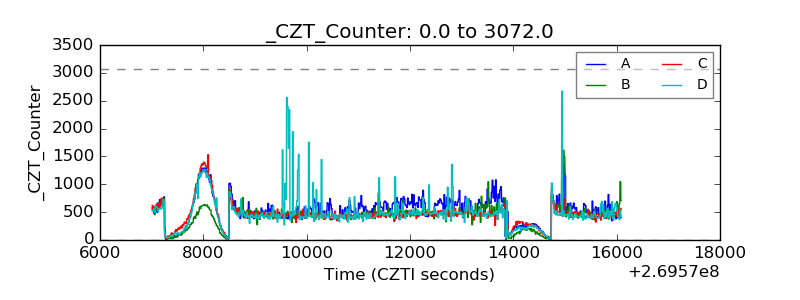 |
| +2.5 Volts monitor |  |
| +5 Volts monitor |  |
| _ROLL_ROT | 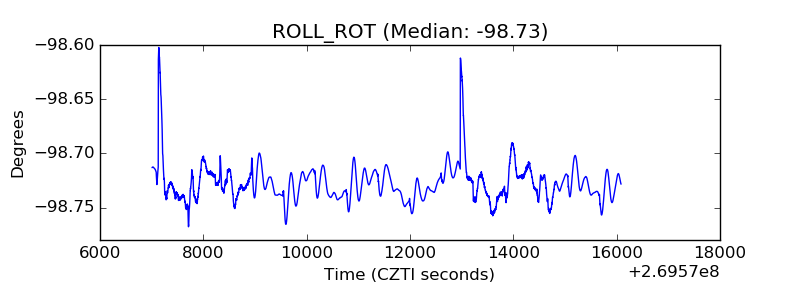 |
| _Roll_DEC | 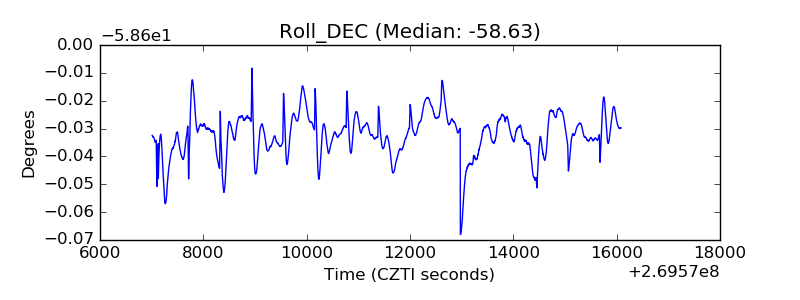 |
| _Roll_RA | 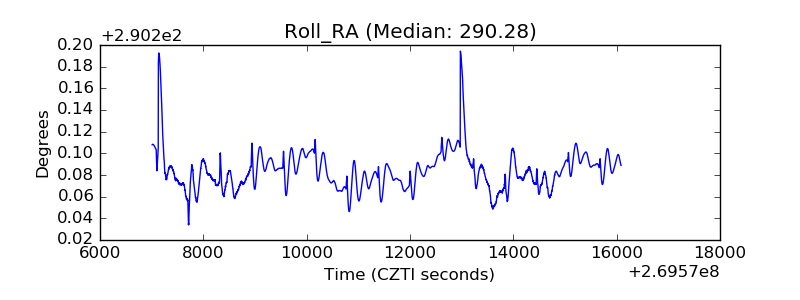 |
| Veto Counter | 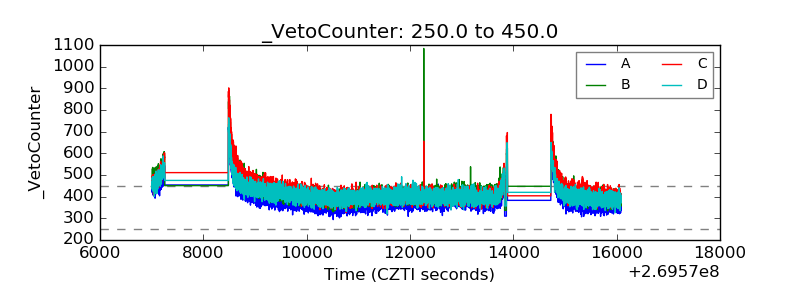 |