| Param | Original file | Final file |
|---|---|---|
| Filename | modeM0/AS1A04_218T08_9000002236_15159cztM0_level2.evt | modeM0/AS1A04_218T08_9000002236_15159cztM0_level2_quad_clean.evt |
| Size (bytes) | 539,565,120 | 97,508,160 |
| Size | 514.6 MB | 93.0 MB |
| Events in quadrant A | 4,022,598 | 601,373 |
| Events in quadrant B | 3,893,522 | 611,124 |
| Events in quadrant C | 4,042,850 | 616,159 |
| Events in quadrant D | 3,853,074 | 582,610 |
| Mode SS | |||
|---|---|---|---|
| Quadrant | BADHDUFLAG | Total packets | Discarded packets |
| A | 0 | 156 | 0 |
| B | 0 | 156 | 0 |
| C | 0 | 156 | 0 |
| D | 0 | 156 | 0 |
| Mode M9 | |||
|---|---|---|---|
| Quadrant | BADHDUFLAG | Total packets | Discarded packets |
| A | 0 | 2 | 0 |
| B | 0 | 2 | 0 |
| C | 0 | 2 | 0 |
| D | 0 | 3 | 0 |
| Mode M0 | |||
|---|---|---|---|
| Quadrant | BADHDUFLAG | Total packets | Discarded packets |
| A | 0 | 17036 | 3 |
| B | 0 | 16700 | 2 |
| C | 0 | 16644 | 2 |
| D | 0 | 16959 | 2 |
| Quadrant | Total seconds | Saturated seconds | Saturation percentage |
|---|---|---|---|
| A | 7790 | 257 | 3.299101% |
| B | 7790 | 293 | 3.761232% |
| C | 7790 | 220 | 2.824134% |
| D | 7790 | 272 | 3.491656% |
Noise dominated data is calculated using 1-second bins in cleaned event files. If a bin has >2000 counts, and if more than 50% of those come from <1% of pixels, then it is considered to be noise-dominated and hence unusable.
| Quadrant | # 1 sec bins | Bins with >0 counts | Bins with >2000 counts | High rate bins dominated by noise | Noise dominated (total time) | Noise dominated (detector-on time) | Marked lightcurve |
|---|---|---|---|---|---|---|---|
| A | 7836 | 7790 | 1 | 1 | 0.01% | 0.01% | 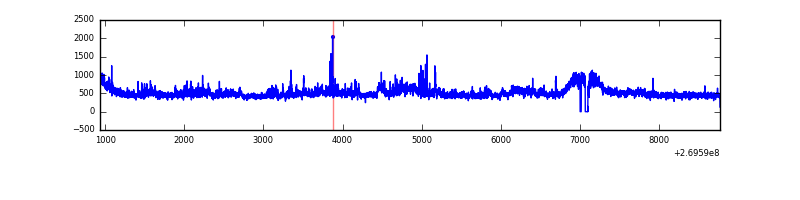 |
| B | 7836 | 7789 | 28 | 28 | 0.36% | 0.36% | 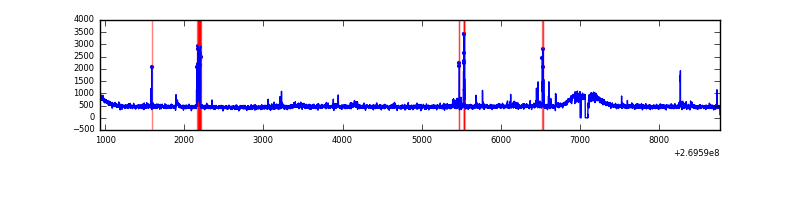 |
| C | 7836 | 7790 | 9 | 9 | 0.11% | 0.12% | 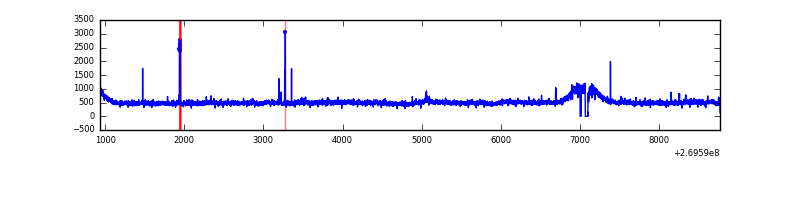 |
| D | 7836 | 7790 | 59 | 59 | 0.75% | 0.76% | 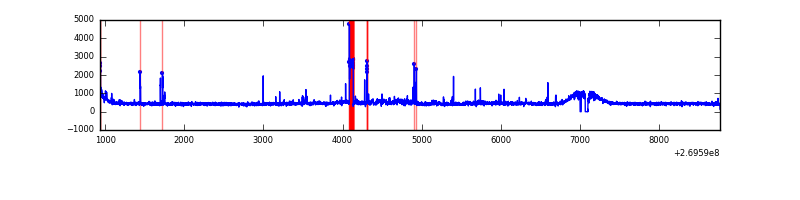 |
Top three noisy pixels from each quadrant. If the there are fewer than three noisy pixels in the level2.evt file, extra rows are filled as -1
| Pixel properties | Quadrant properties | ||||||
|---|---|---|---|---|---|---|---|
| Quadrant | DetID | PixID | Counts | Sigma | Mean | Median | Sigma |
| A | 15 | 239 | 368347 | 1935.06 | 937 | 913 | 189.9 |
| A | 13 | 248 | 22095 | 111.55 | 937 | 913 | 189.9 |
| A | 12 | 189 | 21799 | 109.99 | 937 | 913 | 189.9 |
| B | 0 | 229 | 92151 | 500.45 | 937 | 908 | 182.3 |
| B | 3 | 64 | 89773 | 487.4 | 937 | 908 | 182.3 |
| B | 12 | 111 | 21848 | 114.85 | 937 | 908 | 182.3 |
| C | 3 | 233 | 369179 | 1717.52 | 926 | 930 | 214.4 |
| C | 14 | 234 | 42607 | 194.38 | 926 | 930 | 214.4 |
| C | 9 | 236 | 20501 | 91.28 | 926 | 930 | 214.4 |
| D | 2 | 16 | 135542 | 598.21 | 922 | 892 | 225.1 |
| D | 1 | 255 | 125982 | 555.73 | 922 | 892 | 225.1 |
| D | 7 | 38 | 32724 | 141.42 | 922 | 892 | 225.1 |
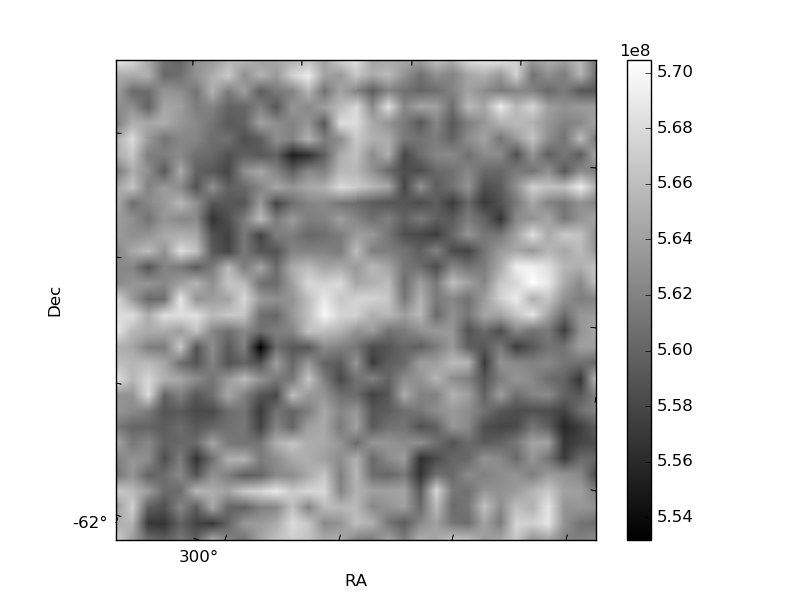
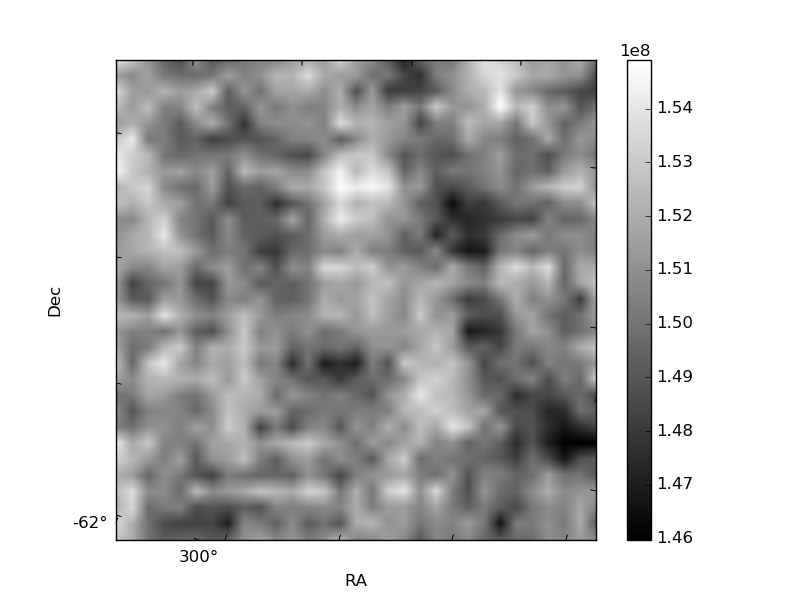
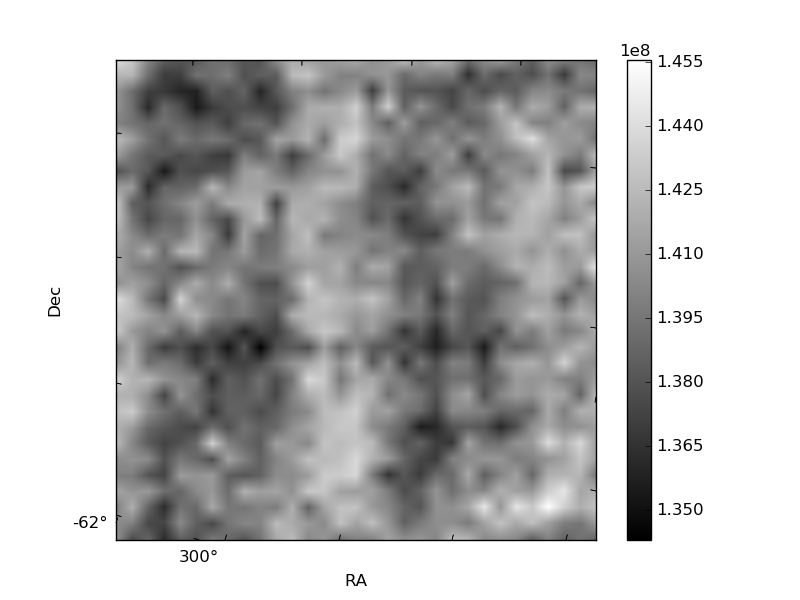
Histogram calculated using DETX and DETY for each event in the final _common_clean file
| Quadrant A | 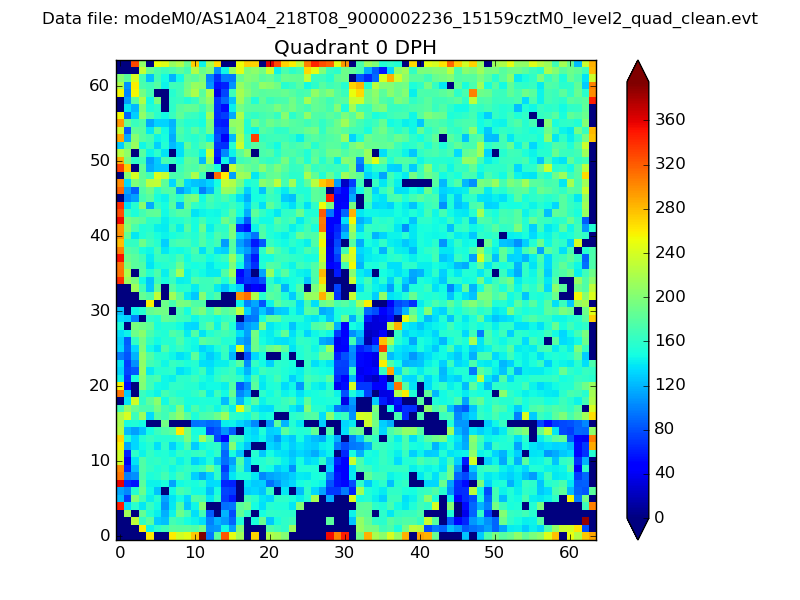 |
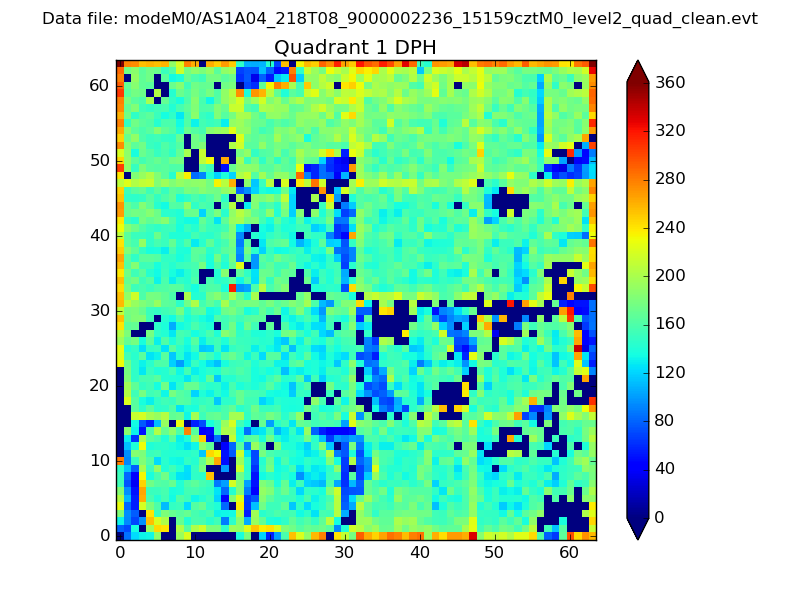 |
Quadrant B |
|---|---|---|---|
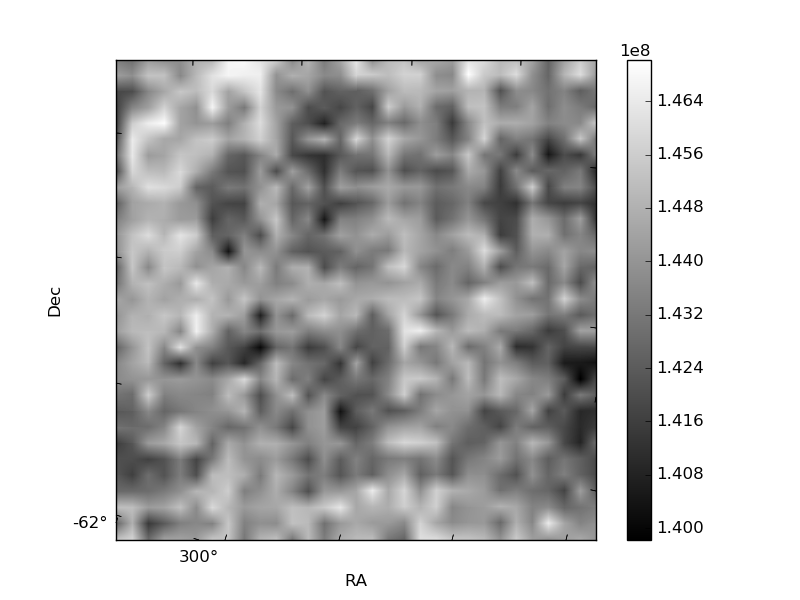
| Quadrant D | 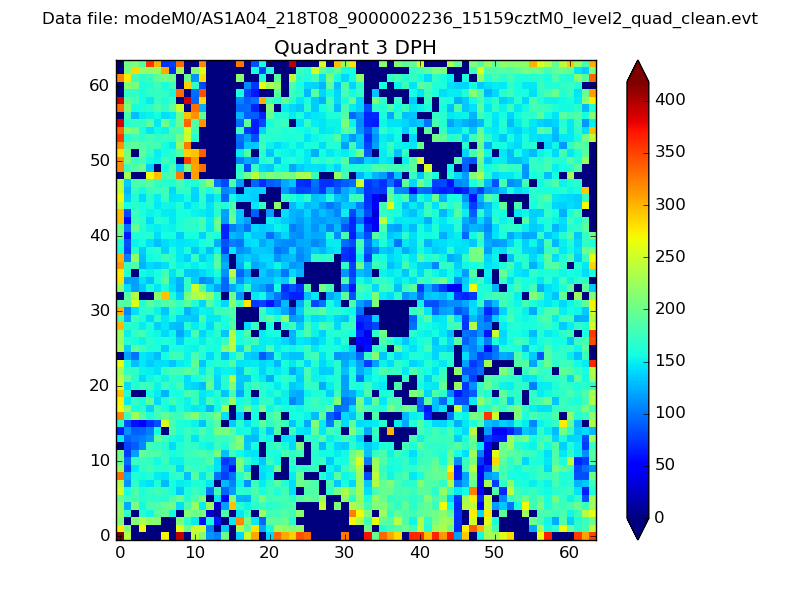 |
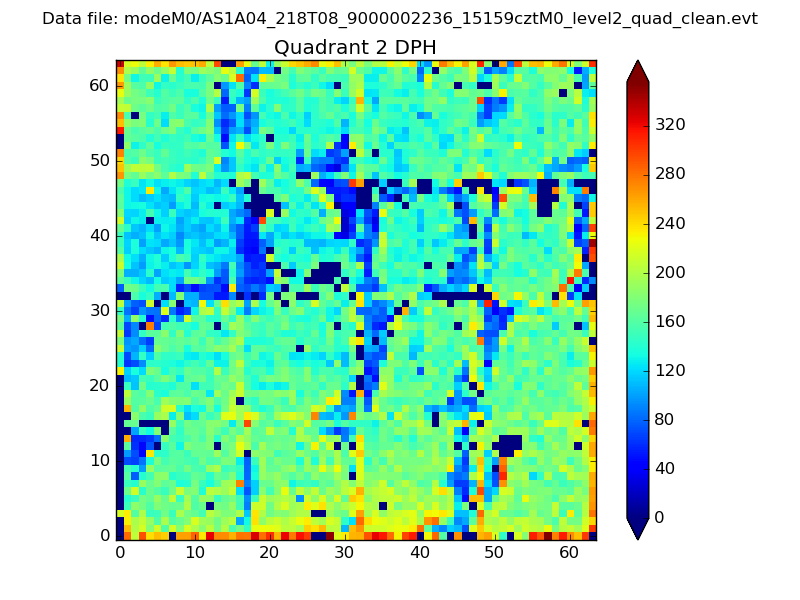 |
Quadrant C |
| Plot type | Count rate plots | Images |
|---|---|---|
| Comparison with Poisson distribution Blue bars denote a histogram of data divided into 1 sec bins. Red curve is a Poisson curve with rate = median count rate of data. |
 |
 |
| Quadrant-wise count rates Data is divided into 100 sec bins |
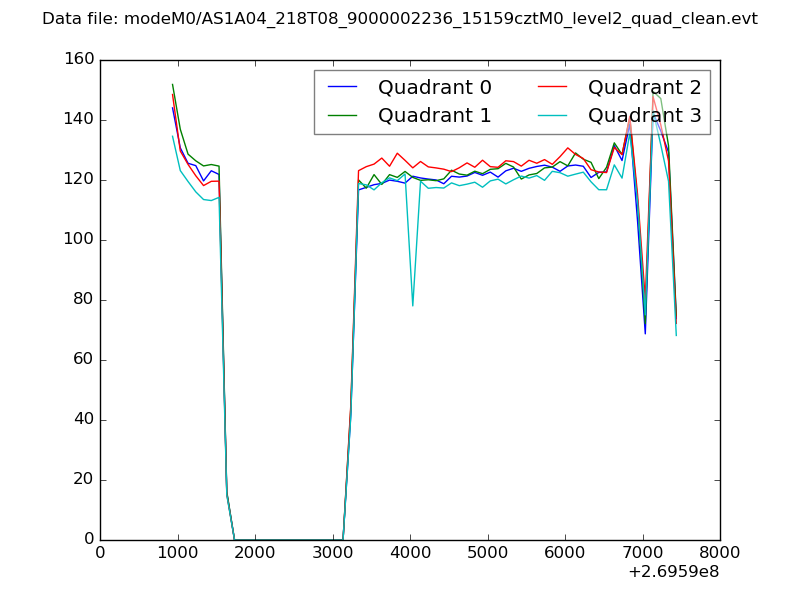 |
|
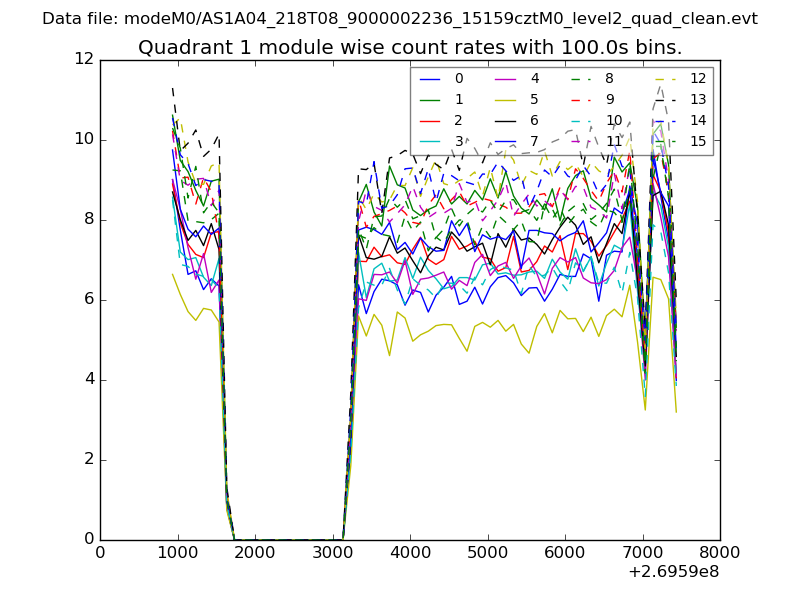
| Module-wise count rates for Quadrant A Data is divided into 100 sec bins |
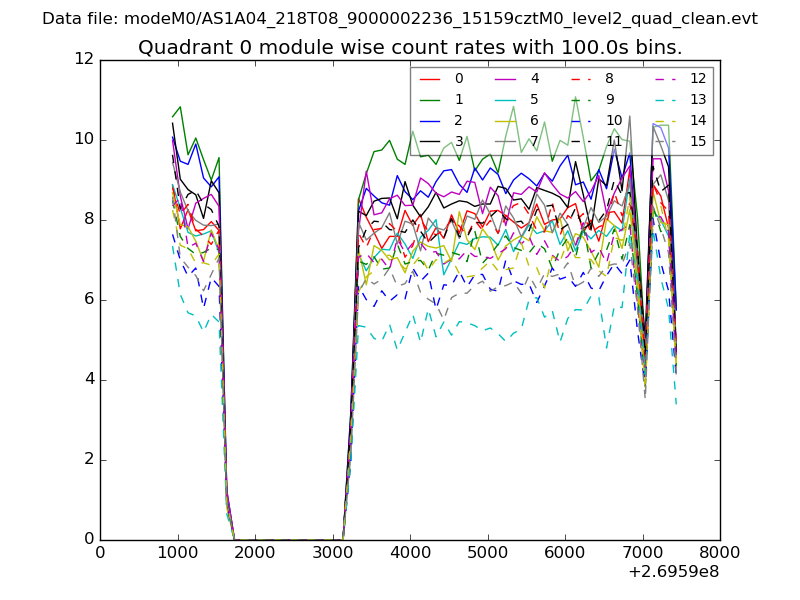 |
 |
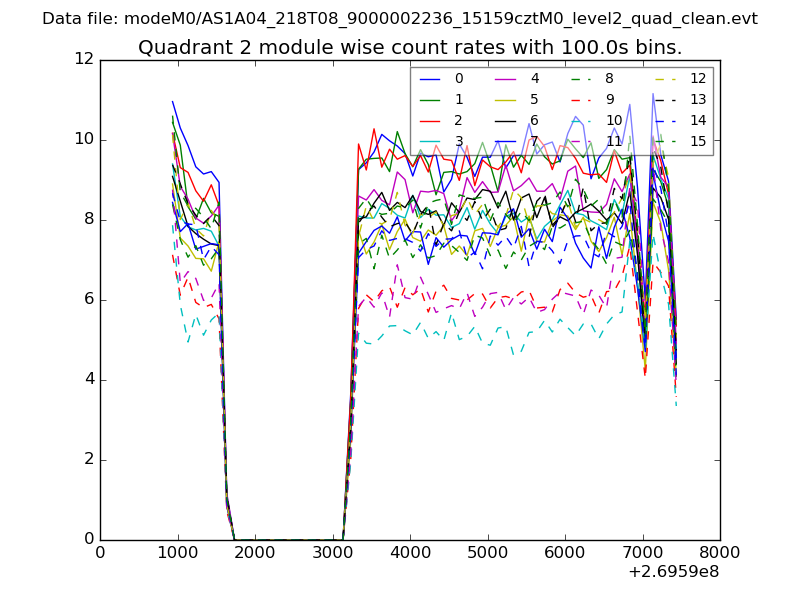
| Module-wise count rates for Quadrant B Data is divided into 100 sec bins |
 |
 |
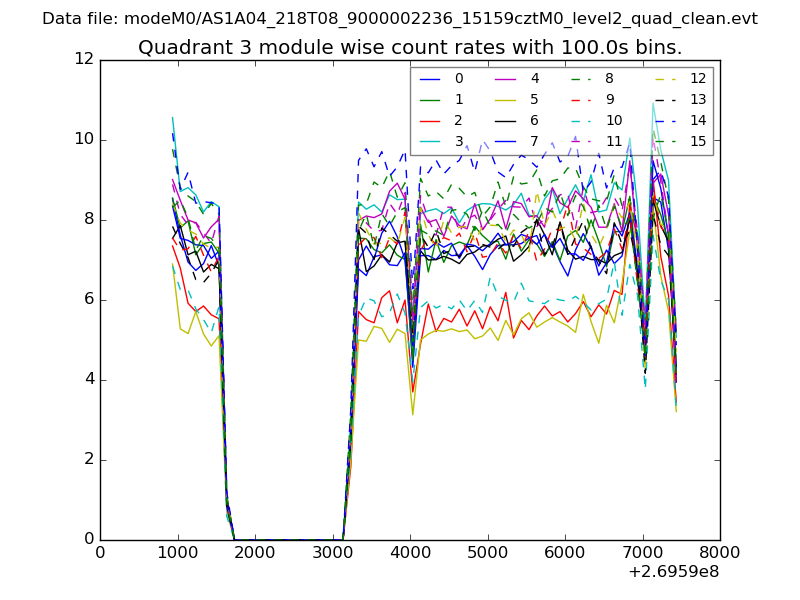
| Module-wise count rates for Quadrant C Data is divided into 100 sec bins |
 |
 |
| Module-wise count rates for Quadrant D Data is divided into 100 sec bins |
 |
 |
| Parameter | Plot |
|---|---|
| CZT HV Monitor | 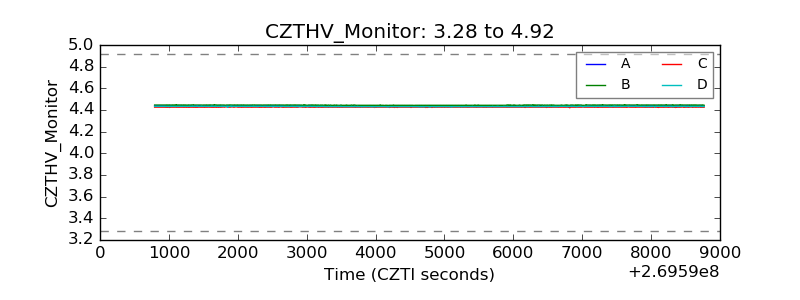 |
| D_VDD | 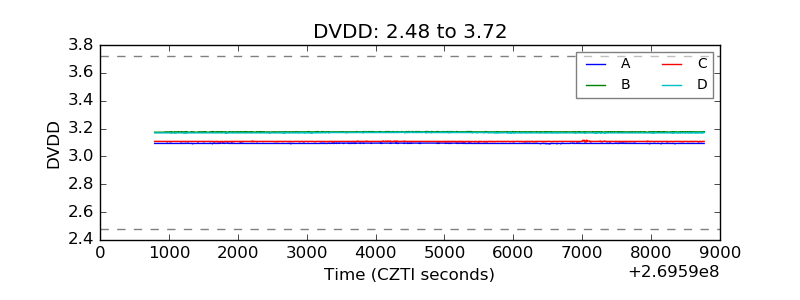 |
| Temperature 1 | 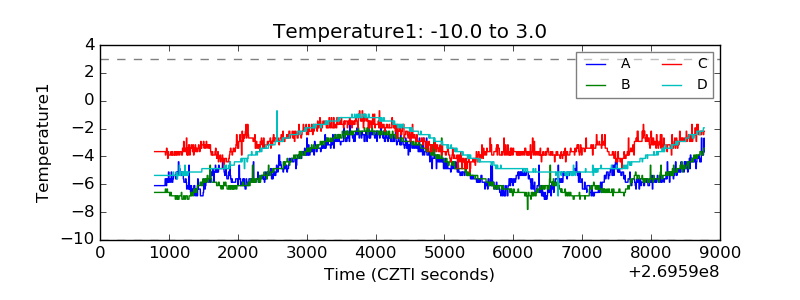 |
| Veto HV Monitor | 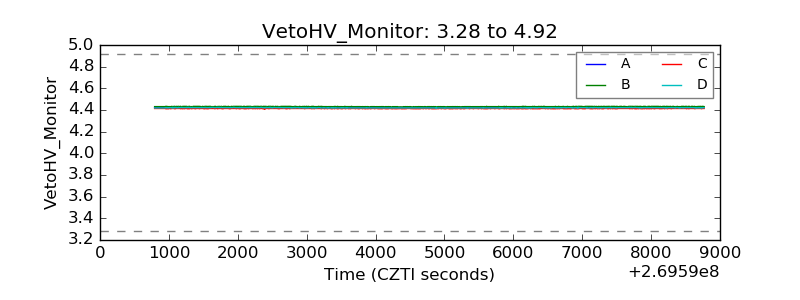 |
| Veto LLD | 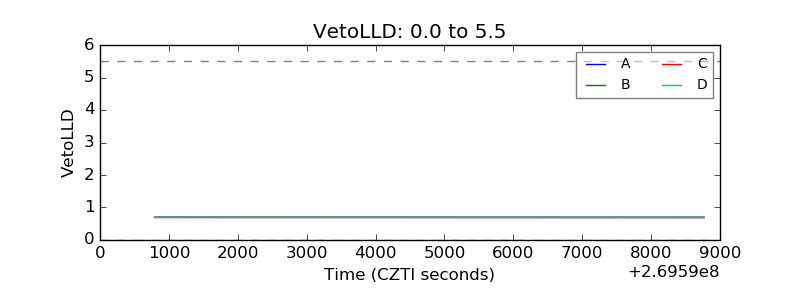 |
| Alpha Counter | 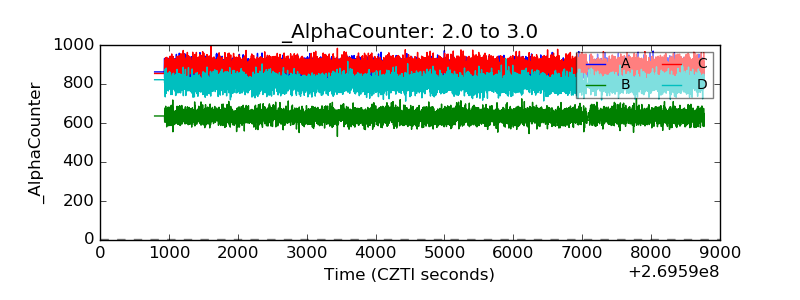 |
| _CPM_Rate | 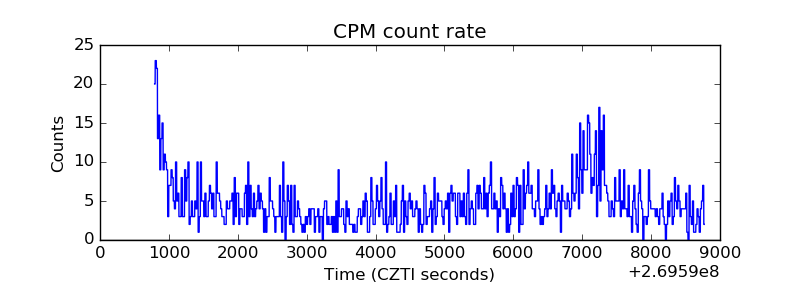 |
| CZT Counter | 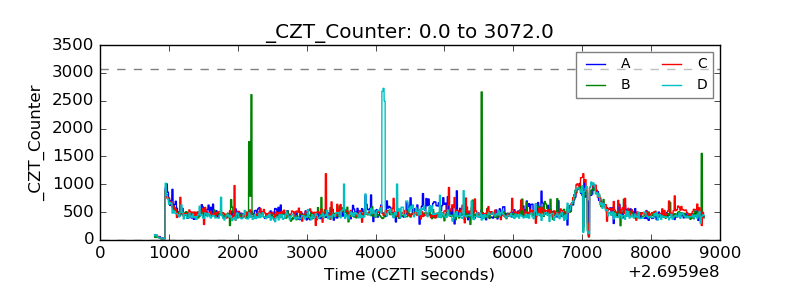 |
| +2.5 Volts monitor |  |
| +5 Volts monitor |  |
| _ROLL_ROT | 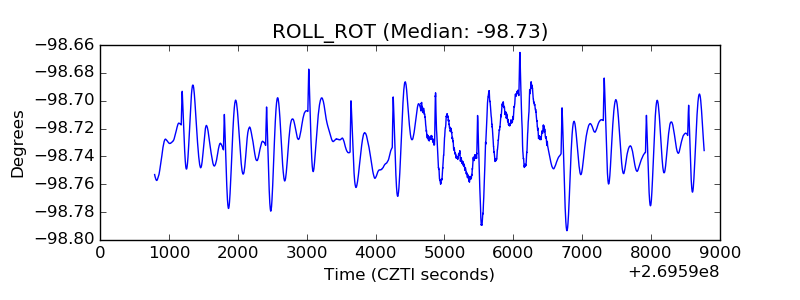 |
| _Roll_DEC | 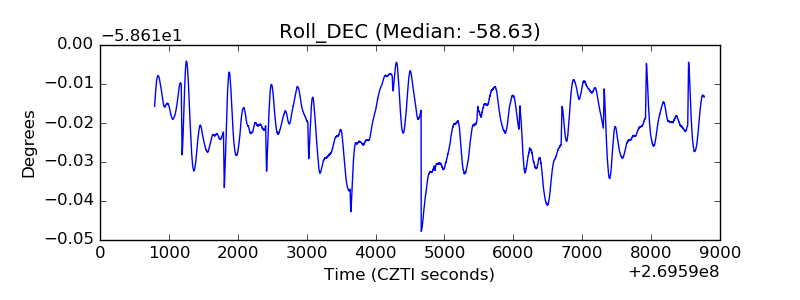 |
| _Roll_RA | 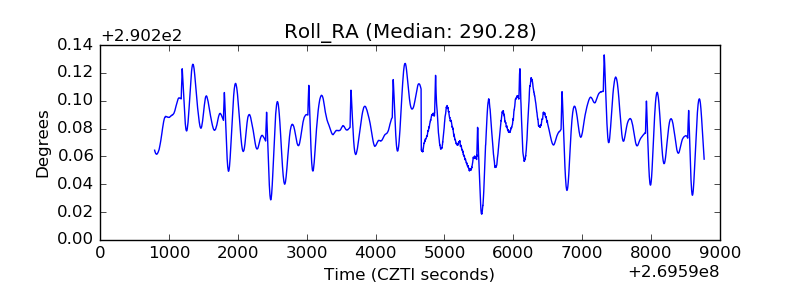 |
| Veto Counter | 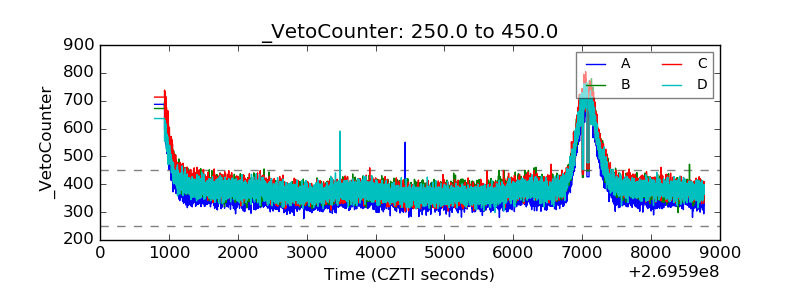 |