| Param | Original file | Final file |
|---|---|---|
| Filename | modeM0/AS1A04_218T08_9000002236_15160cztM0_level2.evt | modeM0/AS1A04_218T08_9000002236_15160cztM0_level2_quad_clean.evt |
| Size (bytes) | 539,225,280 | 92,678,400 |
| Size | 514.2 MB | 88.4 MB |
| Events in quadrant A | 3,954,817 | 563,591 |
| Events in quadrant B | 3,802,394 | 571,495 |
| Events in quadrant C | 4,291,572 | 574,606 |
| Events in quadrant D | 3,753,289 | 555,424 |
| Mode SS | |||
|---|---|---|---|
| Quadrant | BADHDUFLAG | Total packets | Discarded packets |
| A | 0 | 156 | 0 |
| B | 0 | 156 | 0 |
| C | 0 | 156 | 0 |
| D | 0 | 156 | 0 |
| Mode M9 | |||
|---|---|---|---|
| Quadrant | BADHDUFLAG | Total packets | Discarded packets |
| A | 0 | 3 | 0 |
| B | 0 | 3 | 0 |
| C | 0 | 3 | 0 |
| D | 0 | 3 | 0 |
| Mode M0 | |||
|---|---|---|---|
| Quadrant | BADHDUFLAG | Total packets | Discarded packets |
| A | 0 | 16579 | 3 |
| B | 0 | 16378 | 2 |
| C | 0 | 17460 | 2 |
| D | 0 | 16732 | 2 |
| Quadrant | Total seconds | Saturated seconds | Saturation percentage |
|---|---|---|---|
| A | 7786 | 252 | 3.236578% |
| B | 7786 | 264 | 3.390701% |
| C | 7786 | 221 | 2.838428% |
| D | 7786 | 213 | 2.735679% |
Noise dominated data is calculated using 1-second bins in cleaned event files. If a bin has >2000 counts, and if more than 50% of those come from <1% of pixels, then it is considered to be noise-dominated and hence unusable.
| Quadrant | # 1 sec bins | Bins with >0 counts | Bins with >2000 counts | High rate bins dominated by noise | Noise dominated (total time) | Noise dominated (detector-on time) | Marked lightcurve |
|---|---|---|---|---|---|---|---|
| A | 8012 | 7787 | 1 | 1 | 0.01% | 0.01% | 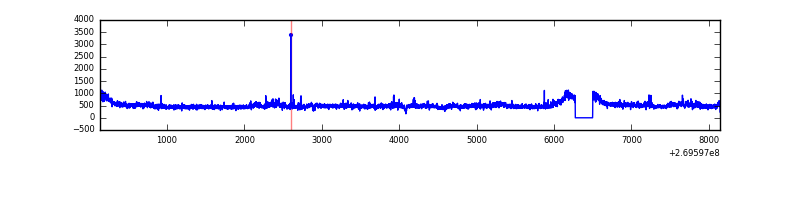 |
| B | 8012 | 7787 | 10 | 10 | 0.12% | 0.13% | 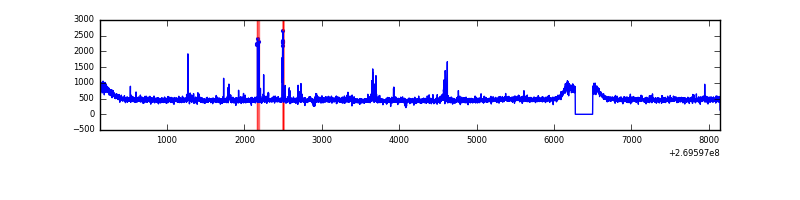 |
| C | 8012 | 7787 | 22 | 22 | 0.27% | 0.28% | 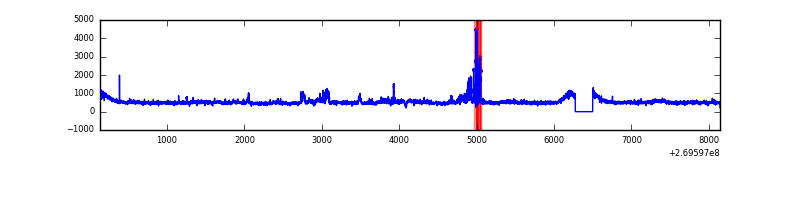 |
| D | 8012 | 7787 | 16 | 16 | 0.20% | 0.21% | 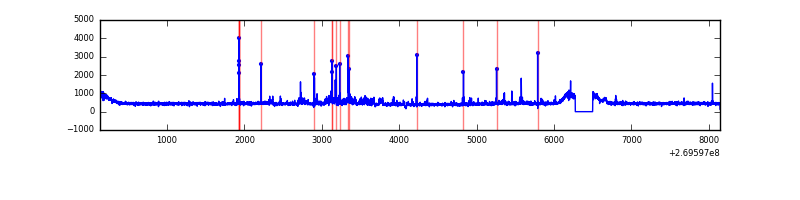 |
Top three noisy pixels from each quadrant. If the there are fewer than three noisy pixels in the level2.evt file, extra rows are filled as -1
| Pixel properties | Quadrant properties | ||||||
|---|---|---|---|---|---|---|---|
| Quadrant | DetID | PixID | Counts | Sigma | Mean | Median | Sigma |
| A | 15 | 239 | 347188 | 1818.64 | 932 | 911 | 190.4 |
| A | 13 | 248 | 11510 | 55.67 | 932 | 911 | 190.4 |
| A | 12 | 189 | 9291 | 44.01 | 932 | 911 | 190.4 |
| B | 3 | 64 | 76406 | 420.03 | 933 | 907 | 179.7 |
| B | 0 | 229 | 24277 | 130.02 | 933 | 907 | 179.7 |
| B | 12 | 111 | 21918 | 116.89 | 933 | 907 | 179.7 |
| C | 3 | 233 | 580195 | 2722.12 | 922 | 927 | 212.8 |
| C | 14 | 234 | 91375 | 425.04 | 922 | 927 | 212.8 |
| C | 3 | 9 | 17214 | 76.54 | 922 | 927 | 212.8 |
| D | 2 | 16 | 133363 | 591.31 | 923 | 892 | 224.0 |
| D | 2 | 33 | 50682 | 222.25 | 923 | 892 | 224.0 |
| D | 7 | 38 | 42041 | 183.68 | 923 | 892 | 224.0 |
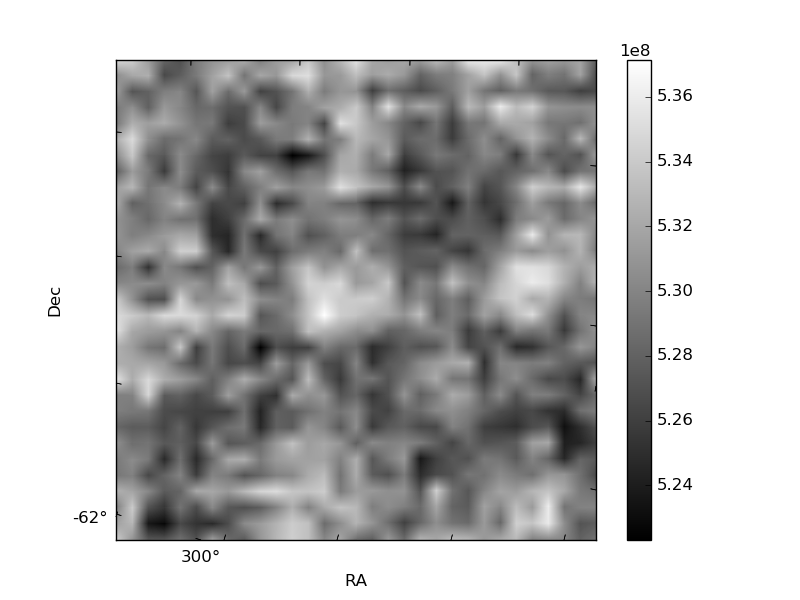
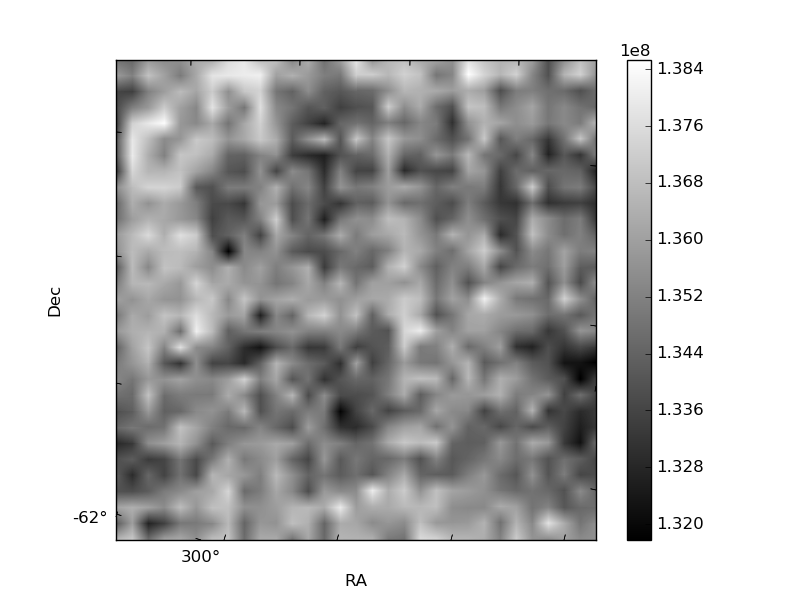
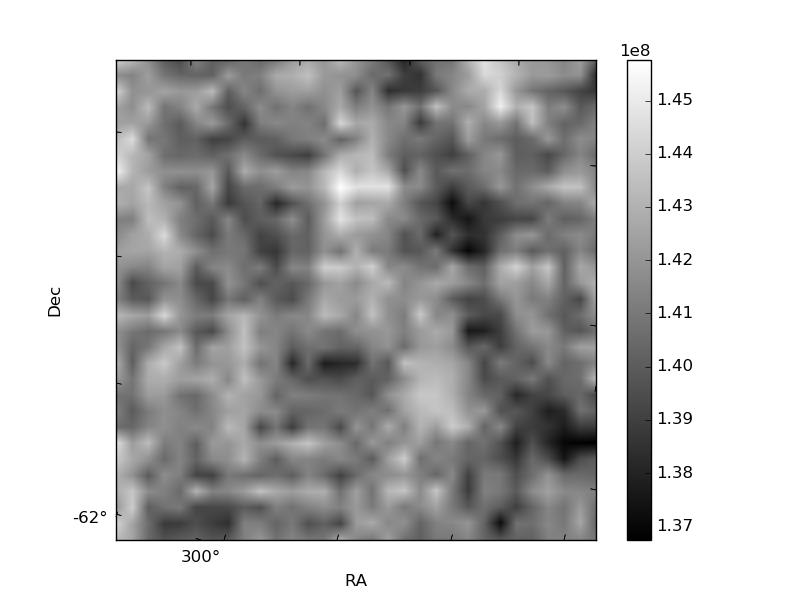
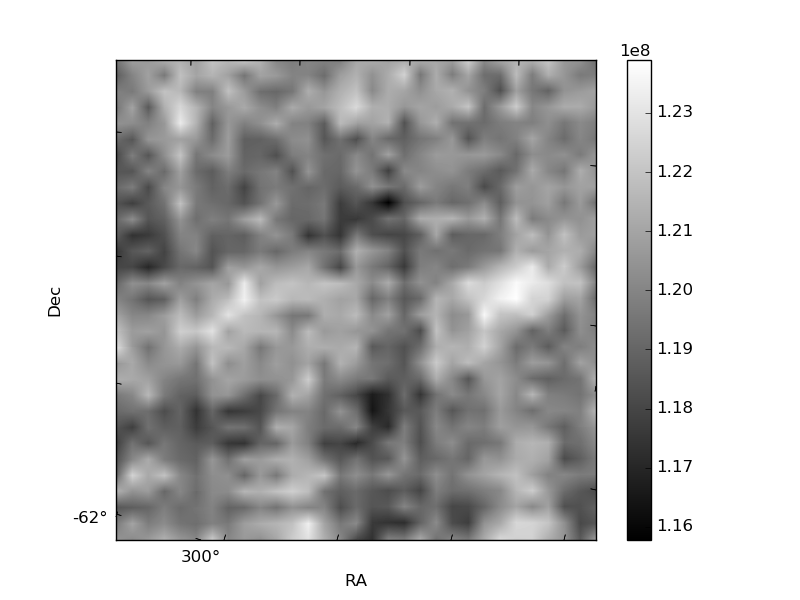
Histogram calculated using DETX and DETY for each event in the final _common_clean file
| Quadrant A | 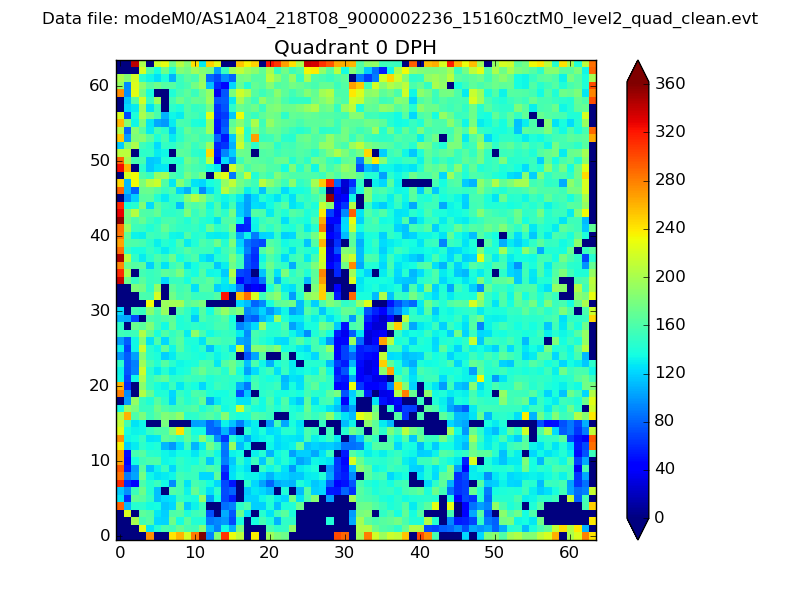 |
 |
Quadrant B |
|---|---|---|---|
| Quadrant D | 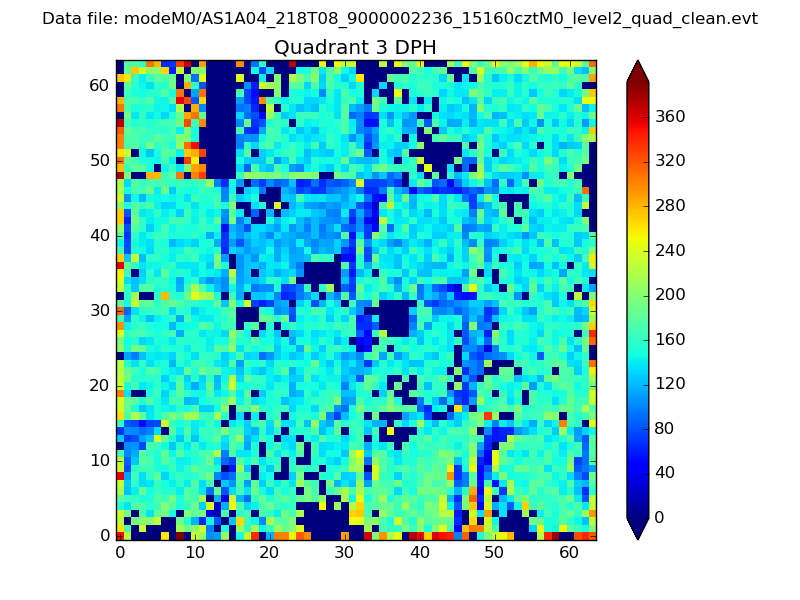 |
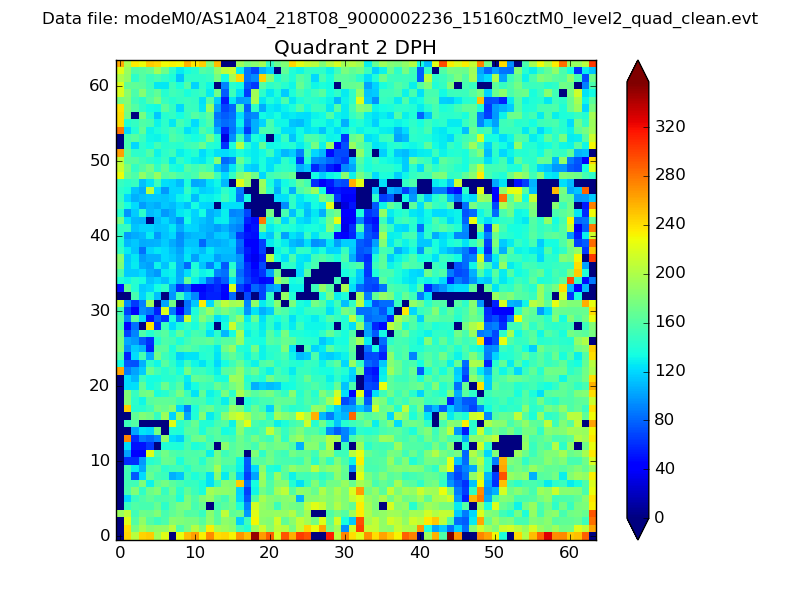 |
Quadrant C |
| Plot type | Count rate plots | Images |
|---|---|---|
| Comparison with Poisson distribution Blue bars denote a histogram of data divided into 1 sec bins. Red curve is a Poisson curve with rate = median count rate of data. |
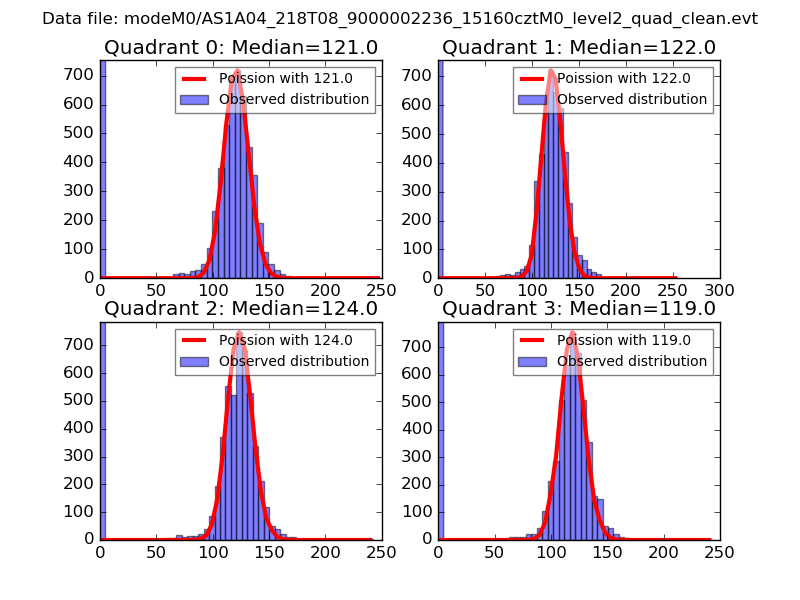 |
 |
| Quadrant-wise count rates Data is divided into 100 sec bins |
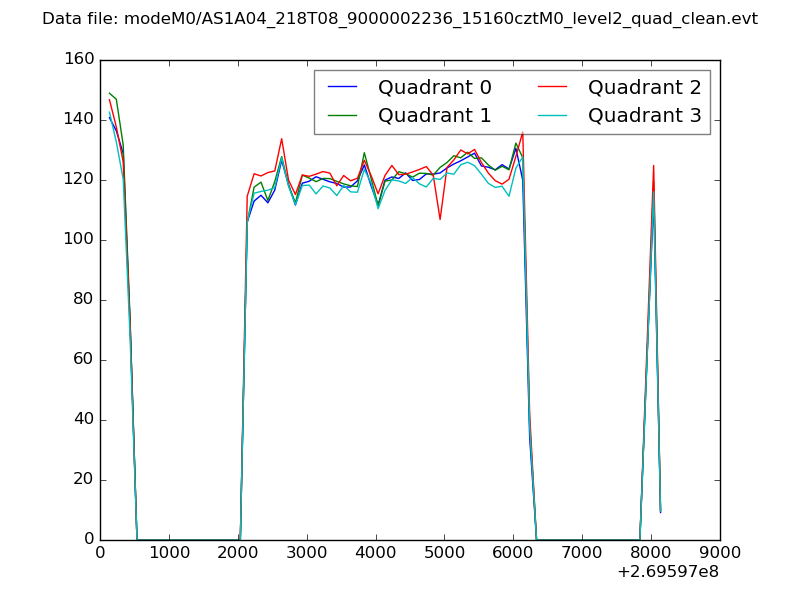 |
|
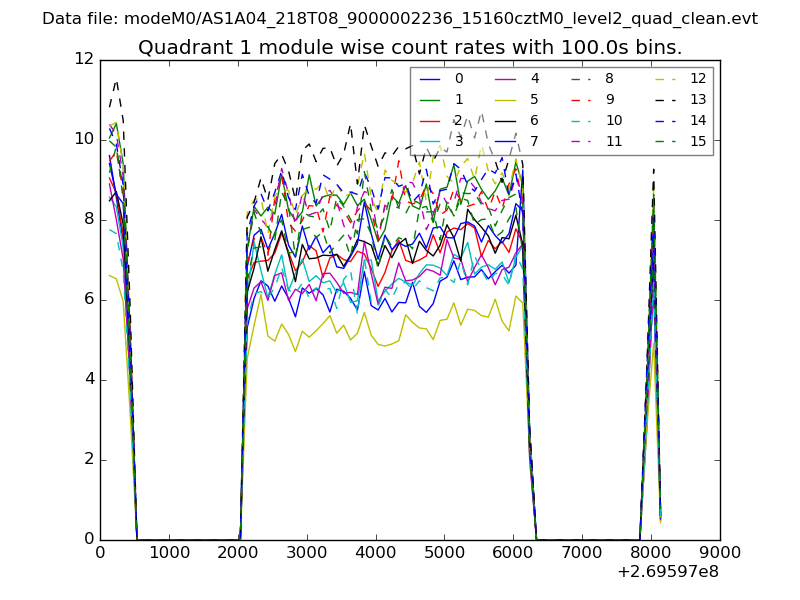
| Module-wise count rates for Quadrant A Data is divided into 100 sec bins |
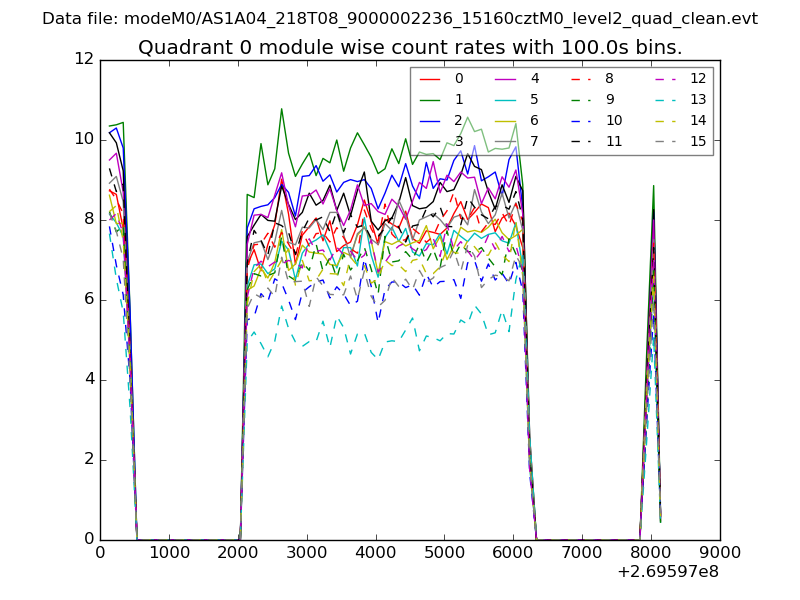 |
 |
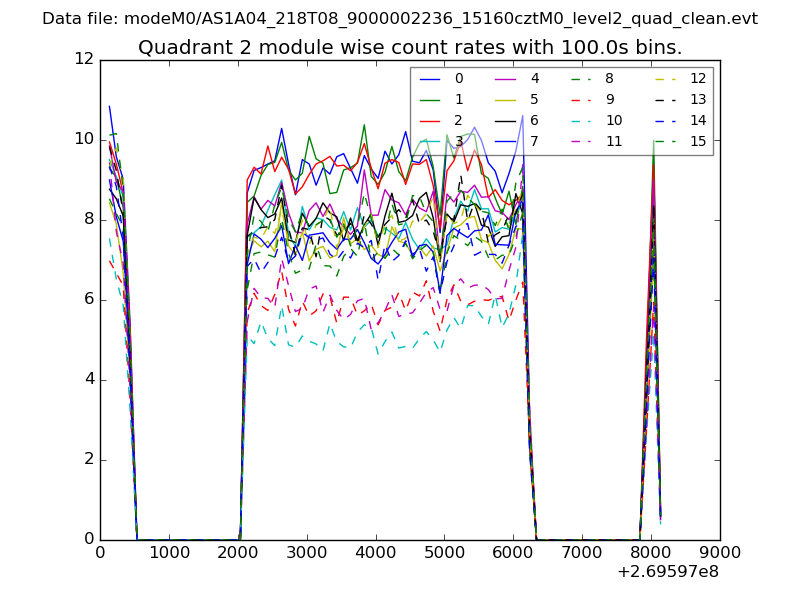
| Module-wise count rates for Quadrant B Data is divided into 100 sec bins |
 |
 |
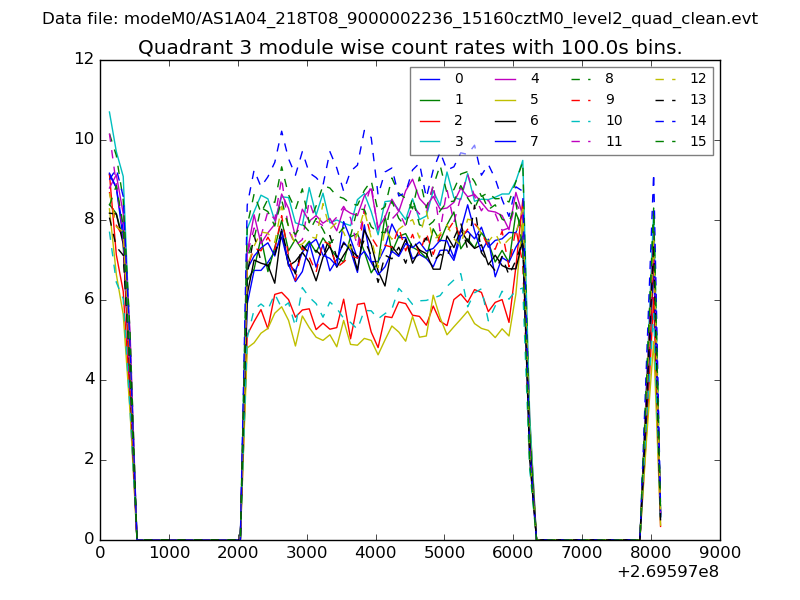
| Module-wise count rates for Quadrant C Data is divided into 100 sec bins |
 |
 |
| Module-wise count rates for Quadrant D Data is divided into 100 sec bins |
 |
 |
| Parameter | Plot |
|---|---|
| CZT HV Monitor | 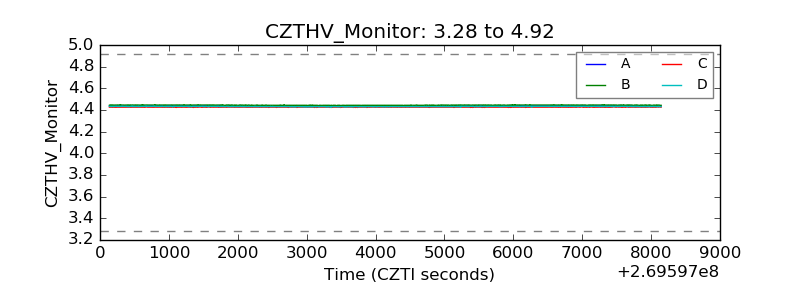 |
| D_VDD | 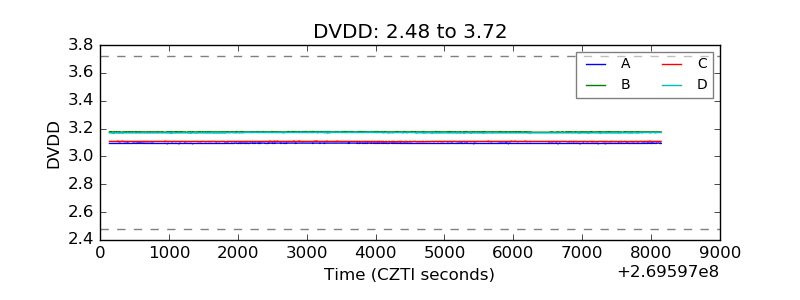 |
| Temperature 1 | 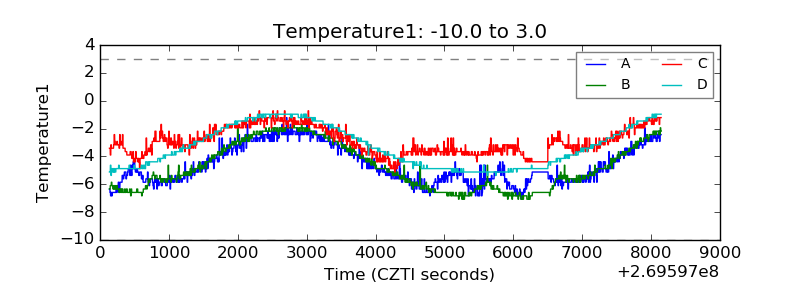 |
| Veto HV Monitor |  |
| Veto LLD | 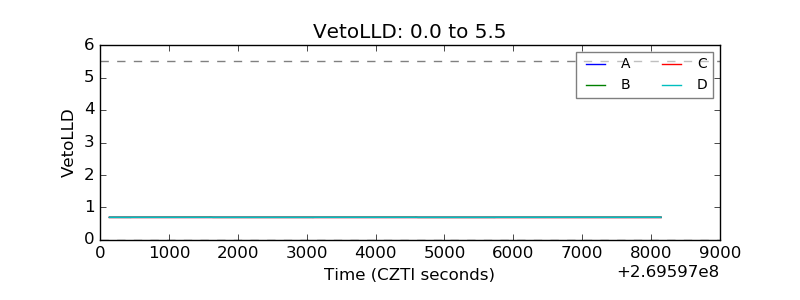 |
| Alpha Counter | 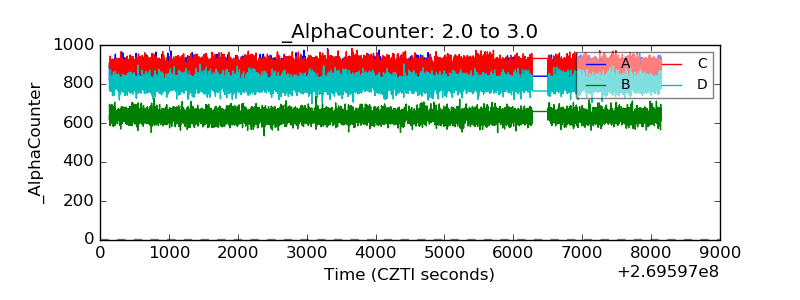 |
| _CPM_Rate | 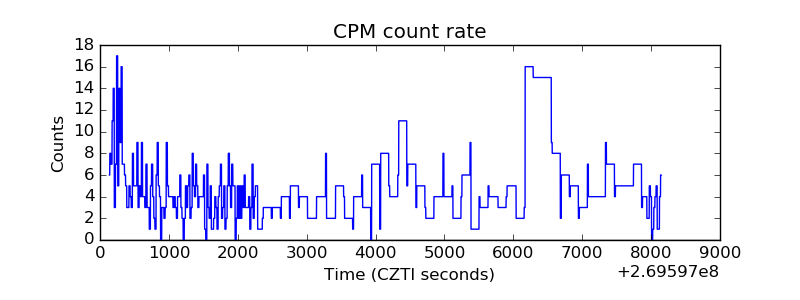 |
| CZT Counter | 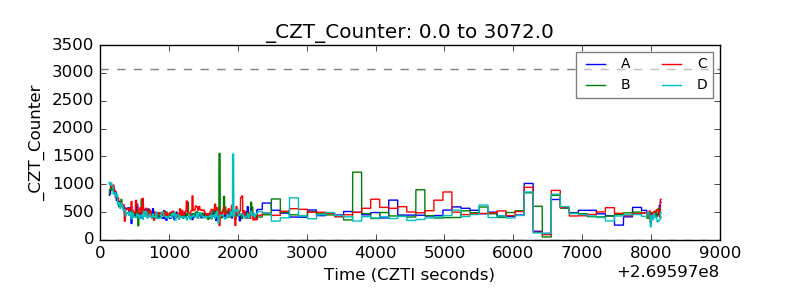 |
| +2.5 Volts monitor |  |
| +5 Volts monitor |  |
| _ROLL_ROT | 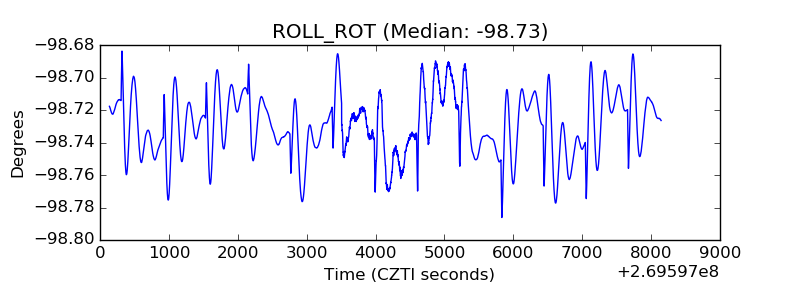 |
| _Roll_DEC | 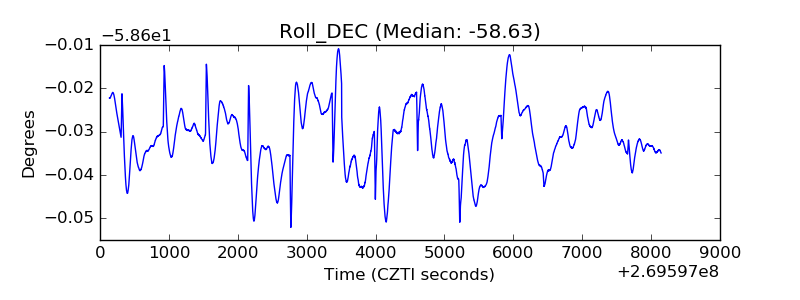 |
| _Roll_RA | 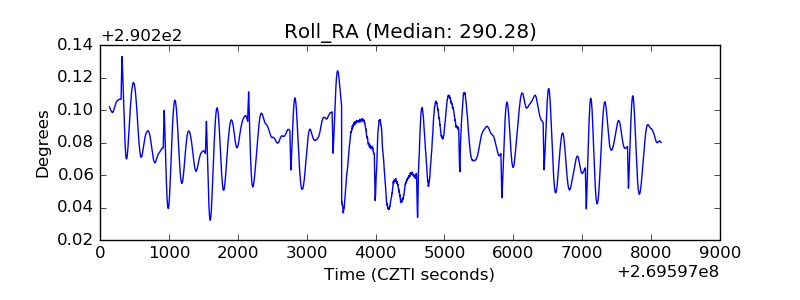 |
| Veto Counter |  |