| Param | Original file | Final file |
|---|---|---|
| Filename | modeM0/AS1A04_218T08_9000002236_15165cztM0_level2.evt | modeM0/AS1A04_218T08_9000002236_15165cztM0_level2_quad_clean.evt |
| Size (bytes) | 633,274,560 | 136,506,240 |
| Size | 603.9 MB | 130.2 MB |
| Events in quadrant A | 4,840,429 | 880,495 |
| Events in quadrant B | 4,424,320 | 898,355 |
| Events in quadrant C | 4,727,832 | 878,666 |
| Events in quadrant D | 4,563,966 | 840,153 |
| Mode SS | |||
|---|---|---|---|
| Quadrant | BADHDUFLAG | Total packets | Discarded packets |
| A | 0 | 188 | 0 |
| B | 0 | 188 | 0 |
| C | 0 | 188 | 0 |
| D | 0 | 188 | 0 |
| Mode M9 | |||
|---|---|---|---|
| Quadrant | BADHDUFLAG | Total packets | Discarded packets |
| A | 0 | 22 | 0 |
| B | 0 | 22 | 0 |
| C | 0 | 22 | 0 |
| D | 0 | 22 | 0 |
| Mode M0 | |||
|---|---|---|---|
| Quadrant | BADHDUFLAG | Total packets | Discarded packets |
| A | 0 | 20728 | 3 |
| B | 0 | 19245 | 2 |
| C | 0 | 20199 | 2 |
| D | 0 | 20101 | 2 |
| Quadrant | Total seconds | Saturated seconds | Saturation percentage |
|---|---|---|---|
| A | 9177 | 63 | 0.686499% |
| B | 9177 | 59 | 0.642912% |
| C | 9177 | 53 | 0.577531% |
| D | 9177 | 60 | 0.653808% |
Noise dominated data is calculated using 1-second bins in cleaned event files. If a bin has >2000 counts, and if more than 50% of those come from <1% of pixels, then it is considered to be noise-dominated and hence unusable.
| Quadrant | # 1 sec bins | Bins with >0 counts | Bins with >2000 counts | High rate bins dominated by noise | Noise dominated (total time) | Noise dominated (detector-on time) | Marked lightcurve |
|---|---|---|---|---|---|---|---|
| A | 11393 | 9180 | 0 | 0 | 0.00% | 0.00% | 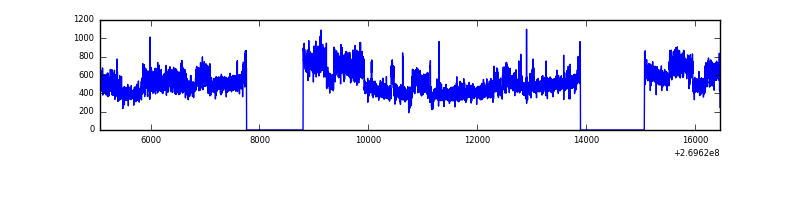 |
| B | 11393 | 9179 | 2 | 2 | 0.02% | 0.02% | 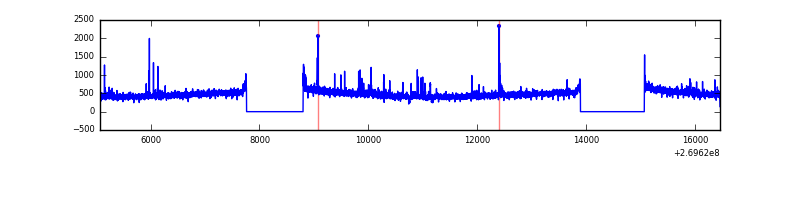 |
| C | 11393 | 9180 | 15 | 15 | 0.13% | 0.16% | 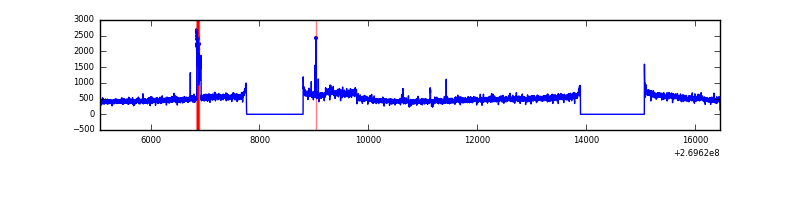 |
| D | 11393 | 9180 | 31 | 31 | 0.27% | 0.34% | 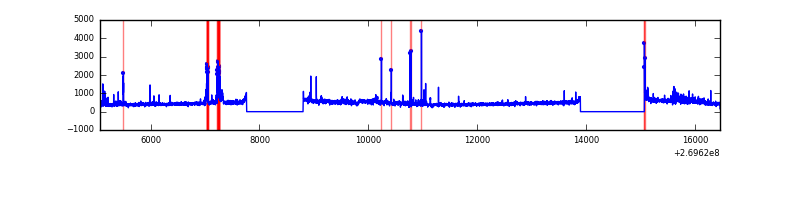 |
Top three noisy pixels from each quadrant. If the there are fewer than three noisy pixels in the level2.evt file, extra rows are filled as -1
| Pixel properties | Quadrant properties | ||||||
|---|---|---|---|---|---|---|---|
| Quadrant | DetID | PixID | Counts | Sigma | Mean | Median | Sigma |
| A | 15 | 239 | 617183 | 2803.71 | 1091 | 1070 | 219.7 |
| A | 12 | 189 | 24635 | 107.24 | 1091 | 1070 | 219.7 |
| A | 0 | 226 | 9755 | 39.52 | 1091 | 1070 | 219.7 |
| B | 3 | 64 | 43135 | 205.45 | 1100 | 1072 | 204.7 |
| B | 12 | 111 | 23957 | 111.78 | 1100 | 1072 | 204.7 |
| B | 4 | 48 | 20802 | 96.37 | 1100 | 1072 | 204.7 |
| C | 3 | 233 | 436922 | 1780.29 | 1065 | 1070 | 244.8 |
| C | 3 | 9 | 103171 | 417.04 | 1065 | 1070 | 244.8 |
| C | 9 | 236 | 24983 | 97.67 | 1065 | 1070 | 244.8 |
| D | 2 | 16 | 310666 | 1215.34 | 1055 | 1025 | 254.8 |
| D | 2 | 120 | 158548 | 618.28 | 1055 | 1025 | 254.8 |
| D | 2 | 234 | 37189 | 141.94 | 1055 | 1025 | 254.8 |
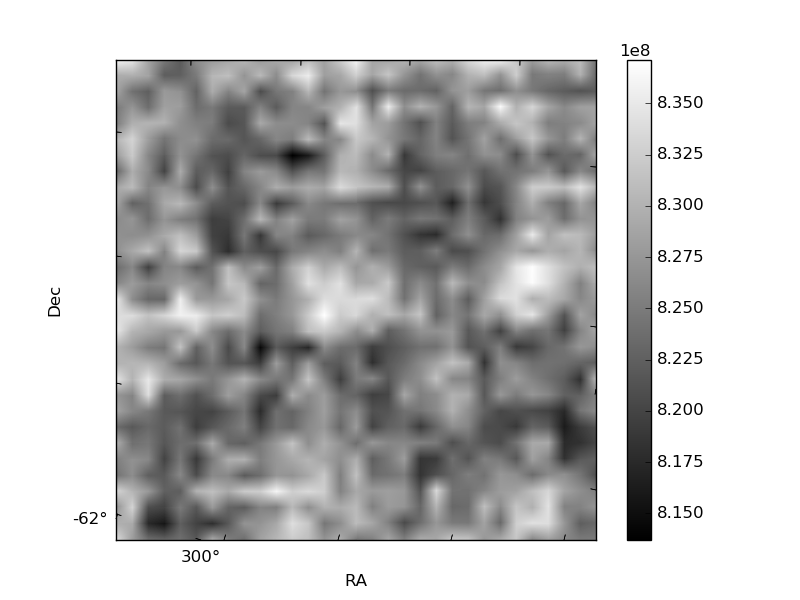
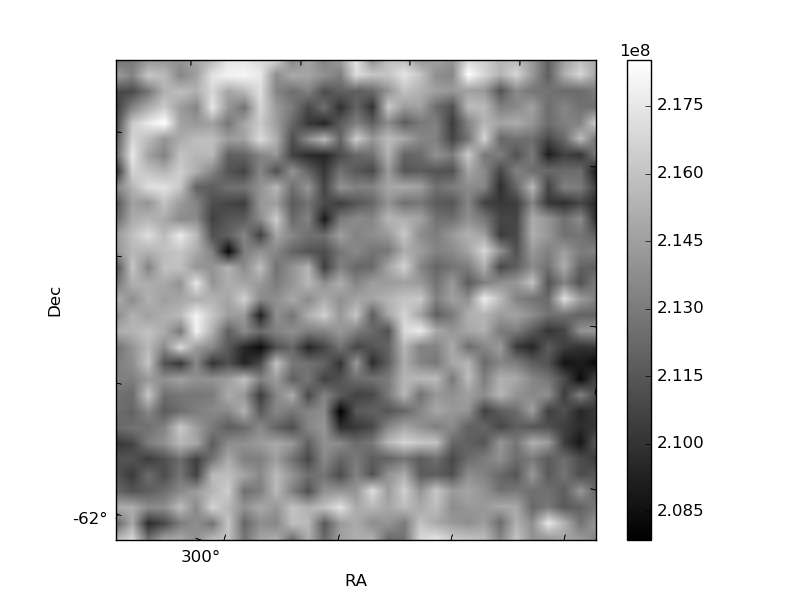
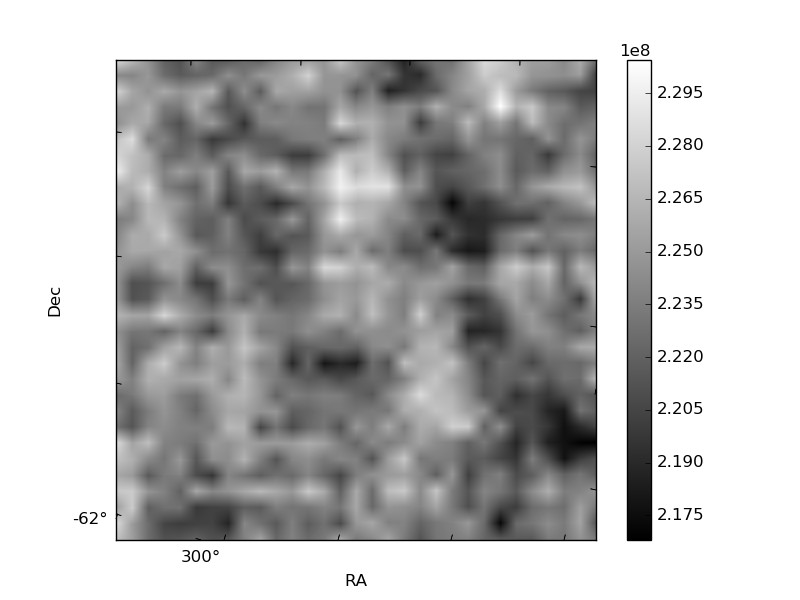
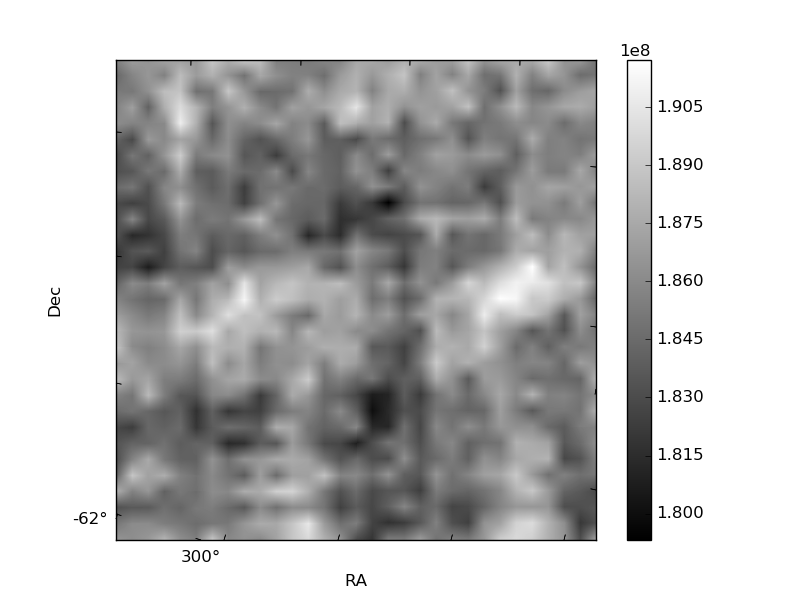
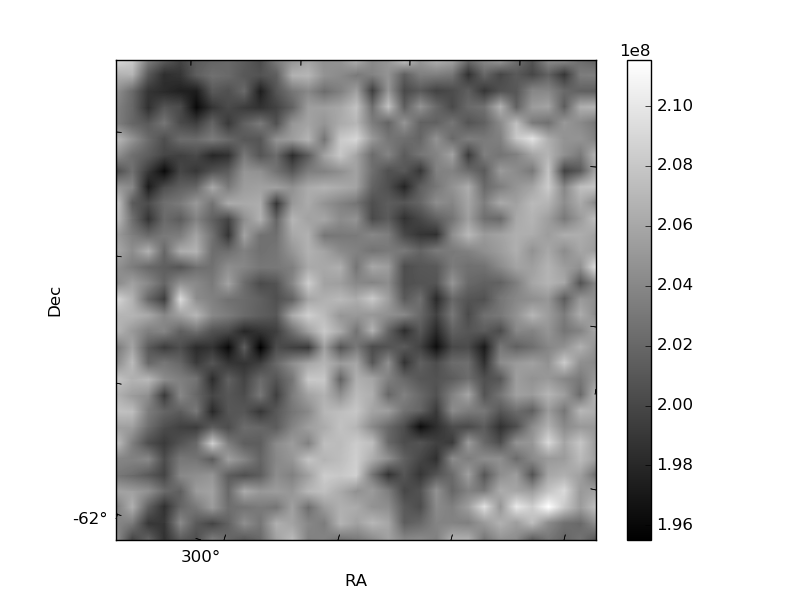
Histogram calculated using DETX and DETY for each event in the final _common_clean file
| Quadrant A | 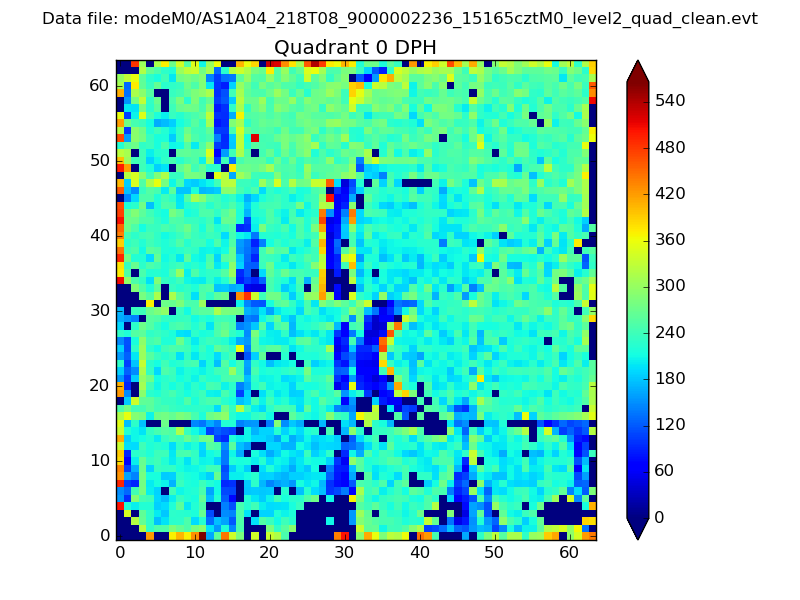 |
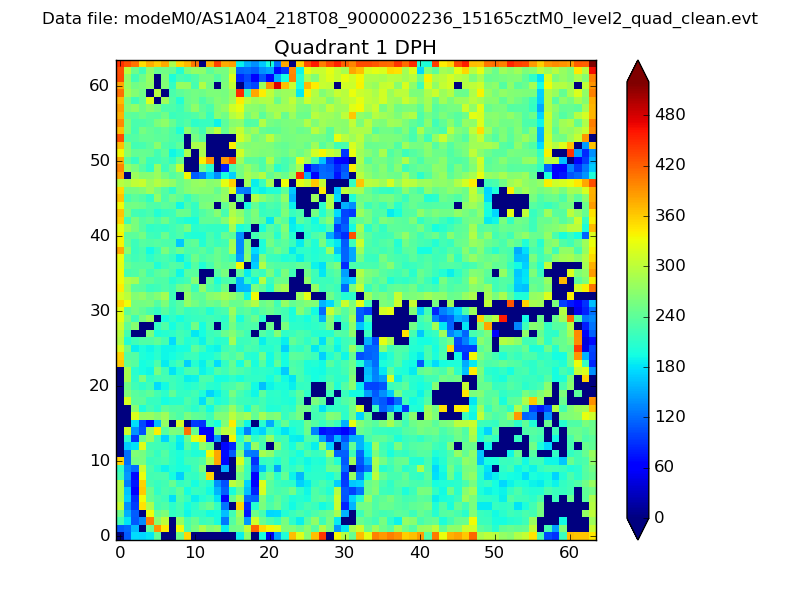 |
Quadrant B |
|---|---|---|---|
| Quadrant D |  |
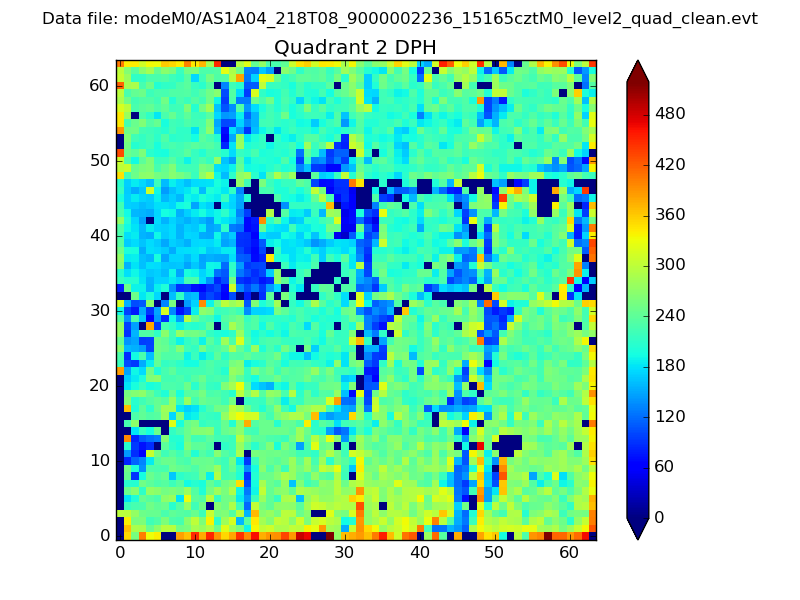 |
Quadrant C |
| Plot type | Count rate plots | Images |
|---|---|---|
| Comparison with Poisson distribution Blue bars denote a histogram of data divided into 1 sec bins. Red curve is a Poisson curve with rate = median count rate of data. |
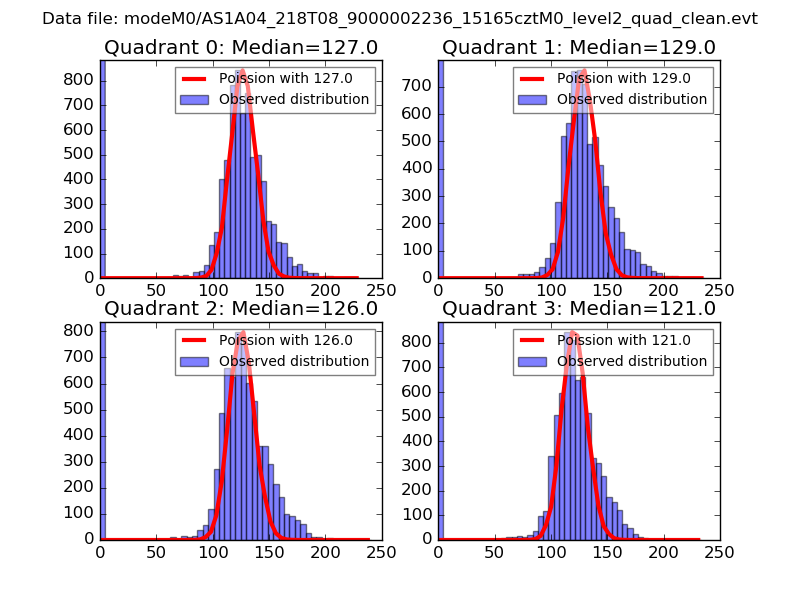 |
 |
| Quadrant-wise count rates Data is divided into 100 sec bins |
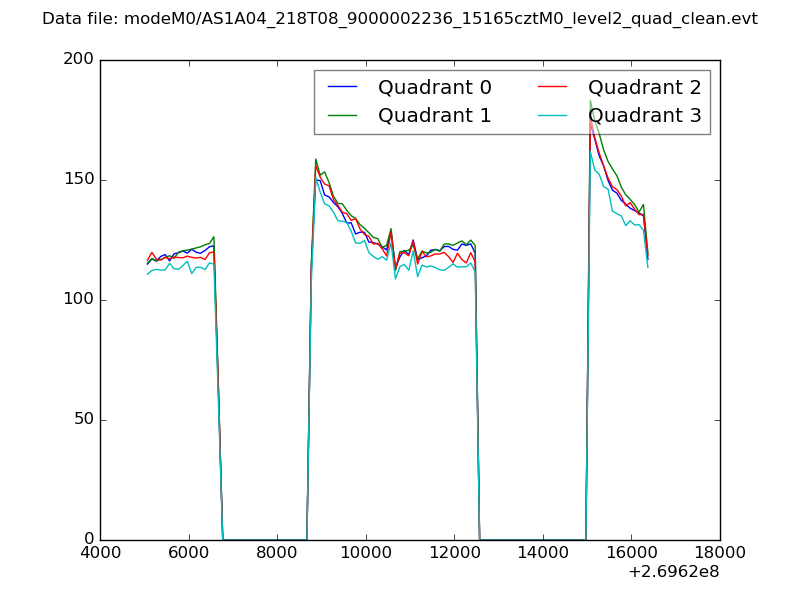 |
|
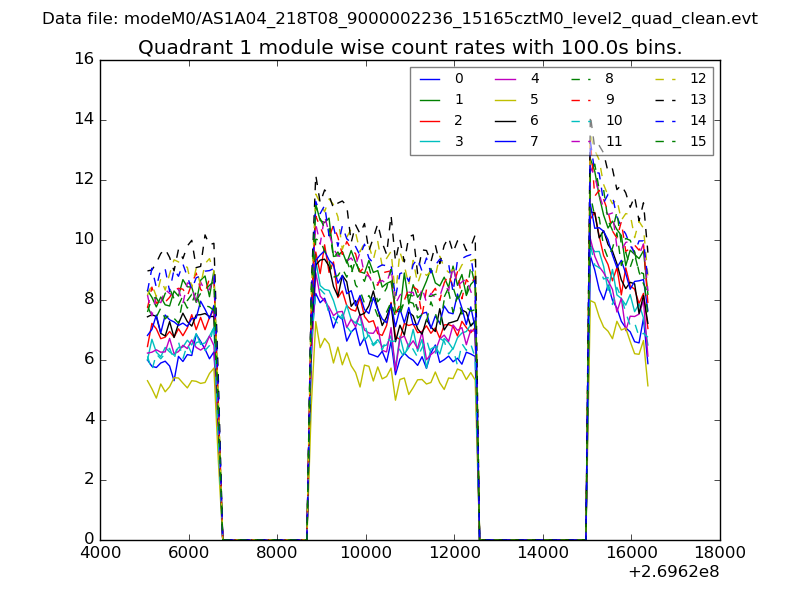
| Module-wise count rates for Quadrant A Data is divided into 100 sec bins |
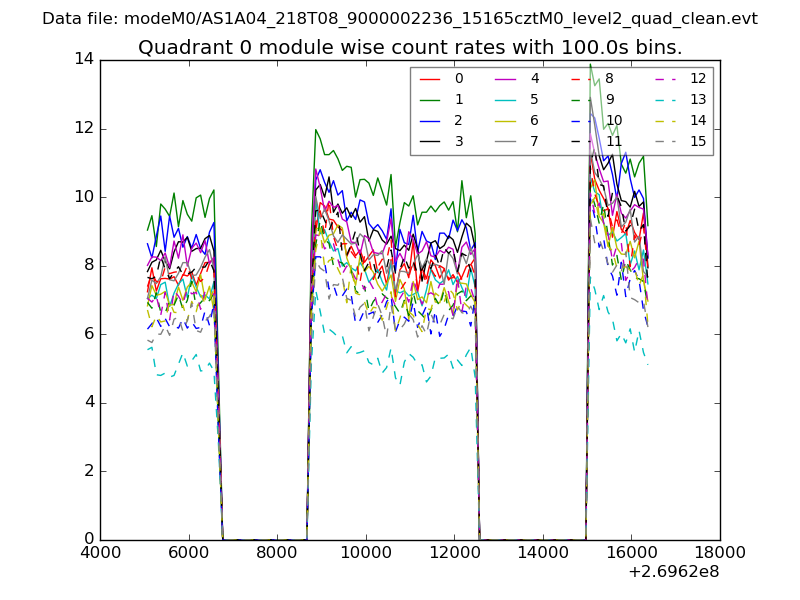 |
 |
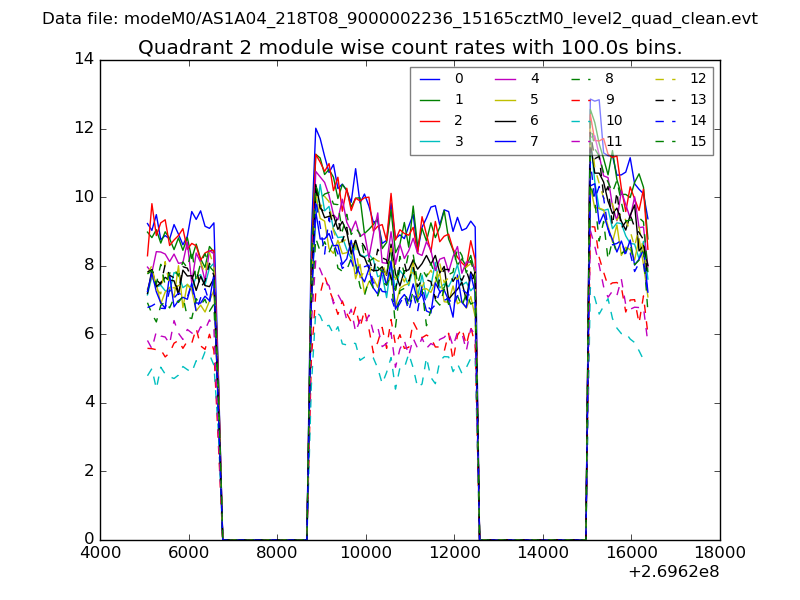
| Module-wise count rates for Quadrant B Data is divided into 100 sec bins |
 |
 |
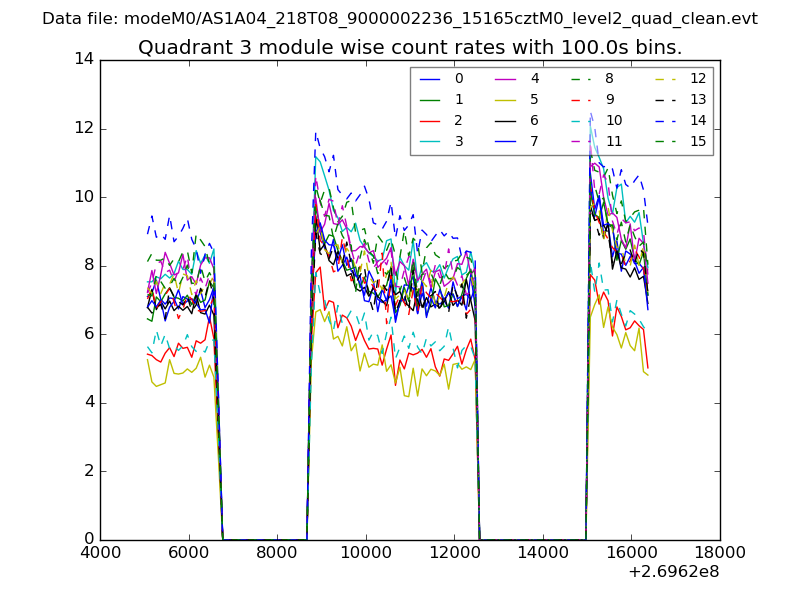
| Module-wise count rates for Quadrant C Data is divided into 100 sec bins |
 |
 |
| Module-wise count rates for Quadrant D Data is divided into 100 sec bins |
 |
 |
| Parameter | Plot |
|---|---|
| CZT HV Monitor | 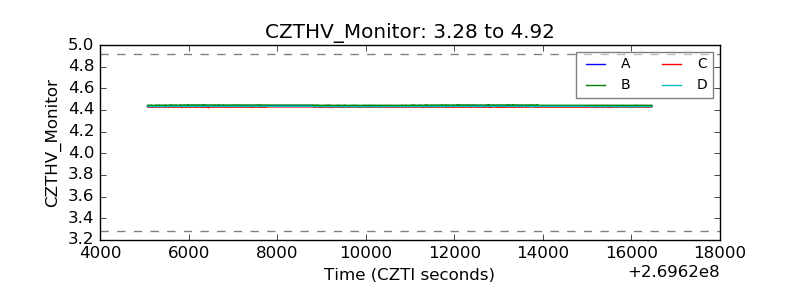 |
| D_VDD | 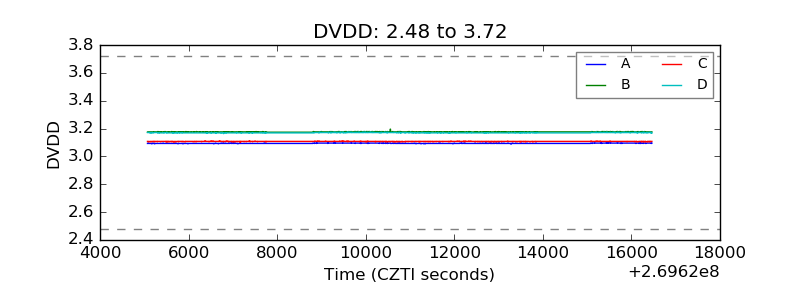 |
| Temperature 1 | 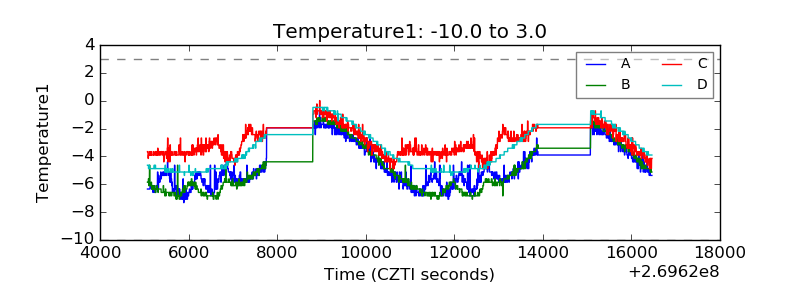 |
| Veto HV Monitor | 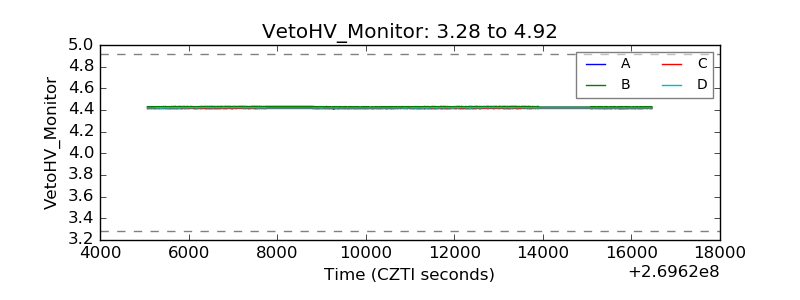 |
| Veto LLD | 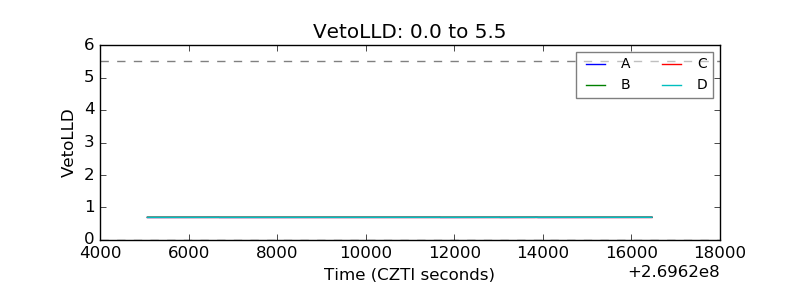 |
| Alpha Counter | 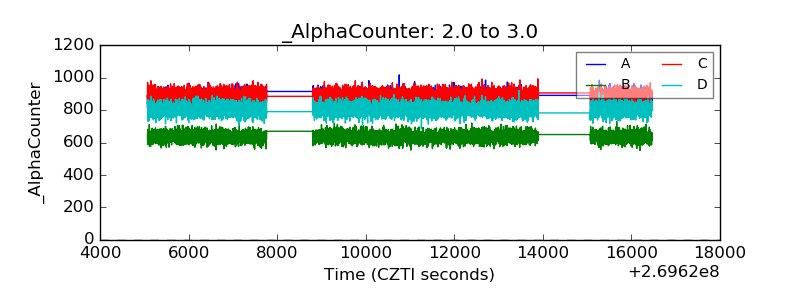 |
| _CPM_Rate | 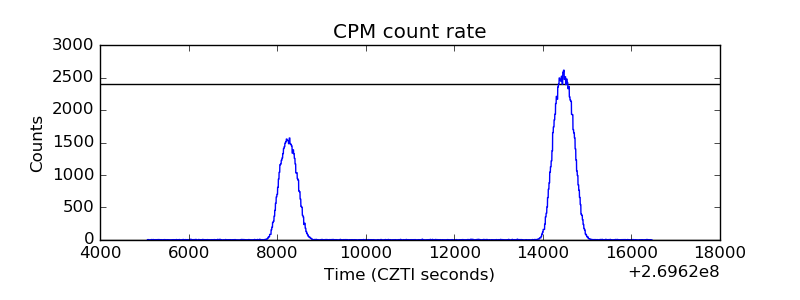 |
| CZT Counter | 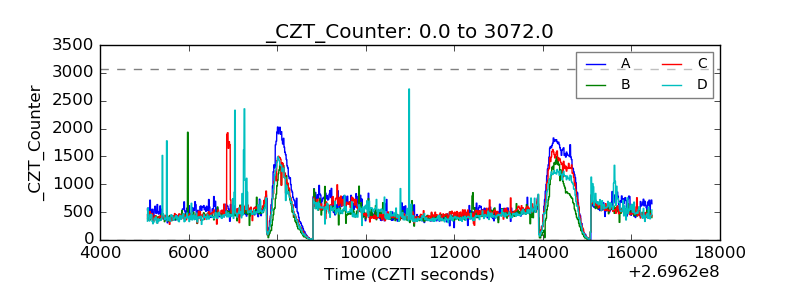 |
| +2.5 Volts monitor | 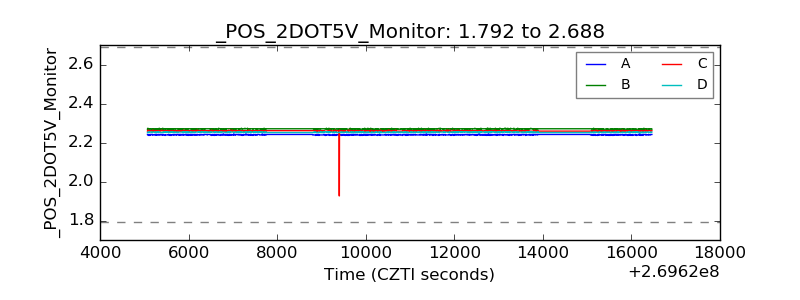 |
| +5 Volts monitor | 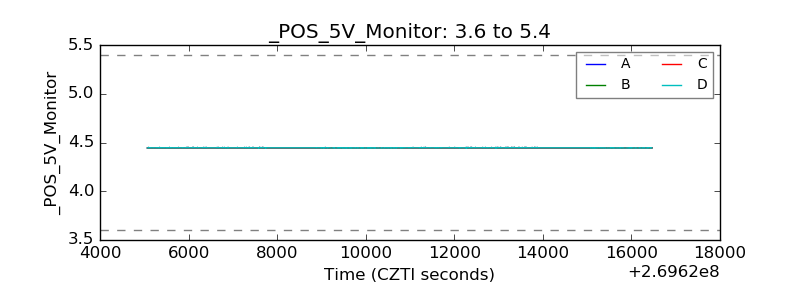 |
| _ROLL_ROT | 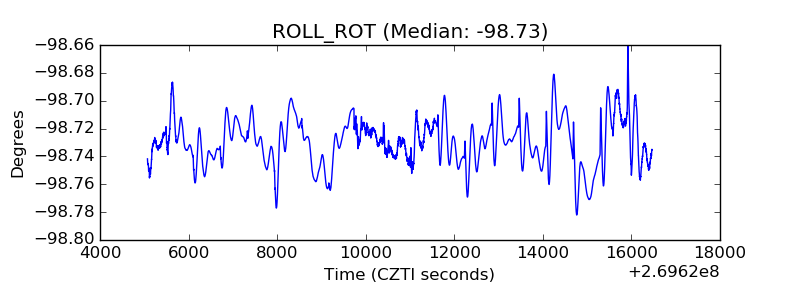 |
| _Roll_DEC | 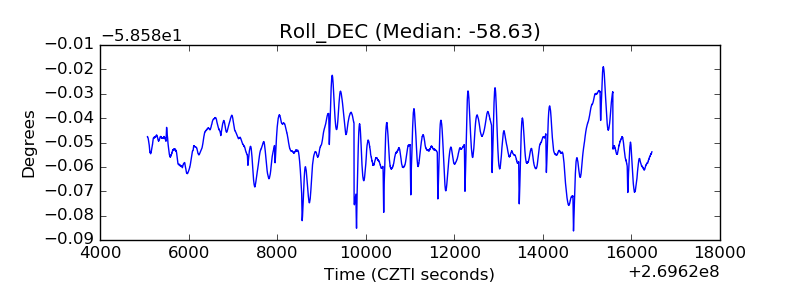 |
| _Roll_RA | 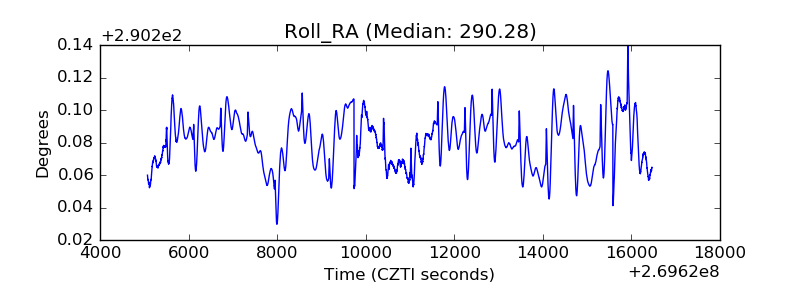 |
| Veto Counter | 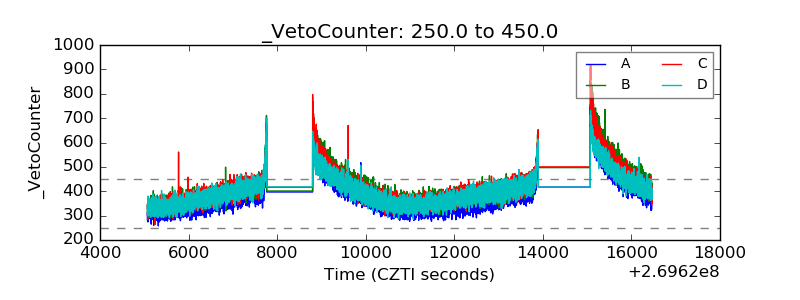 |