| Param | Original file | Final file |
|---|---|---|
| Filename | modeM0/AS1A04_218T08_9000002236_15168cztM0_level2.evt | modeM0/AS1A04_218T08_9000002236_15168cztM0_level2_quad_clean.evt |
| Size (bytes) | 451,831,680 | 101,240,640 |
| Size | 430.9 MB | 96.6 MB |
| Events in quadrant A | 3,768,877 | 654,869 |
| Events in quadrant B | 3,305,202 | 682,820 |
| Events in quadrant C | 3,224,953 | 671,341 |
| Events in quadrant D | 2,966,340 | 627,212 |
| Mode SS | |||
|---|---|---|---|
| Quadrant | BADHDUFLAG | Total packets | Discarded packets |
| A | 0 | 126 | 0 |
| B | 0 | 126 | 0 |
| C | 0 | 126 | 0 |
| D | 0 | 126 | 0 |
| Mode M9 | |||
|---|---|---|---|
| Quadrant | BADHDUFLAG | Total packets | Discarded packets |
| A | 0 | 16 | 0 |
| B | 0 | 16 | 0 |
| C | 0 | 16 | 0 |
| D | 0 | 17 | 0 |
| Mode M0 | |||
|---|---|---|---|
| Quadrant | BADHDUFLAG | Total packets | Discarded packets |
| A | 0 | 15380 | 3 |
| B | 0 | 13756 | 2 |
| C | 0 | 13377 | 2 |
| D | 0 | 13073 | 2 |
| Quadrant | Total seconds | Saturated seconds | Saturation percentage |
|---|---|---|---|
| A | 6157 | 51 | 0.828325% |
| B | 6157 | 85 | 1.380542% |
| C | 6157 | 16 | 0.259867% |
| D | 6157 | 24 | 0.389800% |
Noise dominated data is calculated using 1-second bins in cleaned event files. If a bin has >2000 counts, and if more than 50% of those come from <1% of pixels, then it is considered to be noise-dominated and hence unusable.
| Quadrant | # 1 sec bins | Bins with >0 counts | Bins with >2000 counts | High rate bins dominated by noise | Noise dominated (total time) | Noise dominated (detector-on time) | Marked lightcurve |
|---|---|---|---|---|---|---|---|
| A | 7508 | 6159 | 13 | 13 | 0.17% | 0.21% | 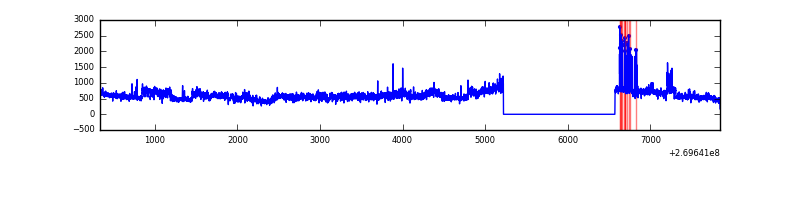 |
| B | 7508 | 6159 | 22 | 22 | 0.29% | 0.36% | 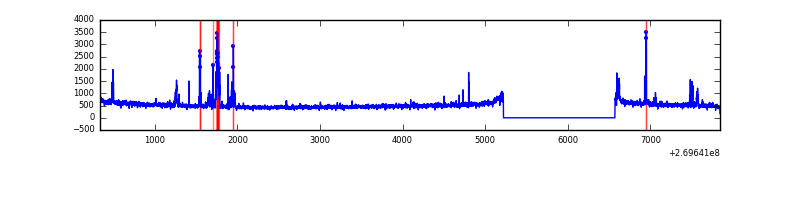 |
| C | 7508 | 6159 | 1 | 1 | 0.01% | 0.02% | 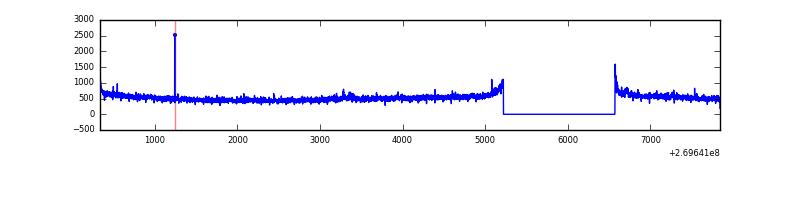 |
| D | 7508 | 6159 | 13 | 13 | 0.17% | 0.21% | 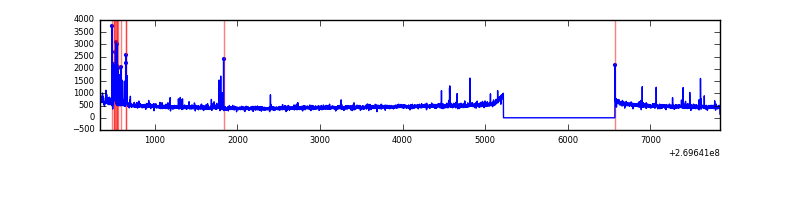 |
Top three noisy pixels from each quadrant. If the there are fewer than three noisy pixels in the level2.evt file, extra rows are filled as -1
| Pixel properties | Quadrant properties | ||||||
|---|---|---|---|---|---|---|---|
| Quadrant | DetID | PixID | Counts | Sigma | Mean | Median | Sigma |
| A | 15 | 239 | 526953 | 3403.55 | 768 | 754 | 154.6 |
| A | 0 | 253 | 235000 | 1515.14 | 768 | 754 | 154.6 |
| A | 12 | 189 | 39120 | 248.16 | 768 | 754 | 154.6 |
| B | 3 | 64 | 137962 | 943.88 | 783 | 765 | 145.4 |
| B | 0 | 230 | 41982 | 283.56 | 783 | 765 | 145.4 |
| B | 0 | 197 | 24163 | 160.97 | 783 | 765 | 145.4 |
| C | 3 | 233 | 230140 | 1323.57 | 758 | 764 | 173.3 |
| C | 9 | 236 | 34968 | 197.37 | 758 | 764 | 173.3 |
| C | 13 | 61 | 5409 | 26.8 | 758 | 764 | 173.3 |
| D | 5 | 222 | 55008 | 303.28 | 741 | 718 | 179.0 |
| D | 10 | 70 | 33823 | 184.93 | 741 | 718 | 179.0 |
| D | 2 | 234 | 23309 | 126.2 | 741 | 718 | 179.0 |
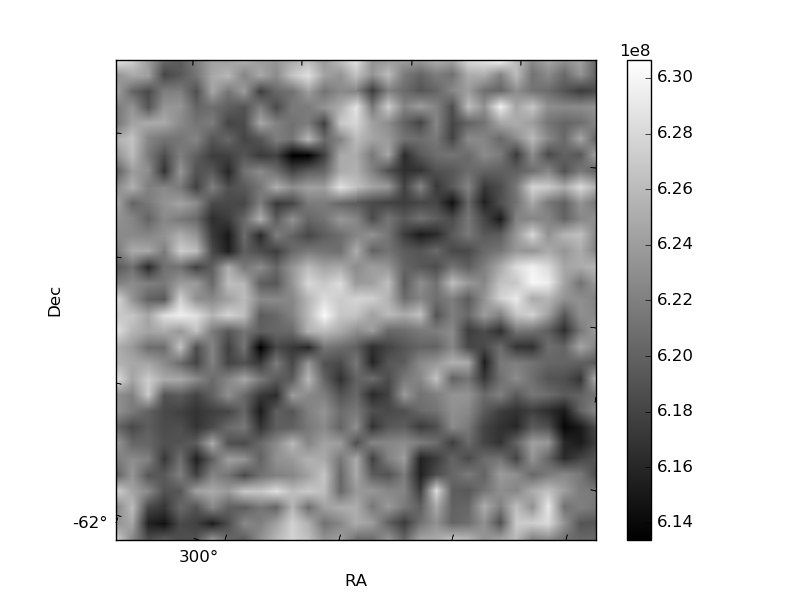
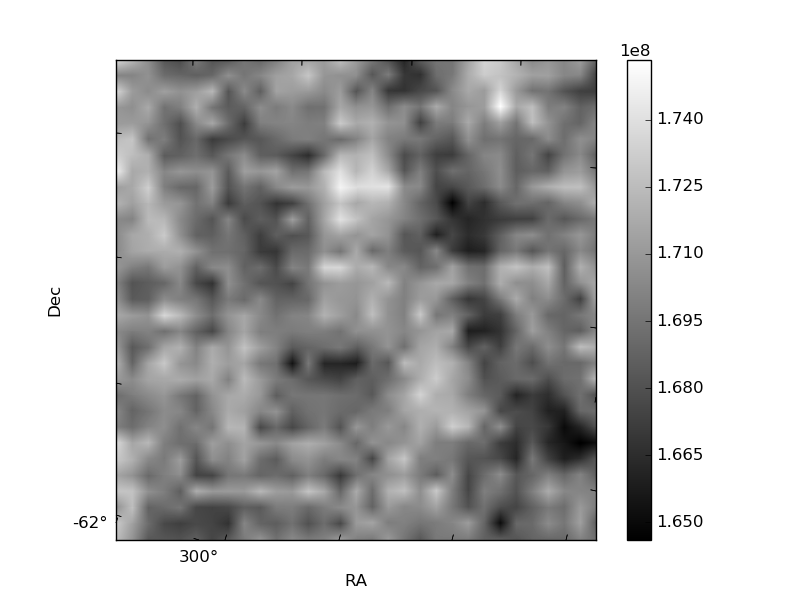
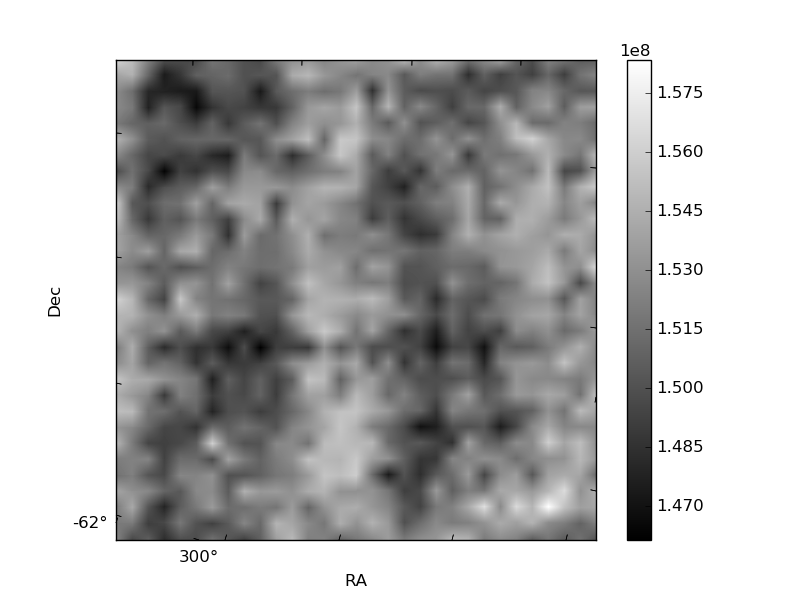
Histogram calculated using DETX and DETY for each event in the final _common_clean file
| Quadrant A | 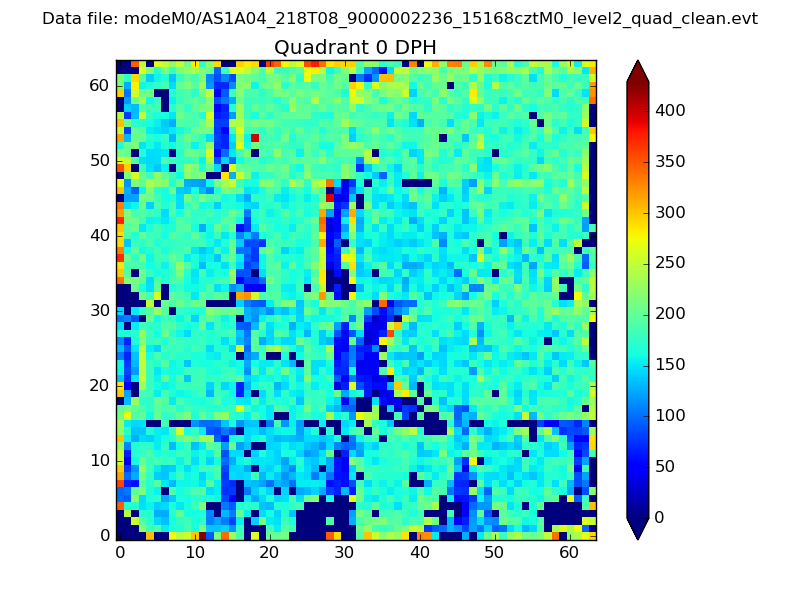 |
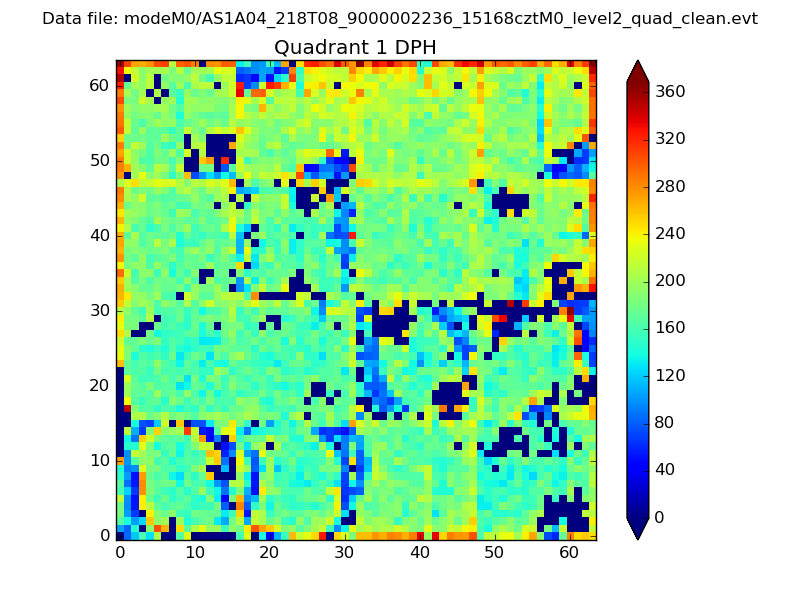 |
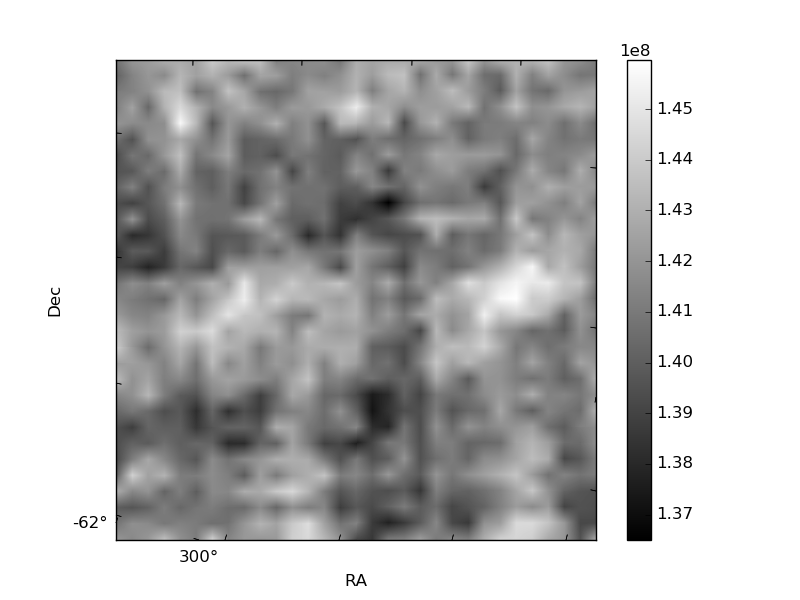
Quadrant B |
|---|---|---|---|
| Quadrant D | 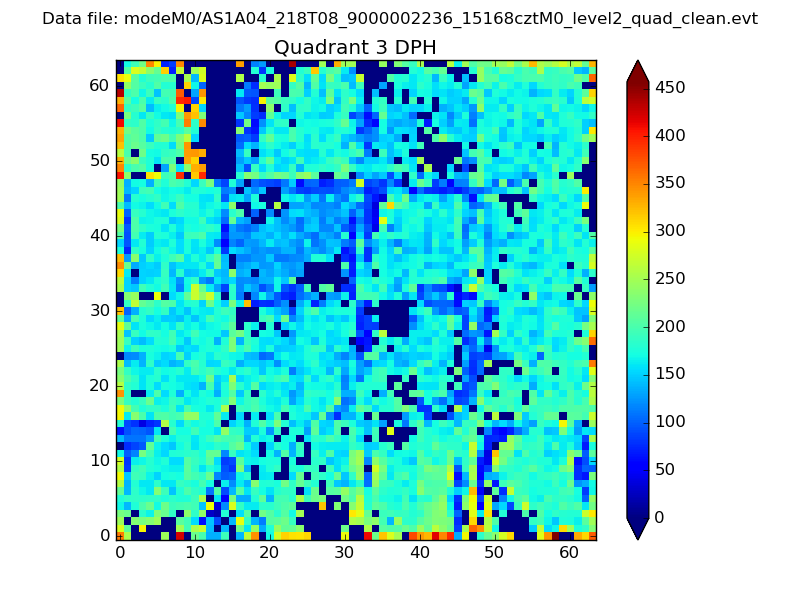 |
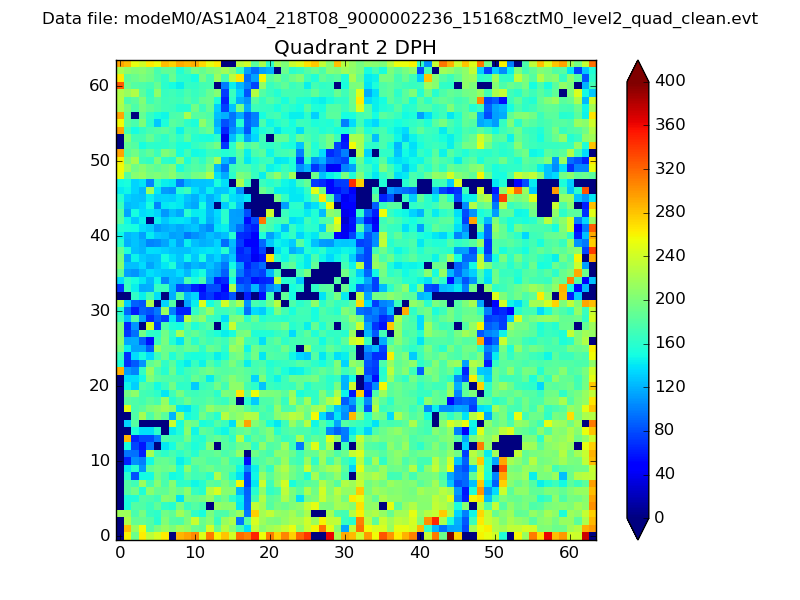 |
Quadrant C |
| Plot type | Count rate plots | Images |
|---|---|---|
| Comparison with Poisson distribution Blue bars denote a histogram of data divided into 1 sec bins. Red curve is a Poisson curve with rate = median count rate of data. |
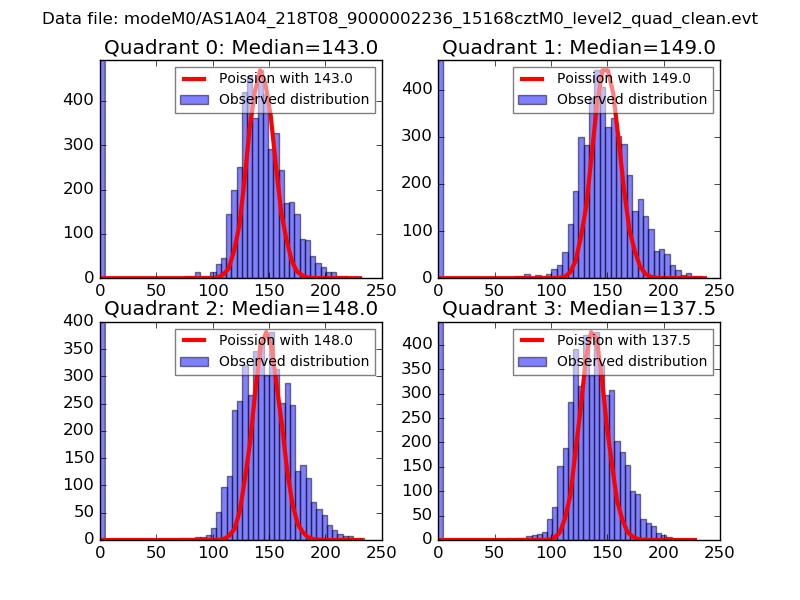 |
 |
| Quadrant-wise count rates Data is divided into 100 sec bins |
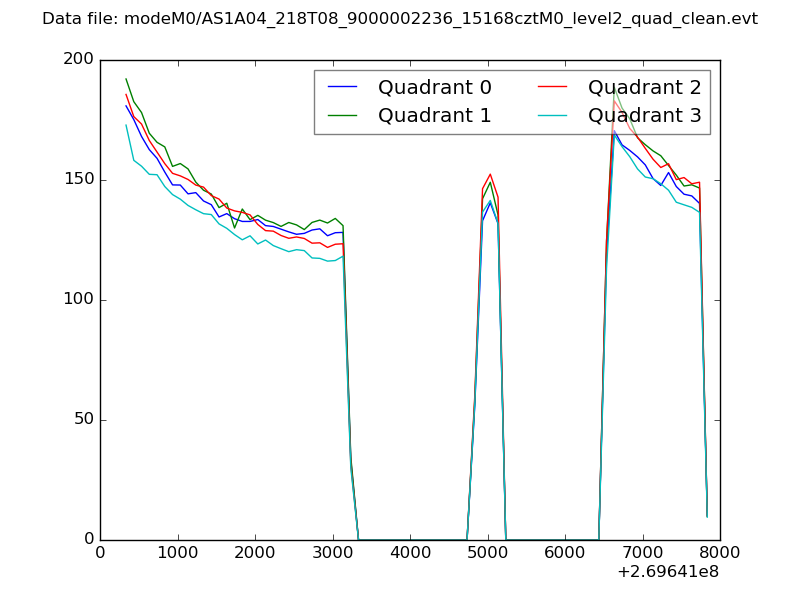 |
|
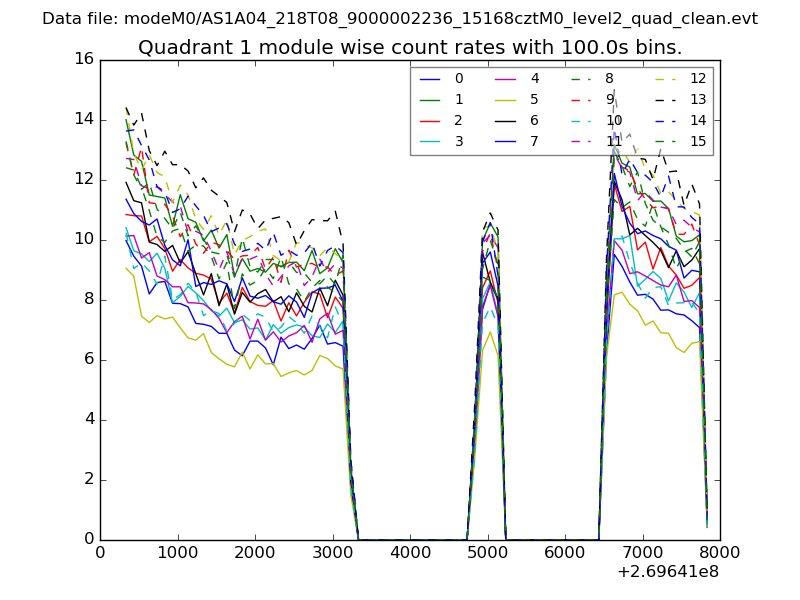
| Module-wise count rates for Quadrant A Data is divided into 100 sec bins |
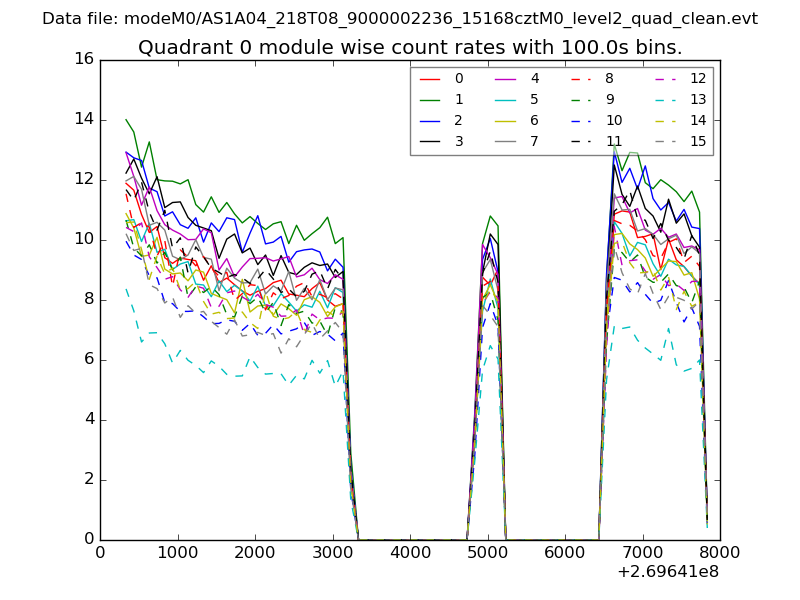 |
 |
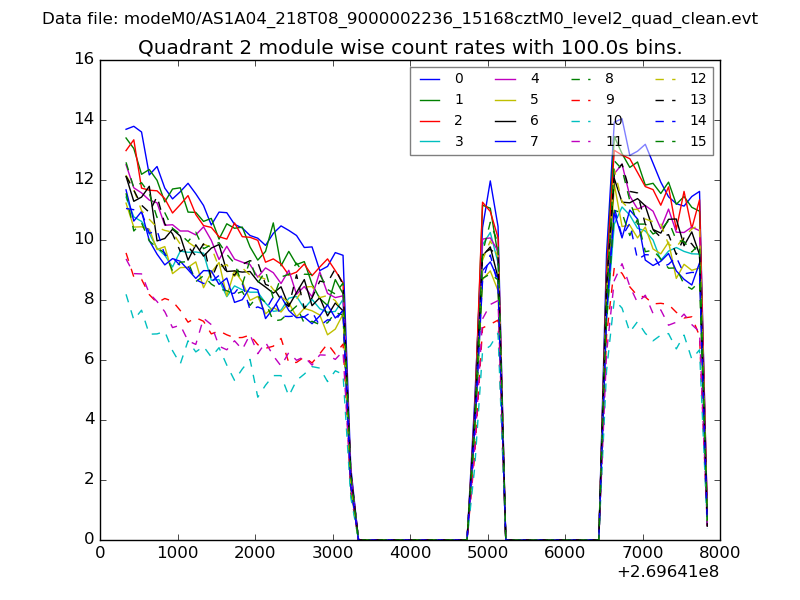
| Module-wise count rates for Quadrant B Data is divided into 100 sec bins |
 |
 |
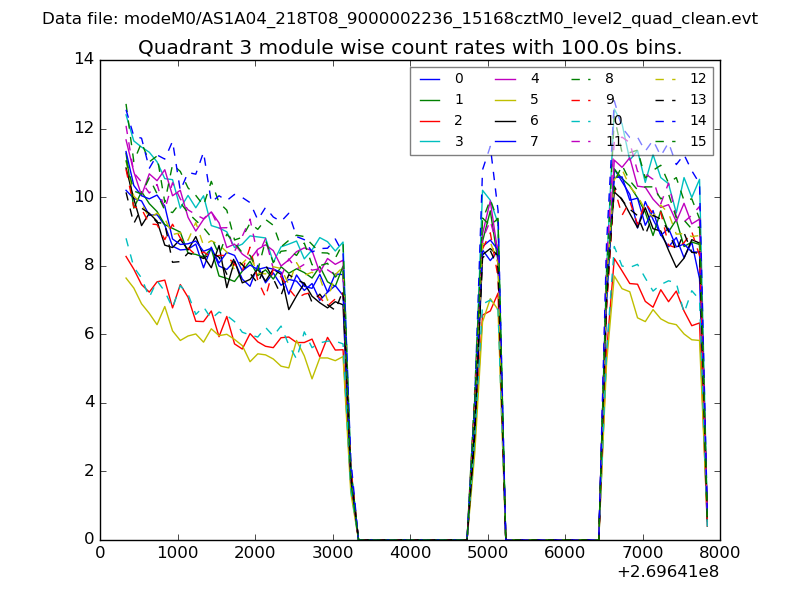
| Module-wise count rates for Quadrant C Data is divided into 100 sec bins |
 |
 |
| Module-wise count rates for Quadrant D Data is divided into 100 sec bins |
 |
 |
| Parameter | Plot |
|---|---|
| CZT HV Monitor |  |
| D_VDD | 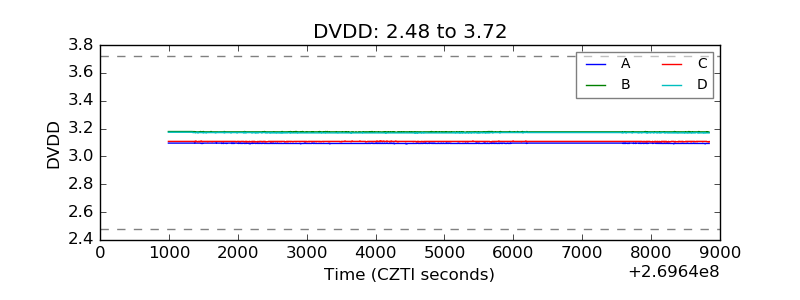 |
| Temperature 1 | 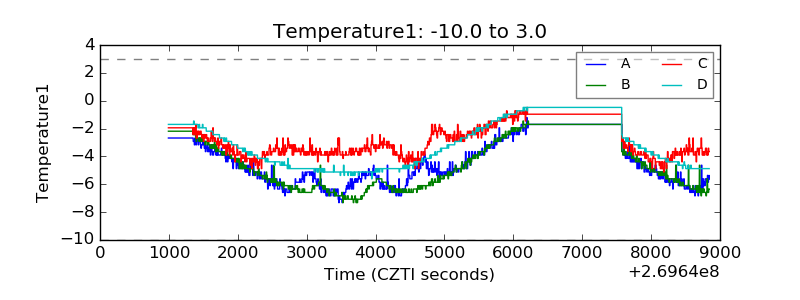 |
| Veto HV Monitor | 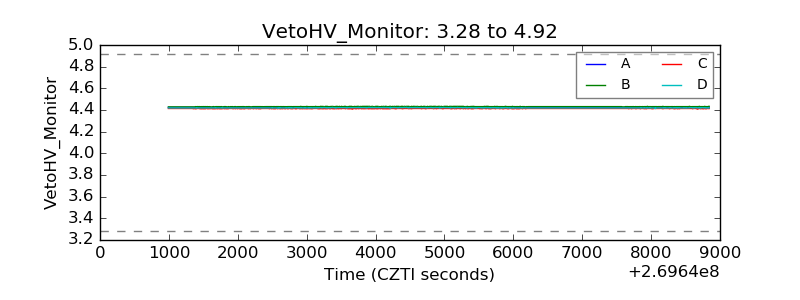 |
| Veto LLD | 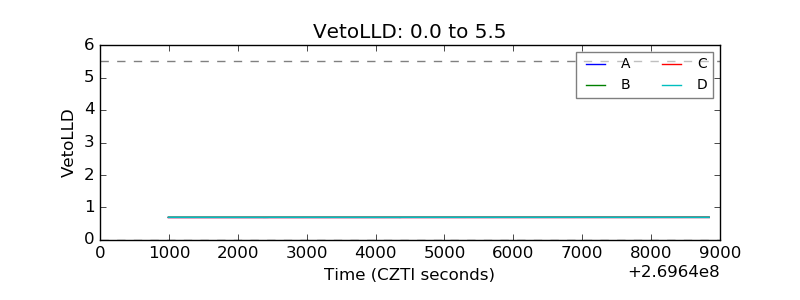 |
| Alpha Counter | 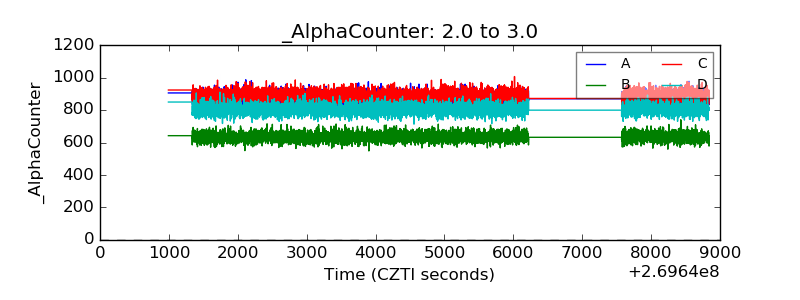 |
| _CPM_Rate | 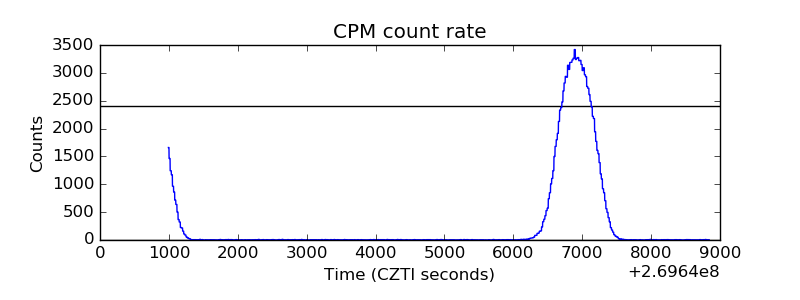 |
| CZT Counter | 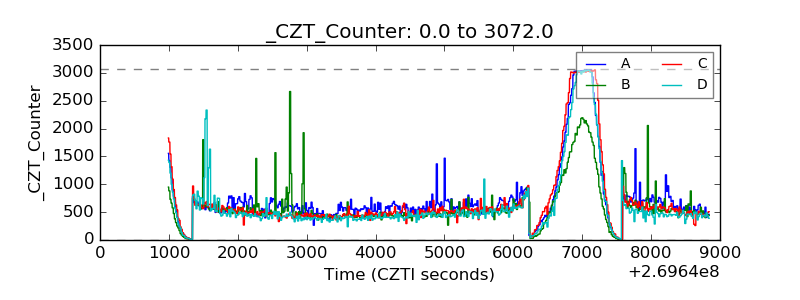 |
| +2.5 Volts monitor |  |
| +5 Volts monitor |  |
| _ROLL_ROT | 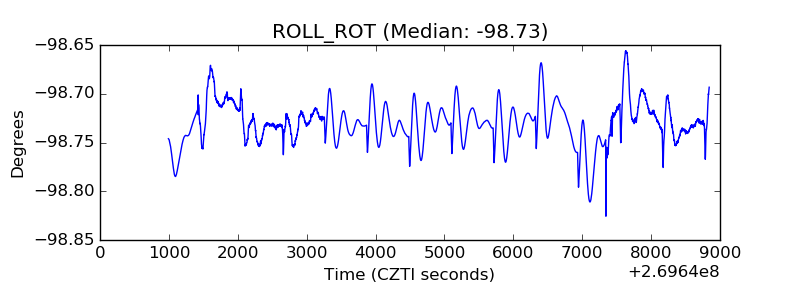 |
| _Roll_DEC |  |
| _Roll_RA | 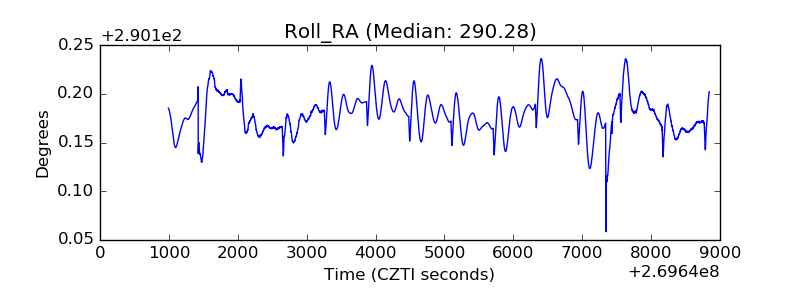 |
| Veto Counter | 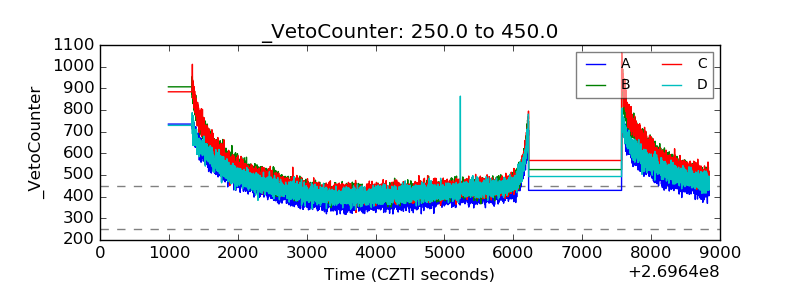 |