| Param | Original file | Final file |
|---|---|---|
| Filename | modeM0/AS1A04_218T08_9000002236_15169cztM0_level2.evt | modeM0/AS1A04_218T08_9000002236_15169cztM0_level2_quad_clean.evt |
| Size (bytes) | 467,136,000 | 104,906,880 |
| Size | 445.5 MB | 100.0 MB |
| Events in quadrant A | 3,909,720 | 675,568 |
| Events in quadrant B | 3,483,416 | 703,629 |
| Events in quadrant C | 3,269,753 | 702,290 |
| Events in quadrant D | 3,056,498 | 655,942 |
| Mode SS | |||
|---|---|---|---|
| Quadrant | BADHDUFLAG | Total packets | Discarded packets |
| A | 0 | 128 | 0 |
| B | 0 | 128 | 0 |
| C | 0 | 128 | 0 |
| D | 0 | 128 | 0 |
| Mode M9 | |||
|---|---|---|---|
| Quadrant | BADHDUFLAG | Total packets | Discarded packets |
| A | 0 | 25 | 0 |
| B | 0 | 25 | 0 |
| C | 0 | 25 | 0 |
| D | 0 | 26 | 0 |
| Mode M0 | |||
|---|---|---|---|
| Quadrant | BADHDUFLAG | Total packets | Discarded packets |
| A | 0 | 15986 | 3 |
| B | 0 | 14406 | 2 |
| C | 0 | 13459 | 2 |
| D | 0 | 13343 | 2 |
| Quadrant | Total seconds | Saturated seconds | Saturation percentage |
|---|---|---|---|
| A | 6301 | 71 | 1.126805% |
| B | 6301 | 119 | 1.888589% |
| C | 6301 | 15 | 0.238057% |
| D | 6301 | 26 | 0.412633% |
Noise dominated data is calculated using 1-second bins in cleaned event files. If a bin has >2000 counts, and if more than 50% of those come from <1% of pixels, then it is considered to be noise-dominated and hence unusable.
| Quadrant | # 1 sec bins | Bins with >0 counts | Bins with >2000 counts | High rate bins dominated by noise | Noise dominated (total time) | Noise dominated (detector-on time) | Marked lightcurve |
|---|---|---|---|---|---|---|---|
| A | 7702 | 6304 | 13 | 13 | 0.17% | 0.21% | 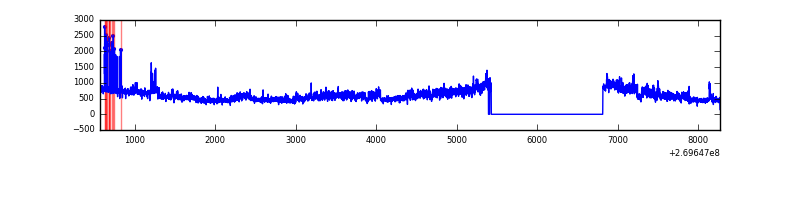 |
| B | 7702 | 6304 | 42 | 42 | 0.55% | 0.67% | 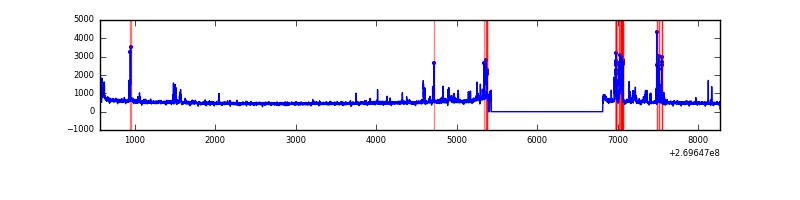 |
| C | 7702 | 6304 | 0 | 0 | 0.00% | 0.00% | 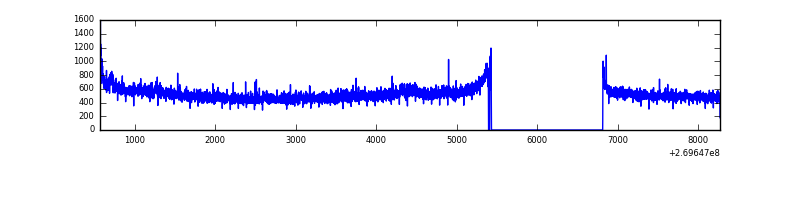 |
| D | 7702 | 6304 | 6 | 6 | 0.08% | 0.10% | 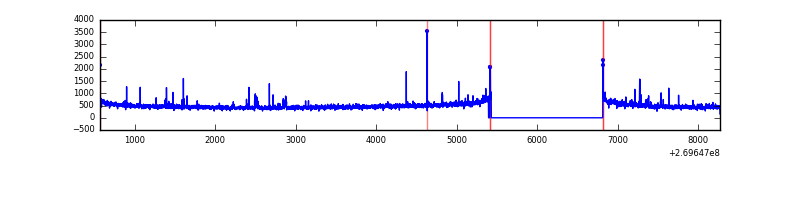 |
Top three noisy pixels from each quadrant. If the there are fewer than three noisy pixels in the level2.evt file, extra rows are filled as -1
| Pixel properties | Quadrant properties | ||||||
|---|---|---|---|---|---|---|---|
| Quadrant | DetID | PixID | Counts | Sigma | Mean | Median | Sigma |
| A | 15 | 239 | 463958 | 2973.8 | 781 | 765 | 155.8 |
| A | 0 | 253 | 315502 | 2020.68 | 781 | 765 | 155.8 |
| A | 12 | 189 | 75882 | 482.27 | 781 | 765 | 155.8 |
| B | 3 | 64 | 209621 | 1417.14 | 798 | 777 | 147.4 |
| B | 0 | 189 | 76735 | 515.42 | 798 | 777 | 147.4 |
| B | 0 | 197 | 22206 | 145.41 | 798 | 777 | 147.4 |
| C | 3 | 233 | 190877 | 1071.24 | 782 | 788 | 177.4 |
| C | 9 | 236 | 20138 | 109.05 | 782 | 788 | 177.4 |
| C | 10 | 22 | 11150 | 58.39 | 782 | 788 | 177.4 |
| D | 2 | 16 | 74173 | 400.46 | 764 | 742 | 183.4 |
| D | 2 | 33 | 24503 | 129.58 | 764 | 742 | 183.4 |
| D | 2 | 152 | 24433 | 129.2 | 764 | 742 | 183.4 |
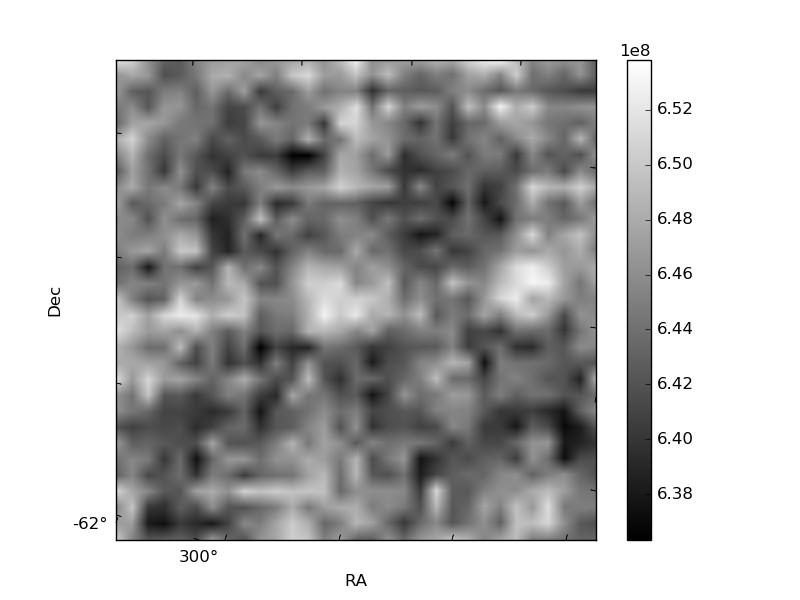
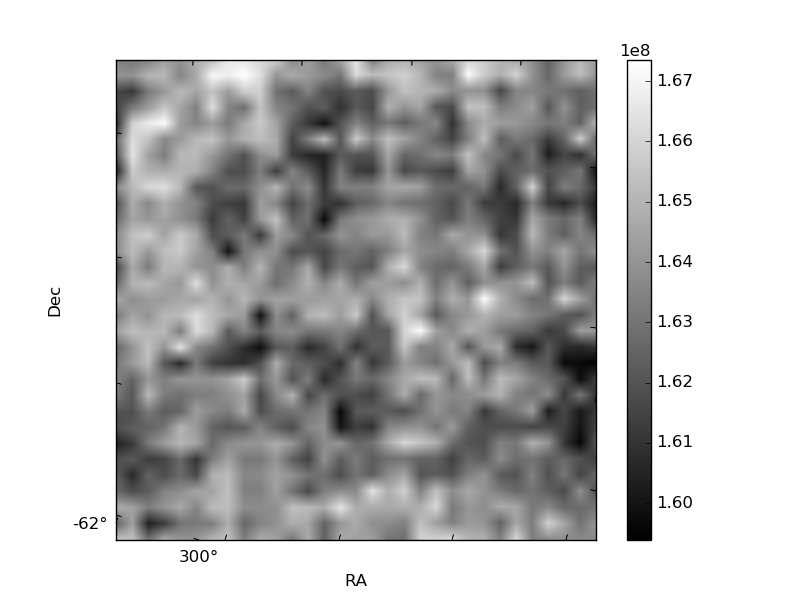
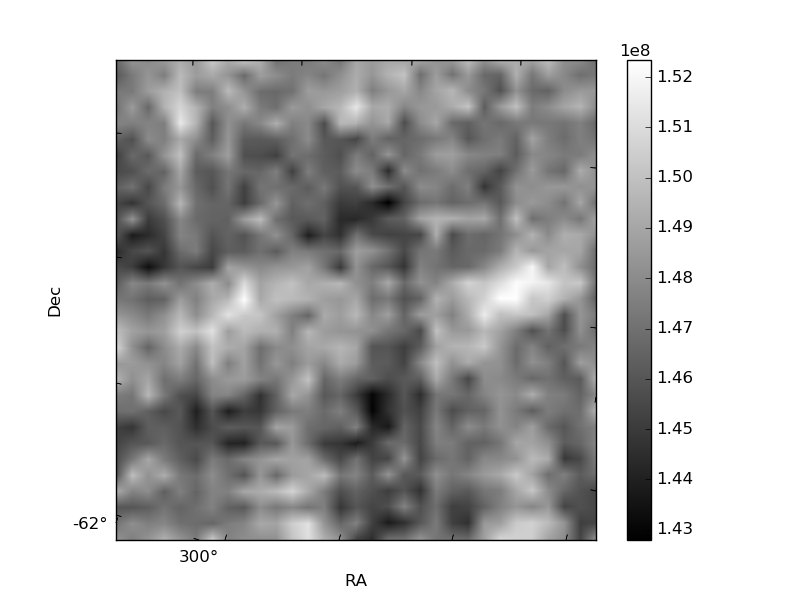
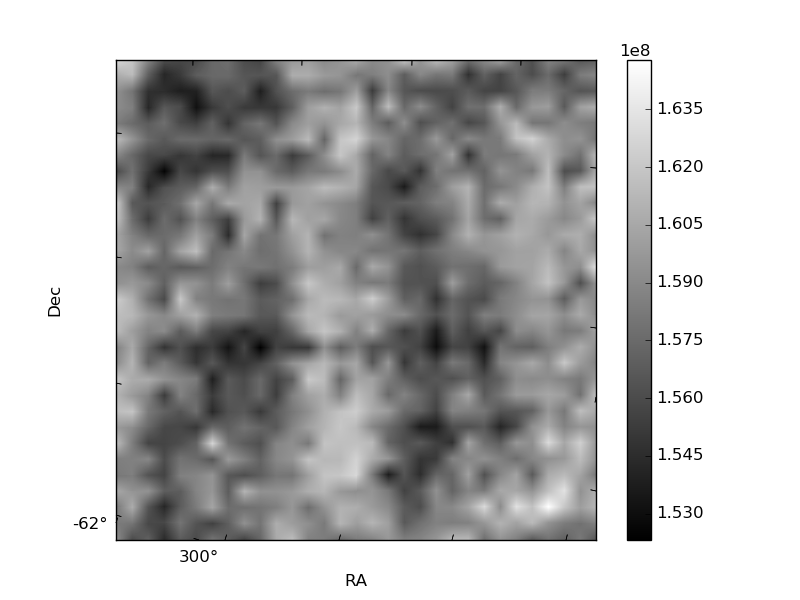
Histogram calculated using DETX and DETY for each event in the final _common_clean file
| Quadrant A | 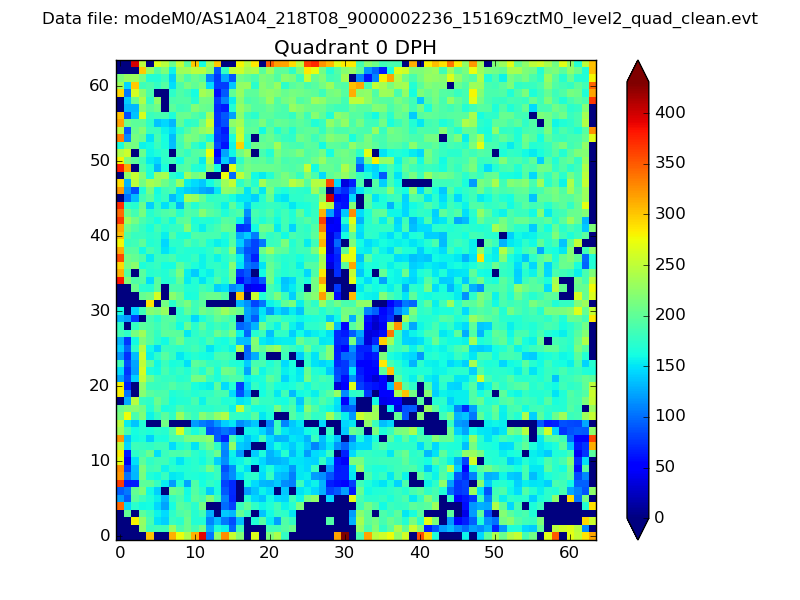 |
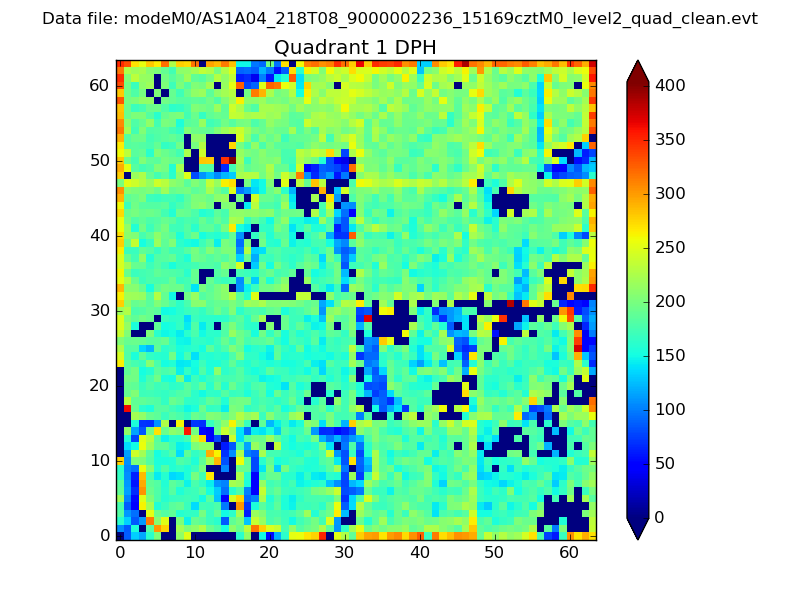 |
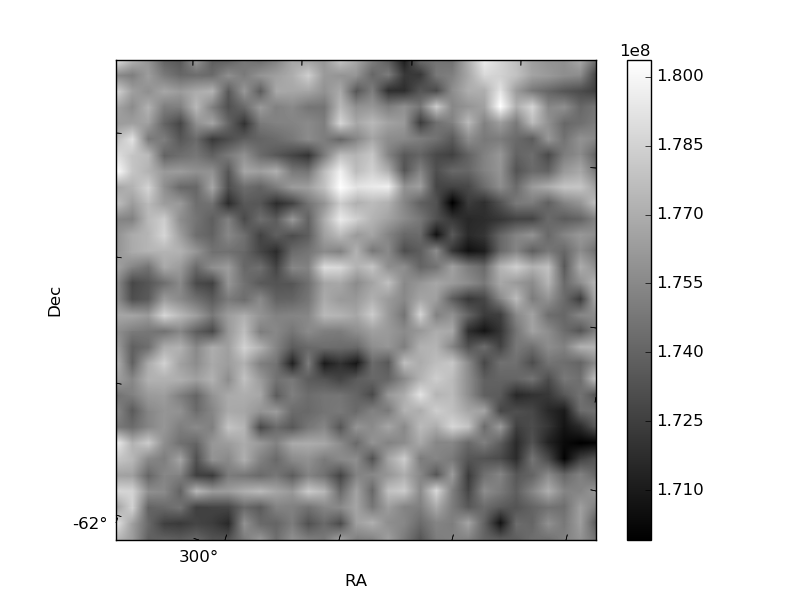
Quadrant B |
|---|---|---|---|
| Quadrant D | 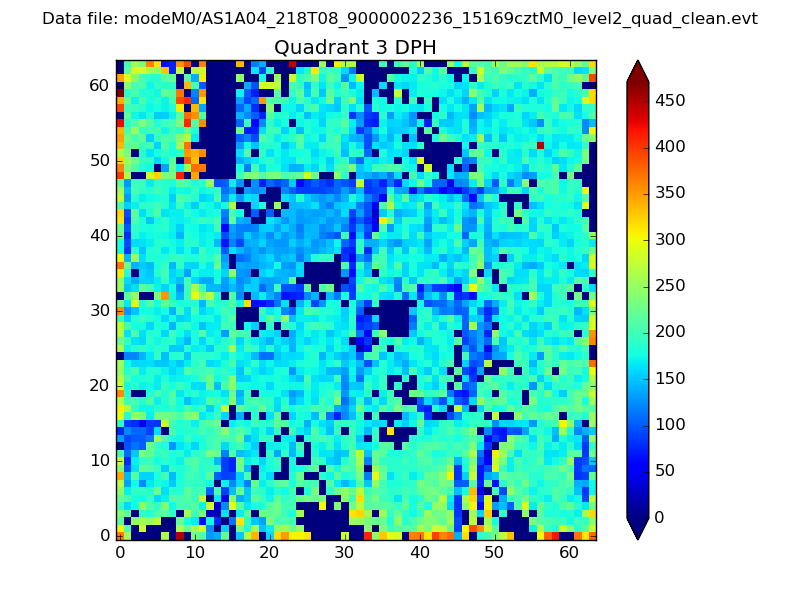 |
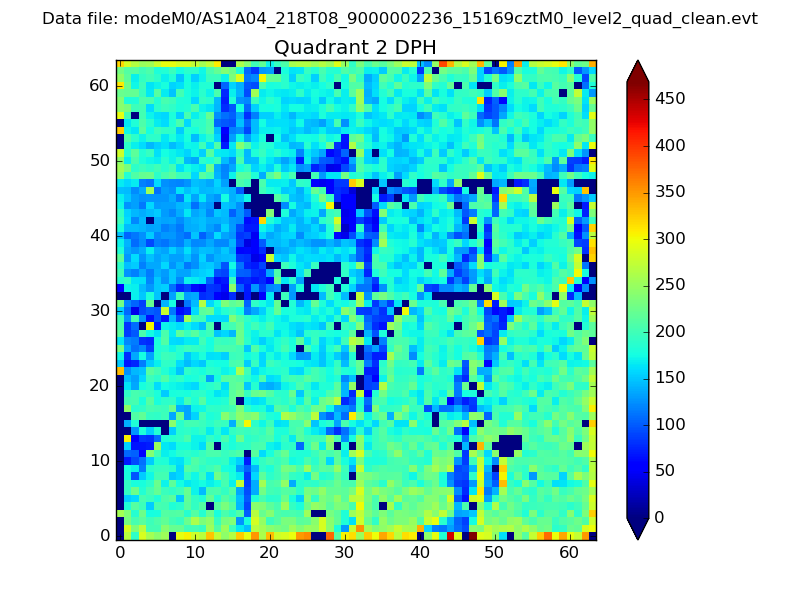 |
Quadrant C |
| Plot type | Count rate plots | Images |
|---|---|---|
| Comparison with Poisson distribution Blue bars denote a histogram of data divided into 1 sec bins. Red curve is a Poisson curve with rate = median count rate of data. |
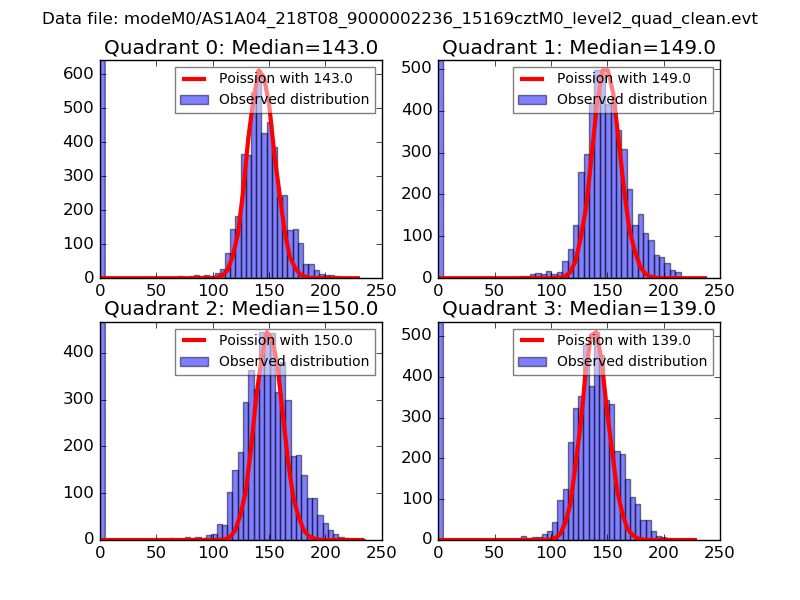 |
 |
| Quadrant-wise count rates Data is divided into 100 sec bins |
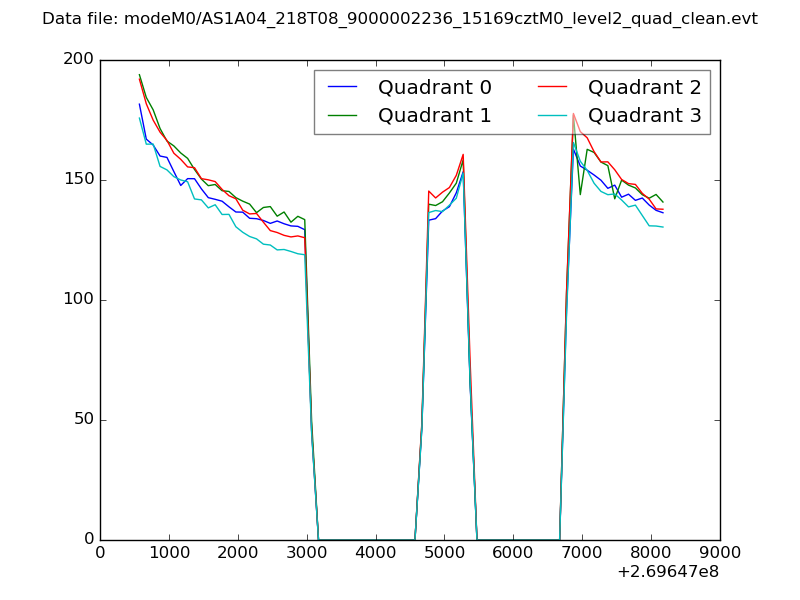 |
|
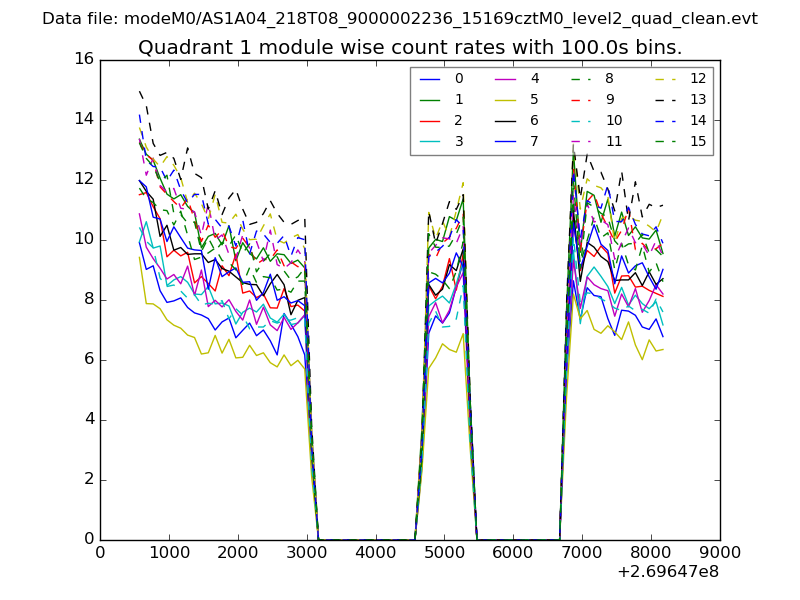
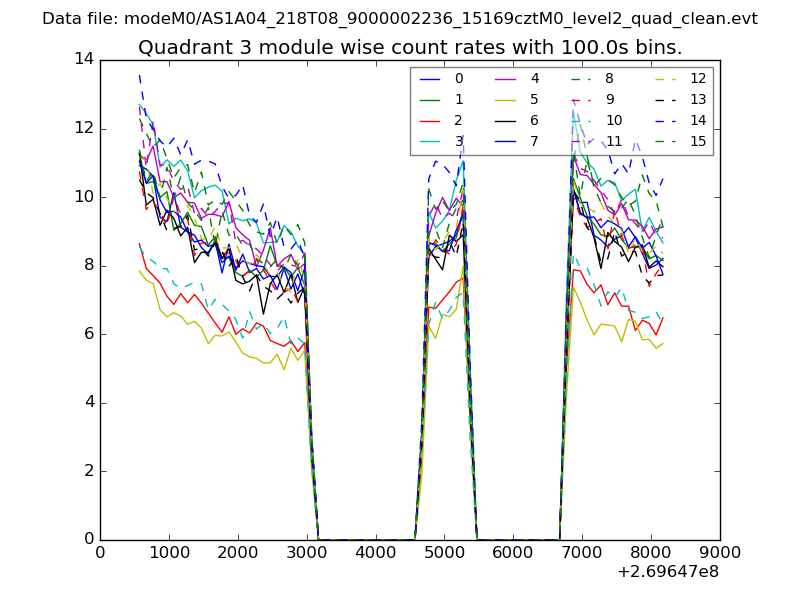
| Module-wise count rates for Quadrant A Data is divided into 100 sec bins |
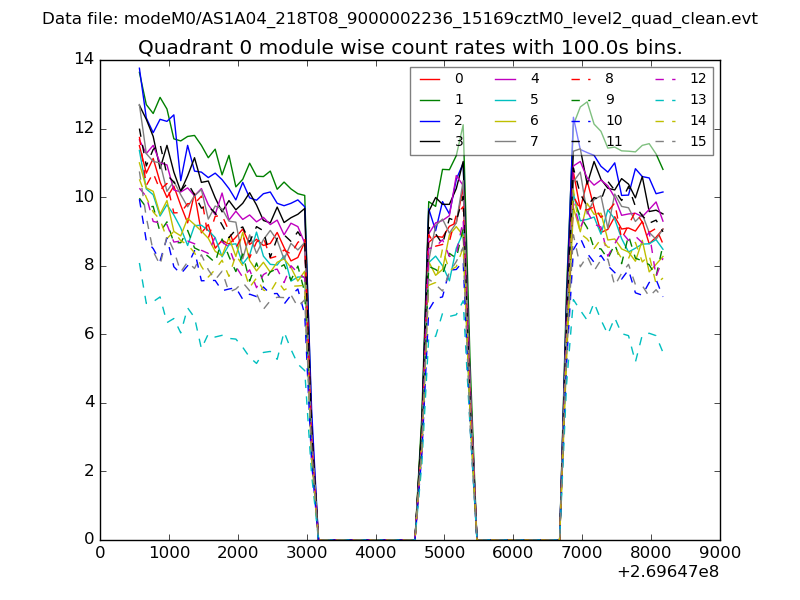 |
 |
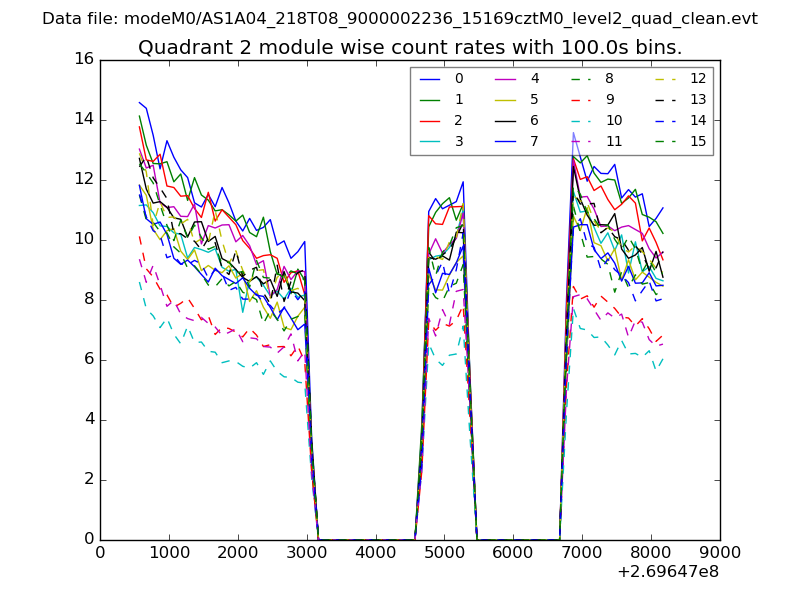
| Module-wise count rates for Quadrant B Data is divided into 100 sec bins |
 |
 |
| Module-wise count rates for Quadrant C Data is divided into 100 sec bins |
 |
 |
| Module-wise count rates for Quadrant D Data is divided into 100 sec bins |
 |
 |
| Parameter | Plot |
|---|---|
| CZT HV Monitor | 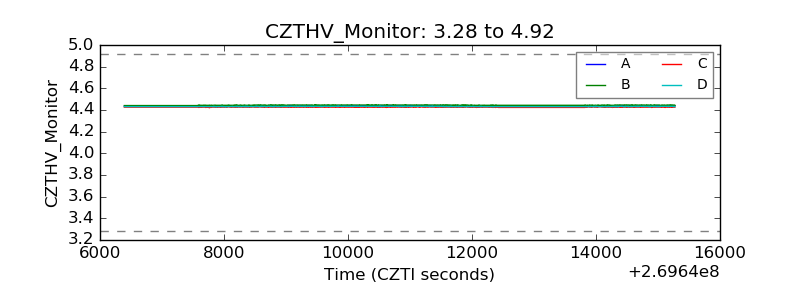 |
| D_VDD | 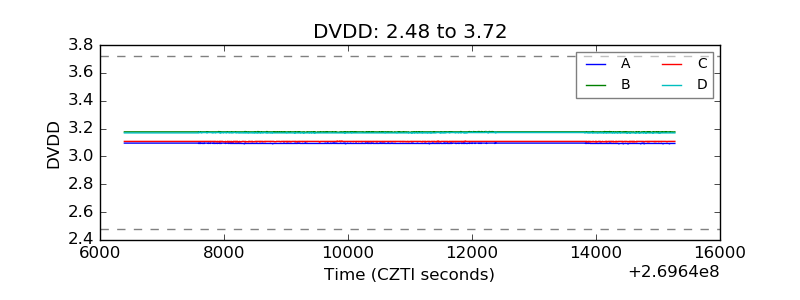 |
| Temperature 1 | 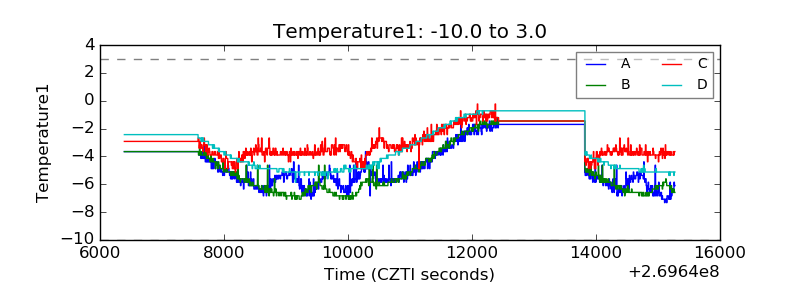 |
| Veto HV Monitor | 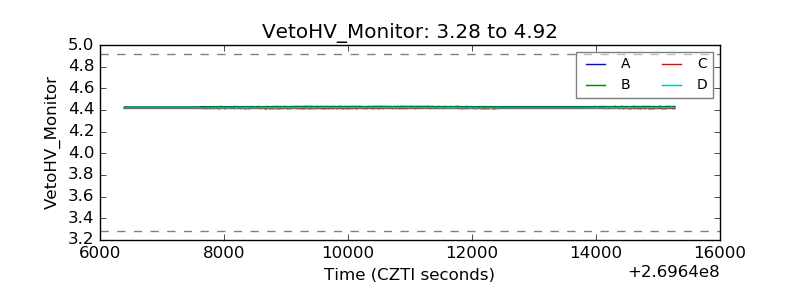 |
| Veto LLD | 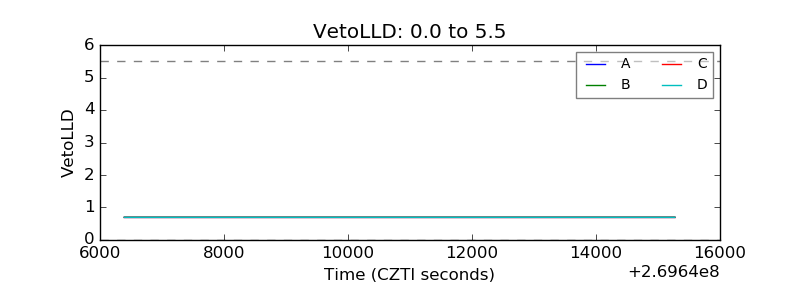 |
| Alpha Counter | 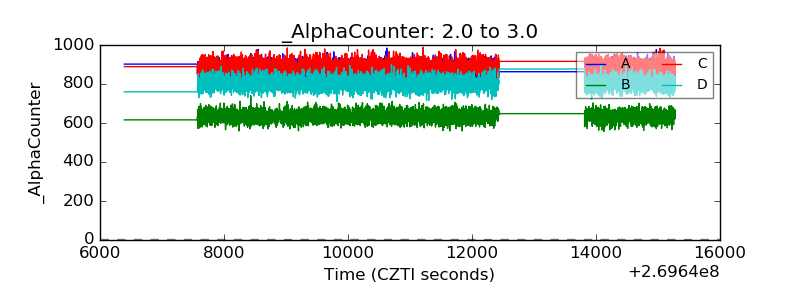 |
| _CPM_Rate | 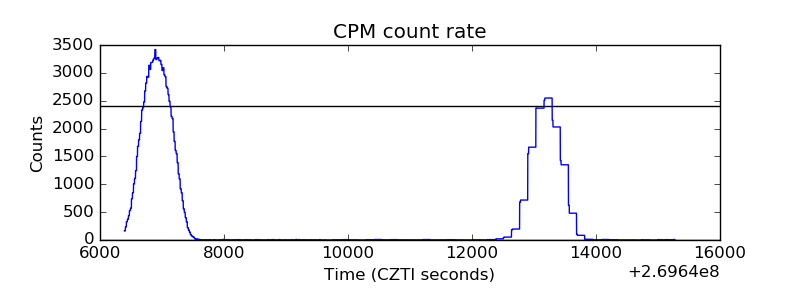 |
| CZT Counter | 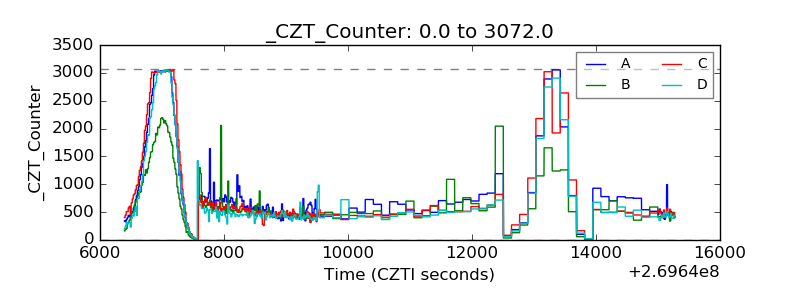 |
| +2.5 Volts monitor |  |
| +5 Volts monitor |  |
| _ROLL_ROT | 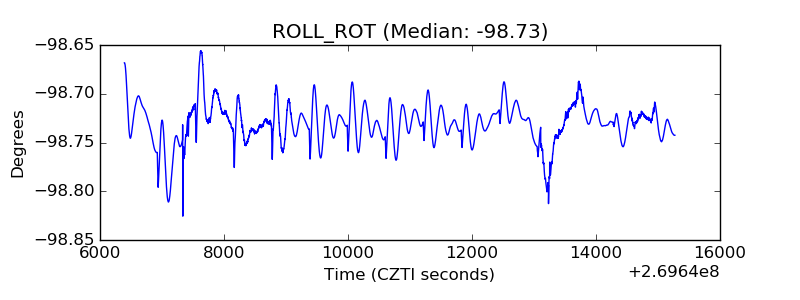 |
| _Roll_DEC | 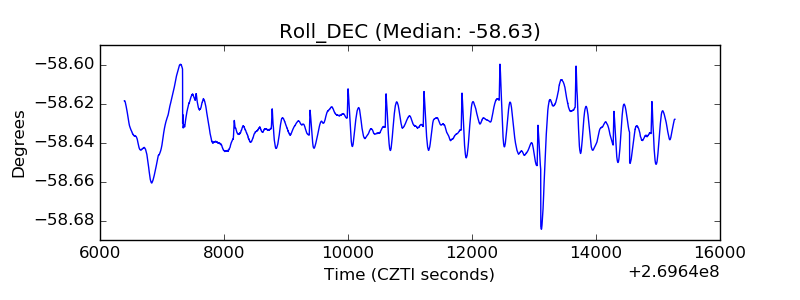 |
| _Roll_RA | 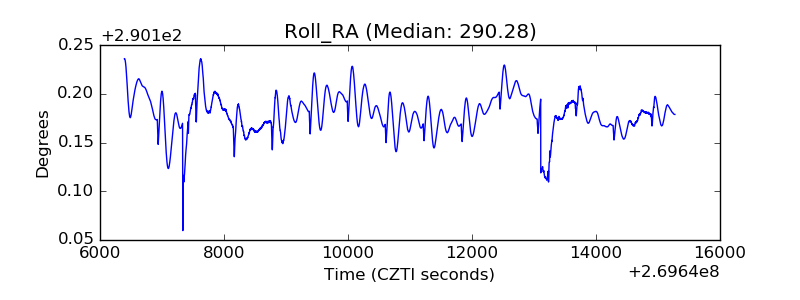 |
| Veto Counter | 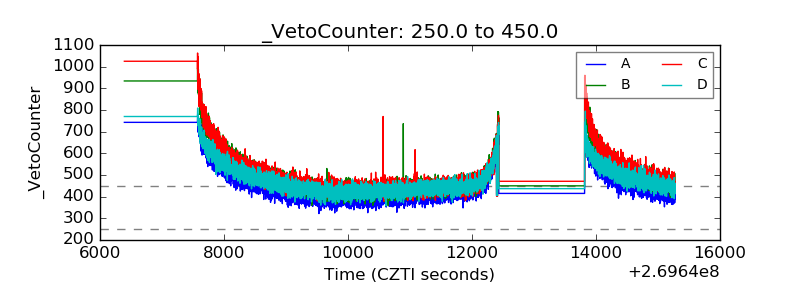 |