| Param | Original file | Final file |
|---|---|---|
| Filename | modeM0/AS1A04_218T08_9000002236_15171cztM0_level2.evt | modeM0/AS1A04_218T08_9000002236_15171cztM0_level2_quad_clean.evt |
| Size (bytes) | 407,664,000 | 86,938,560 |
| Size | 388.8 MB | 82.9 MB |
| Events in quadrant A | 3,187,462 | 552,696 |
| Events in quadrant B | 3,080,983 | 572,220 |
| Events in quadrant C | 2,957,045 | 577,136 |
| Events in quadrant D | 2,742,732 | 541,961 |
| Mode SS | |||
|---|---|---|---|
| Quadrant | BADHDUFLAG | Total packets | Discarded packets |
| A | 0 | 114 | 0 |
| B | 0 | 114 | 0 |
| C | 0 | 114 | 0 |
| D | 0 | 114 | 0 |
| Mode M9 | |||
|---|---|---|---|
| Quadrant | BADHDUFLAG | Total packets | Discarded packets |
| A | 0 | 14 | 0 |
| B | 0 | 14 | 0 |
| C | 0 | 14 | 0 |
| D | 0 | 15 | 0 |
| Mode M0 | |||
|---|---|---|---|
| Quadrant | BADHDUFLAG | Total packets | Discarded packets |
| A | 0 | 13198 | 3 |
| B | 0 | 12742 | 3 |
| C | 0 | 12177 | 3 |
| D | 0 | 11976 | 3 |
| Quadrant | Total seconds | Saturated seconds | Saturation percentage |
|---|---|---|---|
| A | 5555 | 23 | 0.414041% |
| B | 5555 | 98 | 1.764176% |
| C | 5555 | 11 | 0.198020% |
| D | 5555 | 12 | 0.216022% |
Noise dominated data is calculated using 1-second bins in cleaned event files. If a bin has >2000 counts, and if more than 50% of those come from <1% of pixels, then it is considered to be noise-dominated and hence unusable.
| Quadrant | # 1 sec bins | Bins with >0 counts | Bins with >2000 counts | High rate bins dominated by noise | Noise dominated (total time) | Noise dominated (detector-on time) | Marked lightcurve |
|---|---|---|---|---|---|---|---|
| A | 6931 | 5558 | 0 | 0 | 0.00% | 0.00% | 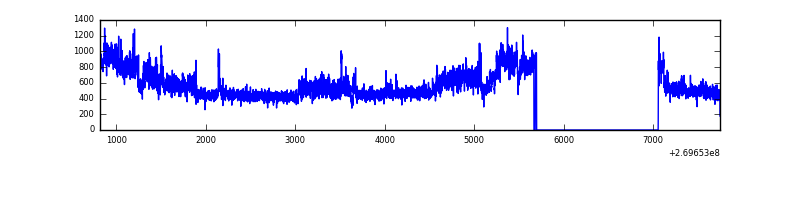 |
| B | 6931 | 5558 | 43 | 43 | 0.62% | 0.77% | 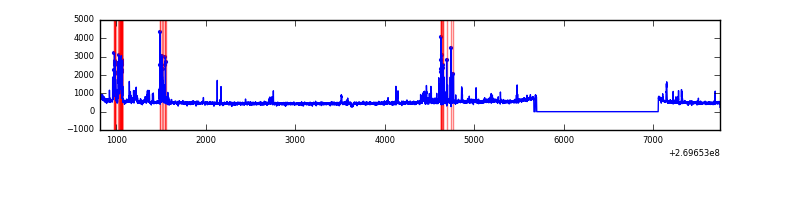 |
| C | 6931 | 5558 | 0 | 0 | 0.00% | 0.00% | 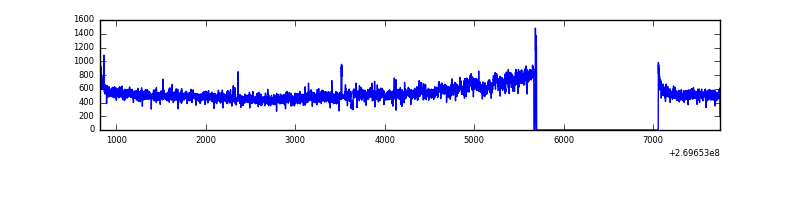 |
| D | 6931 | 5558 | 4 | 4 | 0.06% | 0.07% | 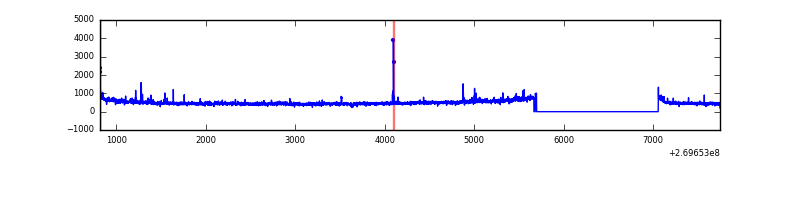 |
Top three noisy pixels from each quadrant. If the there are fewer than three noisy pixels in the level2.evt file, extra rows are filled as -1
| Pixel properties | Quadrant properties | ||||||
|---|---|---|---|---|---|---|---|
| Quadrant | DetID | PixID | Counts | Sigma | Mean | Median | Sigma |
| A | 15 | 239 | 284711 | 2080.32 | 680 | 668 | 136.5 |
| A | 0 | 253 | 195422 | 1426.37 | 680 | 668 | 136.5 |
| A | 12 | 189 | 71892 | 521.64 | 680 | 668 | 136.5 |
| B | 3 | 64 | 195398 | 1507.4 | 691 | 673 | 129.2 |
| B | 0 | 189 | 89626 | 688.6 | 691 | 673 | 129.2 |
| B | 4 | 80 | 44531 | 339.51 | 691 | 673 | 129.2 |
| C | 3 | 233 | 291288 | 1859.09 | 683 | 688 | 156.3 |
| C | 13 | 61 | 4881 | 26.82 | 683 | 688 | 156.3 |
| C | 9 | 236 | 2691 | 12.81 | 683 | 688 | 156.3 |
| D | 2 | 16 | 130934 | 807.68 | 669 | 649 | 161.3 |
| D | 12 | 222 | 23034 | 138.77 | 669 | 649 | 161.3 |
| D | 10 | 70 | 18888 | 113.07 | 669 | 649 | 161.3 |
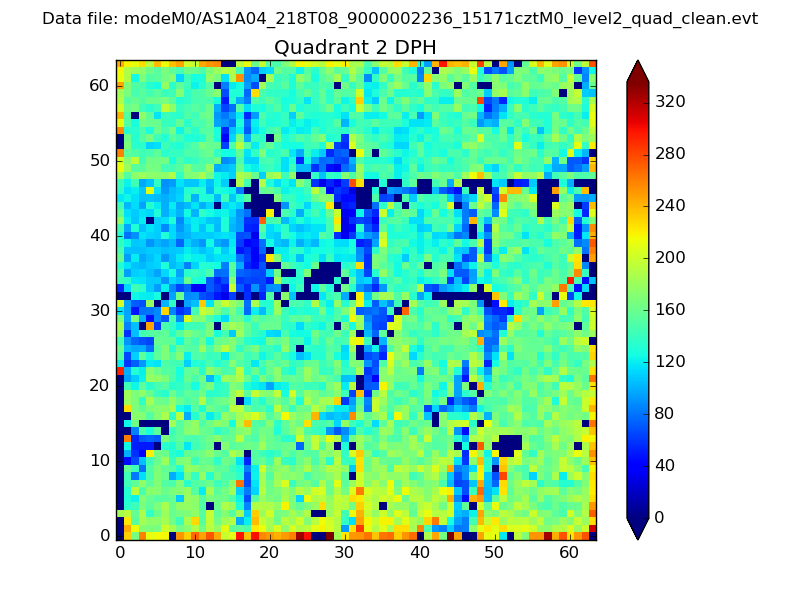
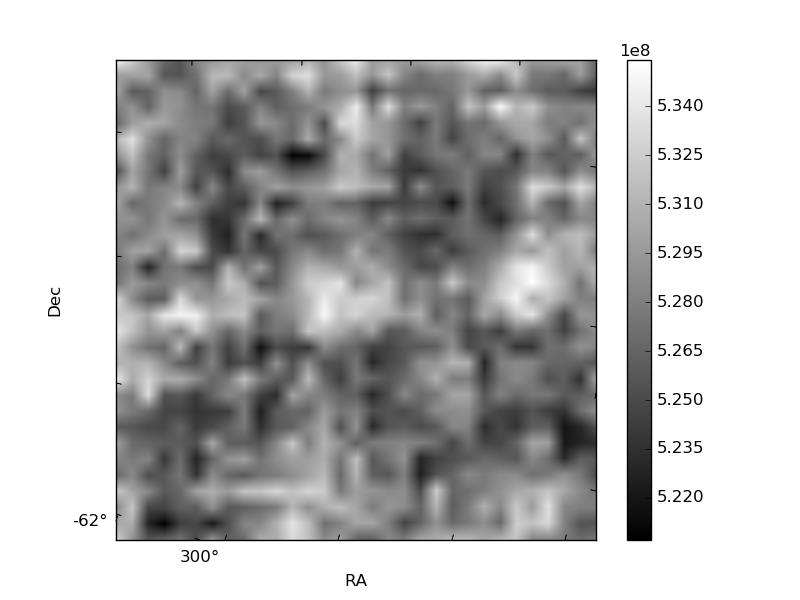
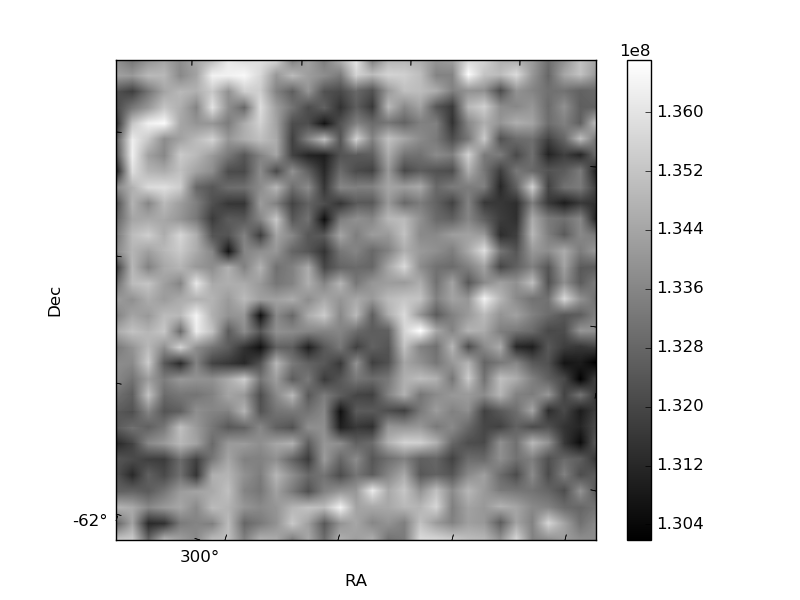
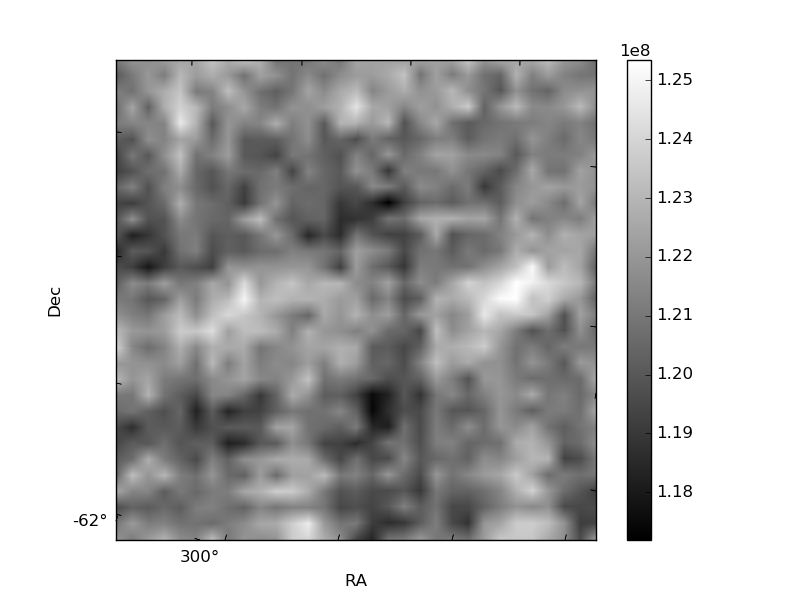
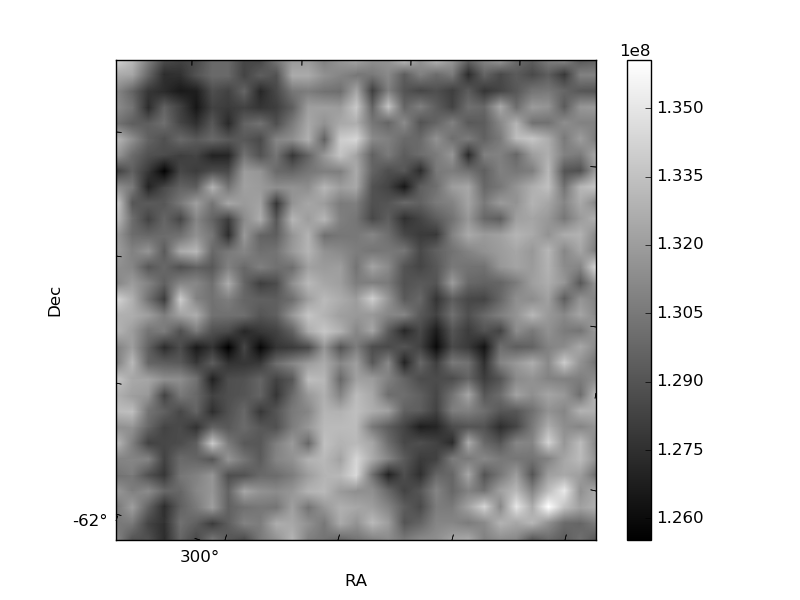
Histogram calculated using DETX and DETY for each event in the final _common_clean file
| Quadrant A | 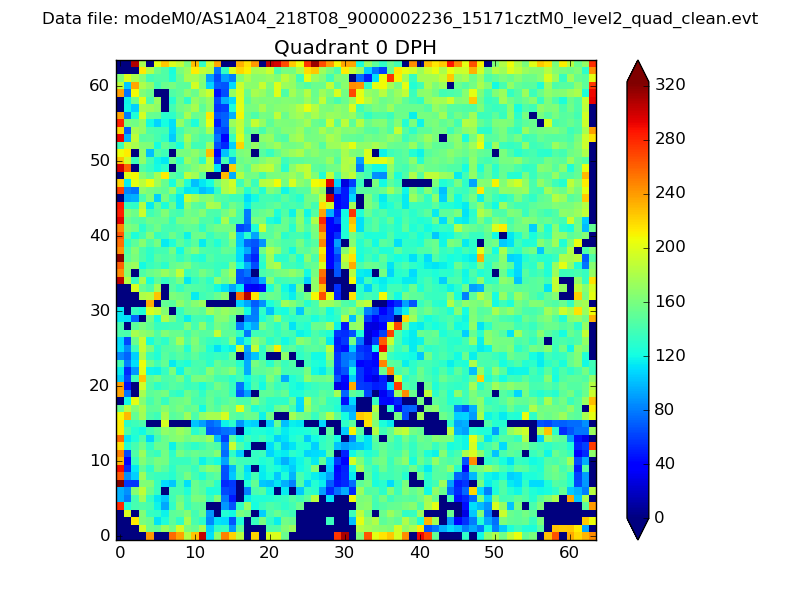 |
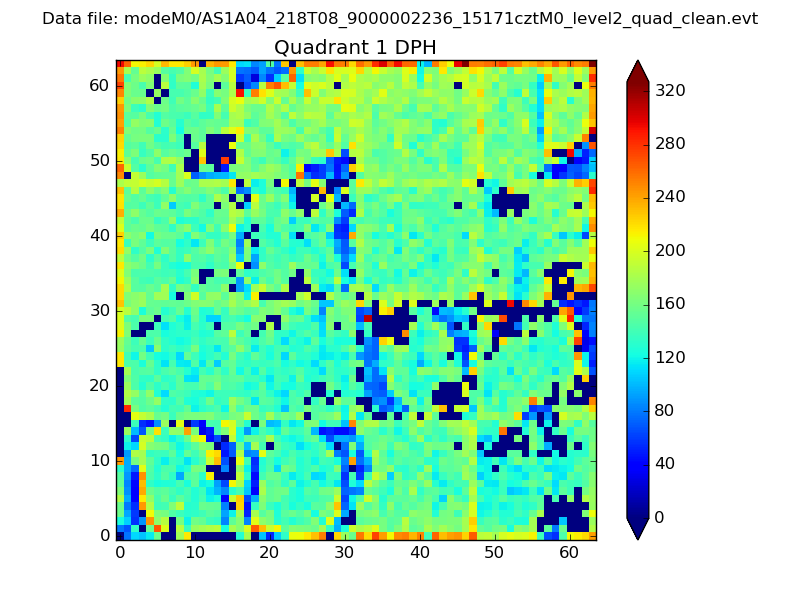 |
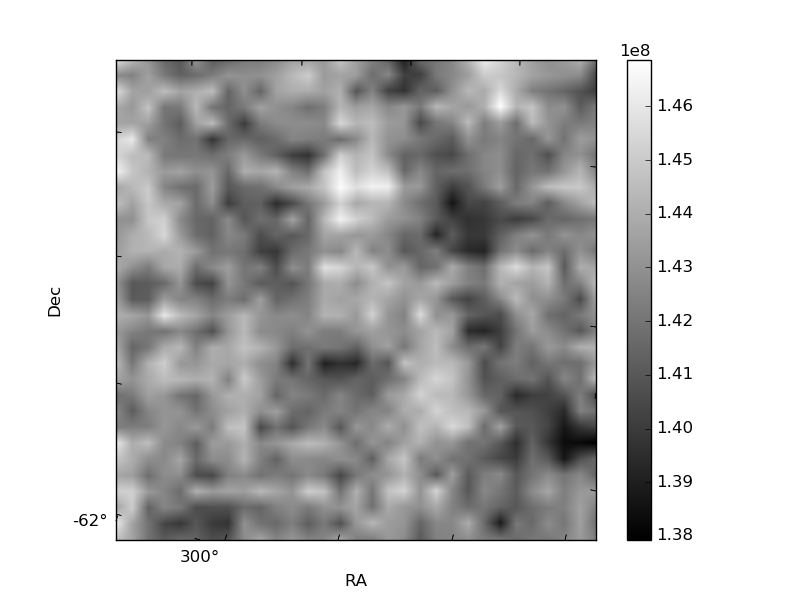
Quadrant B |
|---|---|---|---|
| Quadrant D | 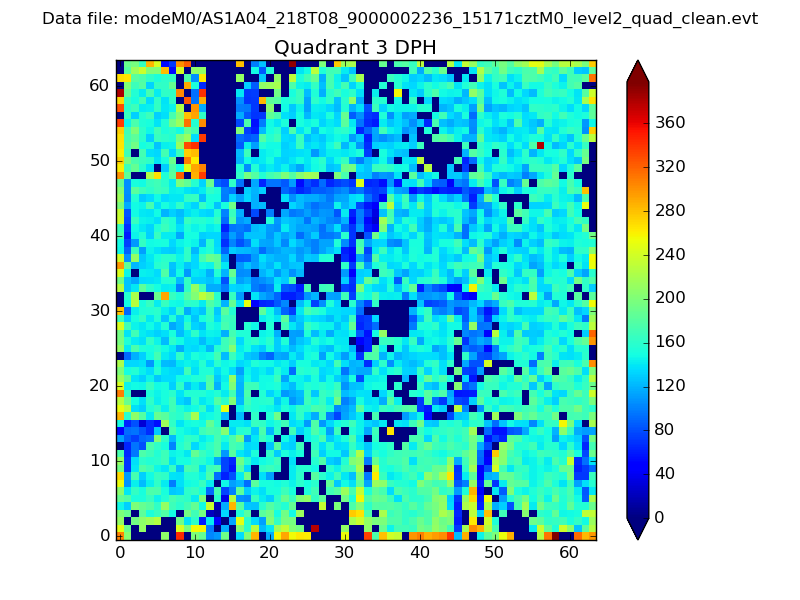 |
 |
Quadrant C |
| Plot type | Count rate plots | Images |
|---|---|---|
| Comparison with Poisson distribution Blue bars denote a histogram of data divided into 1 sec bins. Red curve is a Poisson curve with rate = median count rate of data. |
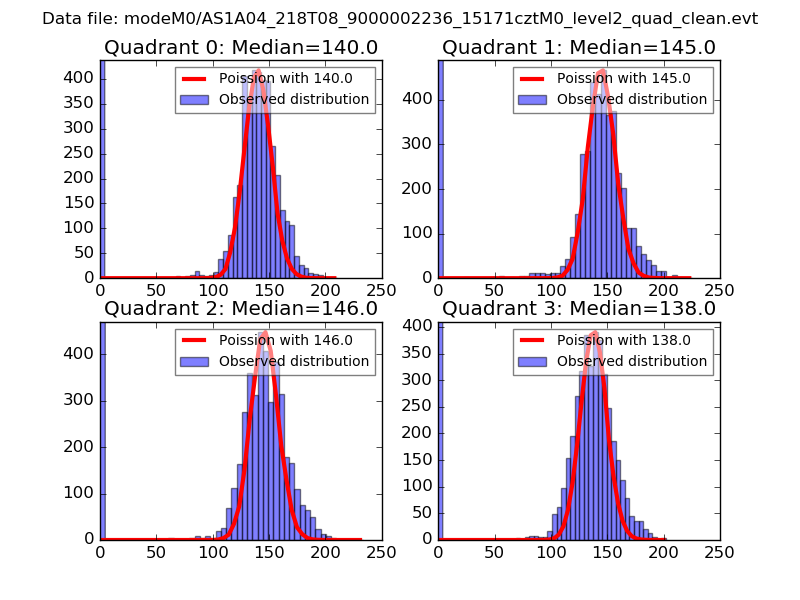 |
 |
| Quadrant-wise count rates Data is divided into 100 sec bins |
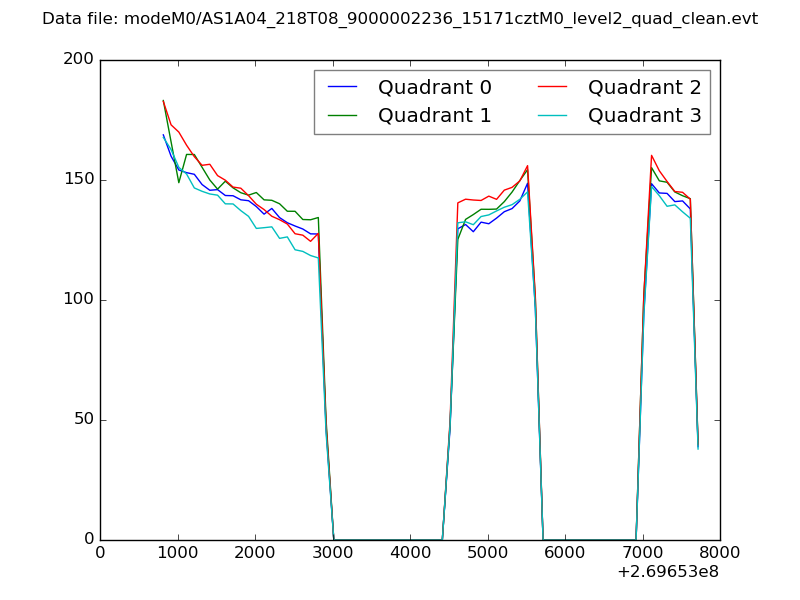 |
|
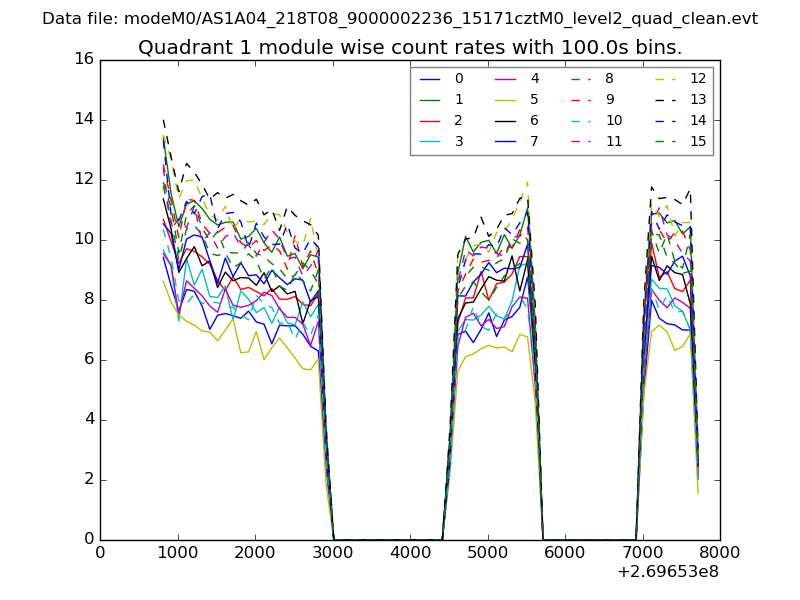
| Module-wise count rates for Quadrant A Data is divided into 100 sec bins |
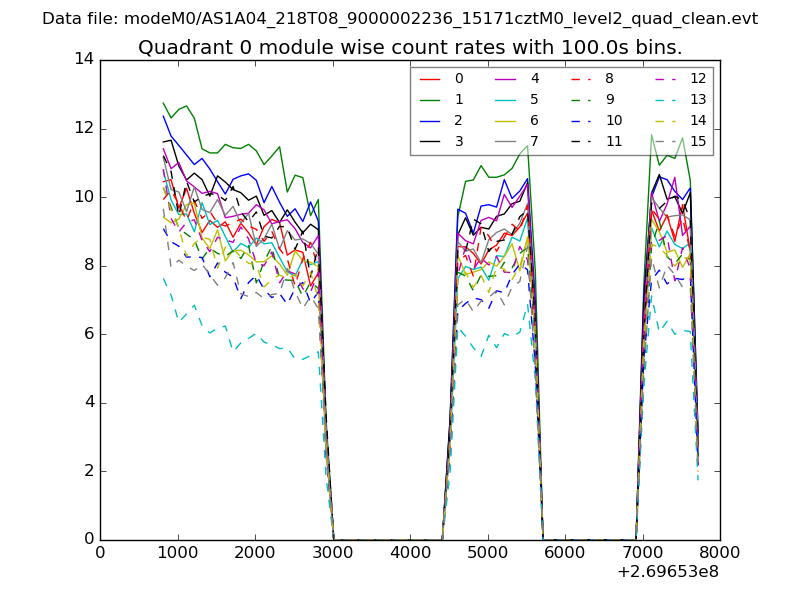 |
 |
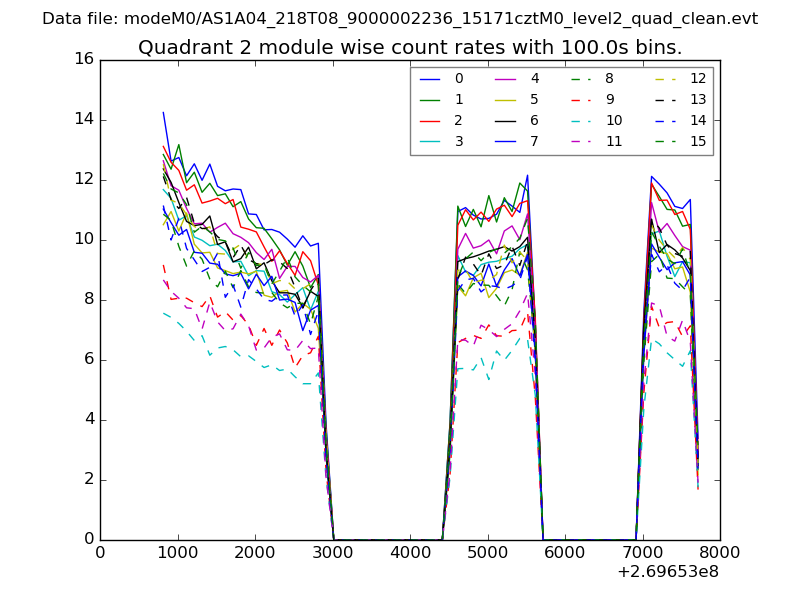
| Module-wise count rates for Quadrant B Data is divided into 100 sec bins |
 |
 |
| Module-wise count rates for Quadrant C Data is divided into 100 sec bins |
 |
 |
| Module-wise count rates for Quadrant D Data is divided into 100 sec bins |
 |
 |
| Parameter | Plot |
|---|---|
| CZT HV Monitor | 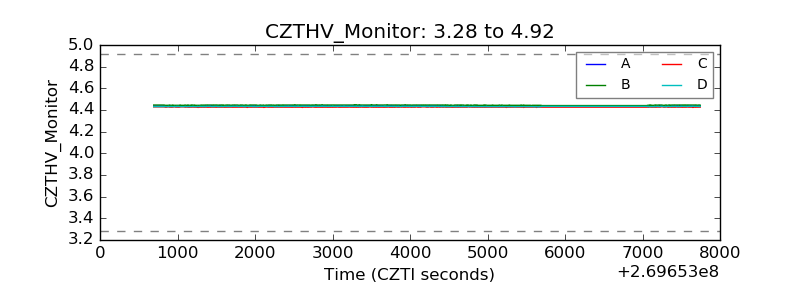 |
| D_VDD | 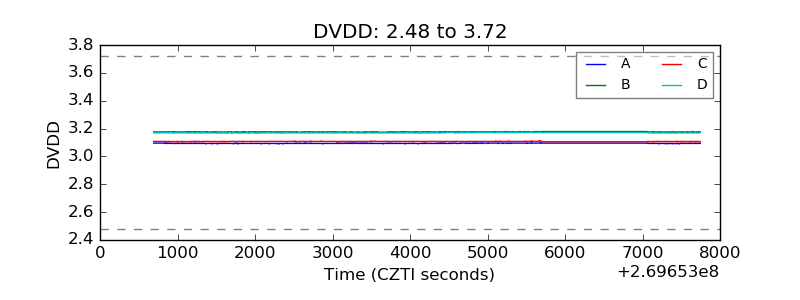 |
| Temperature 1 | 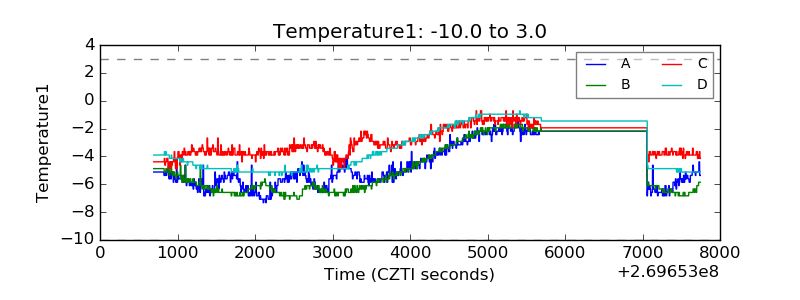 |
| Veto HV Monitor | 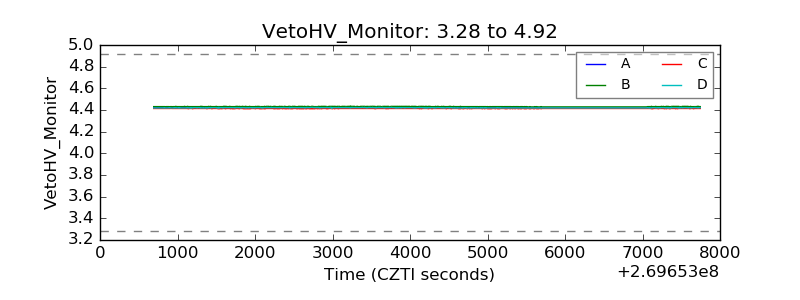 |
| Veto LLD | 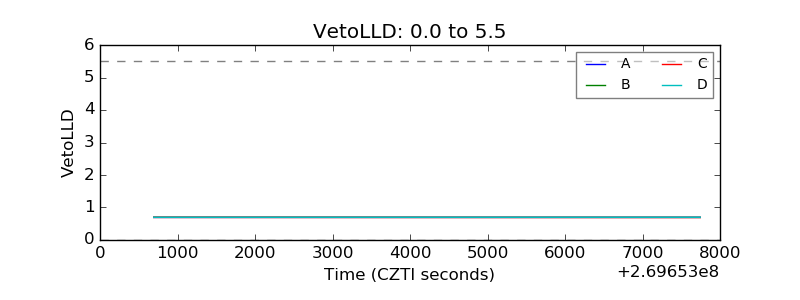 |
| Alpha Counter | 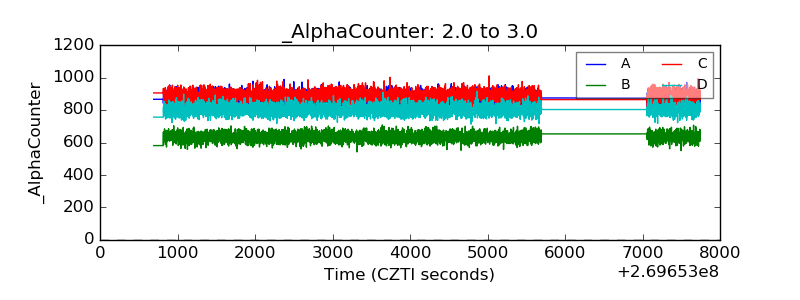 |
| _CPM_Rate | 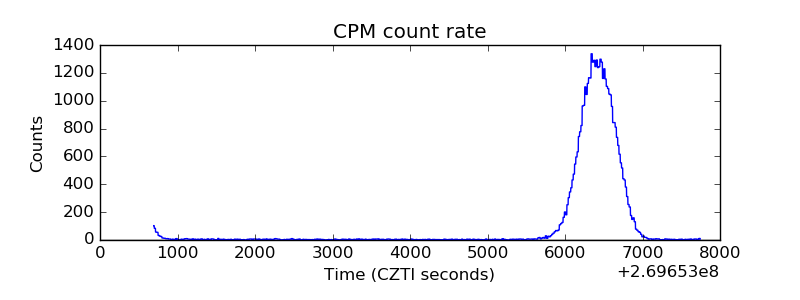 |
| CZT Counter | 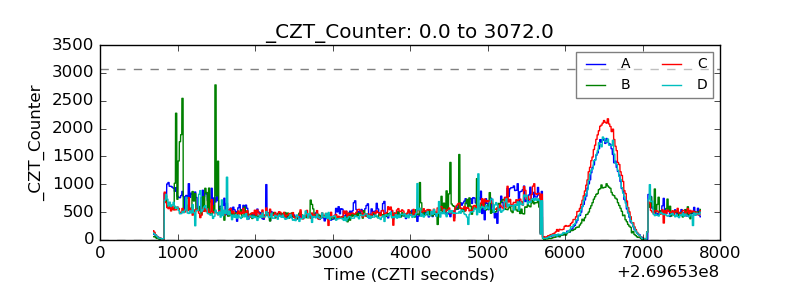 |
| +2.5 Volts monitor |  |
| +5 Volts monitor | 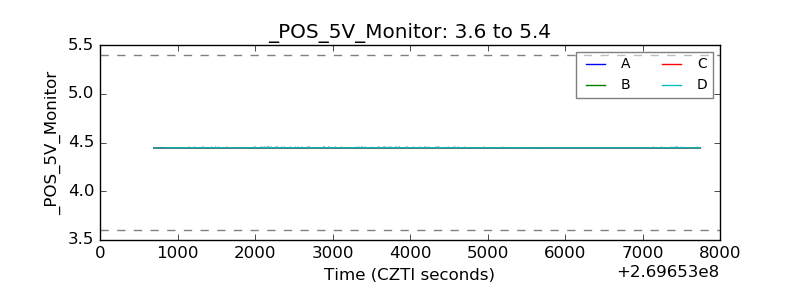 |
| _ROLL_ROT | 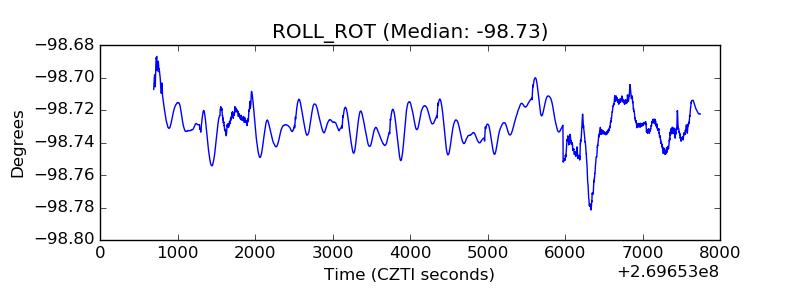 |
| _Roll_DEC | 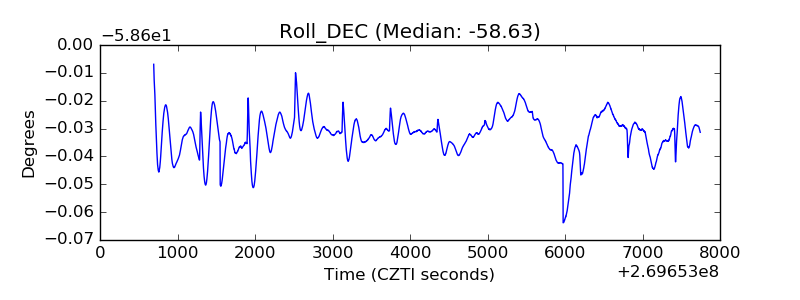 |
| _Roll_RA | 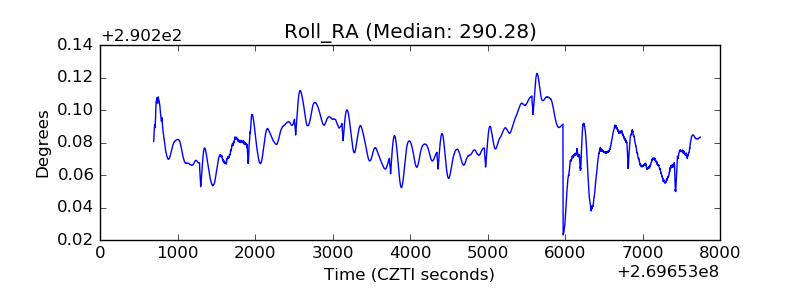 |
| Veto Counter | 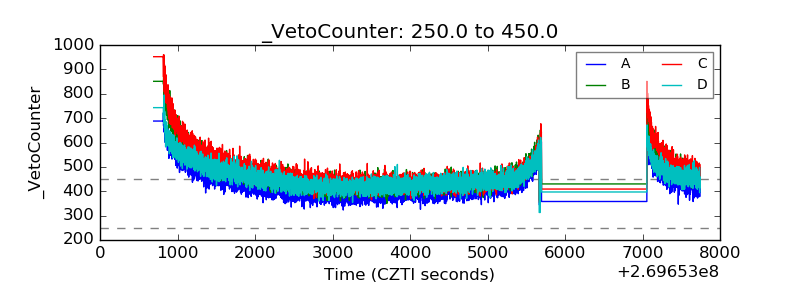 |