| Param | Original file | Final file |
|---|---|---|
| Filename | modeM0/AS1G08_035T01_9000002234cztM0_level2.fits | modeM0/AS1G08_035T01_9000002234cztM0_level2_quad_clean.evt |
| Size (bytes) | 166,201,920 | 148,628,160 |
| Size | 158.5 MB | 141.7 MB |
| Events in quadrant A | 999,238 | 851,809 |
| Events in quadrant B | 963,882 | 843,923 |
| Events in quadrant C | 990,196 | 823,023 |
| Events in quadrant D | 856,974 | 758,487 |
| Mode M0 | |||
|---|---|---|---|
| Quadrant | BADHDUFLAG | Total packets | Discarded packets |
| A | 0 | 43295 | 0 |
| B | 0 | 39662 | 0 |
| C | 0 | 39459 | 0 |
| D | 0 | 39336 | 0 |
| Mode SS | |||
|---|---|---|---|
| Quadrant | BADHDUFLAG | Total packets | Discarded packets |
| A | 0 | 368 | 0 |
| B | 0 | 368 | 0 |
| C | 0 | 368 | 0 |
| D | 0 | 368 | 0 |
| Mode M9 | |||
|---|---|---|---|
| Quadrant | BADHDUFLAG | Total packets | Discarded packets |
| A | 0 | 31 | 0 |
| B | 0 | 31 | 0 |
| C | 0 | 31 | 0 |
| D | 0 | 31 | 0 |
| Quadrant | Total seconds | Saturated seconds | Saturation percentage |
|---|---|---|---|
| A | 17729 | 221 | 1.246545% |
| B | 17729 | 376 | 2.120819% |
| C | 17729 | 151 | 0.851712% |
| D | 17729 | 331 | 1.866998% |
Noise dominated data is calculated using 1-second bins in cleaned event files. If a bin has >2000 counts, and if more than 50% of those come from <1% of pixels, then it is considered to be noise-dominated and hence unusable.
| Quadrant | # 1 sec bins | Bins with >0 counts | Bins with >2000 counts | High rate bins dominated by noise | Noise dominated (total time) | Noise dominated (detector-on time) | Marked lightcurve |
|---|---|---|---|---|---|---|---|
| A | 21070 | 17727 | 0 | 0 | 0.00% | 0.00% | 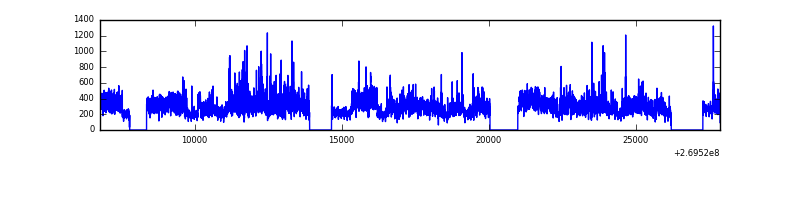 |
| B | 21070 | 17704 | 0 | 0 | 0.00% | 0.00% |  |
| C | 21070 | 17728 | 0 | 0 | 0.00% | 0.00% |  |
| D | 21070 | 17727 | 0 | 0 | 0.00% | 0.00% | 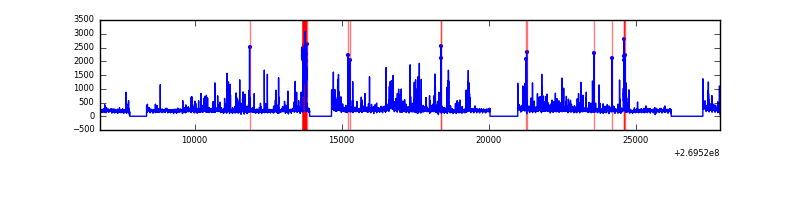 |
Top three noisy pixels from each quadrant. If the there are fewer than three noisy pixels in the level2.evt file, extra rows are filled as -1
| Pixel properties | Quadrant properties | ||||||
|---|---|---|---|---|---|---|---|
| Quadrant | DetID | PixID | Counts | Sigma | Mean | Median | Sigma |
| A | 0 | 29 | 1014 | 11.5 | 260 | 243 | 67.0 |
| A | 0 | 30 | 796 | 8.25 | 260 | 243 | 67.0 |
| A | 7 | 110 | 781 | 8.03 | 260 | 243 | 67.0 |
| B | 2 | 9 | 856 | 11.5 | 254 | 242 | 53.4 |
| B | 5 | 128 | 687 | 8.33 | 254 | 242 | 53.4 |
| B | 3 | 17 | 659 | 7.81 | 254 | 242 | 53.4 |
| C | 7 | 111 | 709 | 6.8 | 261 | 243 | 68.5 |
| C | 12 | 241 | 704 | 6.73 | 261 | 243 | 68.5 |
| C | 2 | 191 | 676 | 6.32 | 261 | 243 | 68.5 |
| D | 6 | 231 | 644 | 6.22 | 245 | 223 | 67.7 |
| D | 15 | 46 | 619 | 5.85 | 245 | 223 | 67.7 |
| D | 6 | 67 | 616 | 5.81 | 245 | 223 | 67.7 |
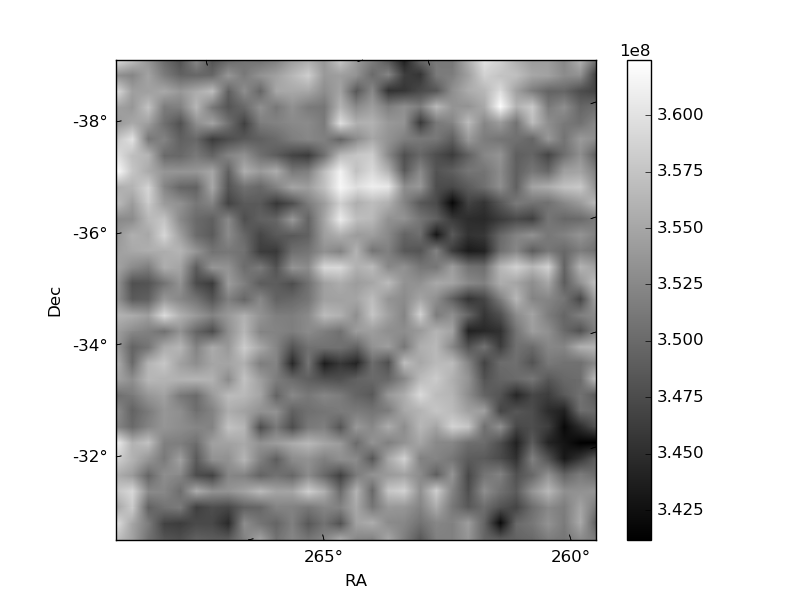
Histogram calculated using DETX and DETY for each event in the final _common_clean file
| Quadrant A | 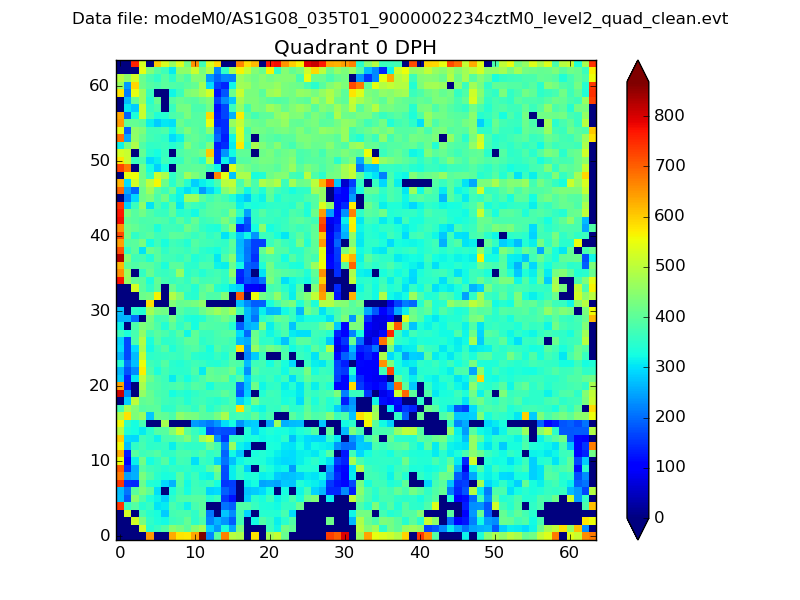 |
 |
Quadrant B |
|---|---|---|---|
| Quadrant D |  |
 |
Quadrant C |
| Plot type | Count rate plots | Images |
|---|---|---|
| Comparison with Poisson distribution Blue bars denote a histogram of data divided into 1 sec bins. Red curve is a Poisson curve with rate = median count rate of data. |
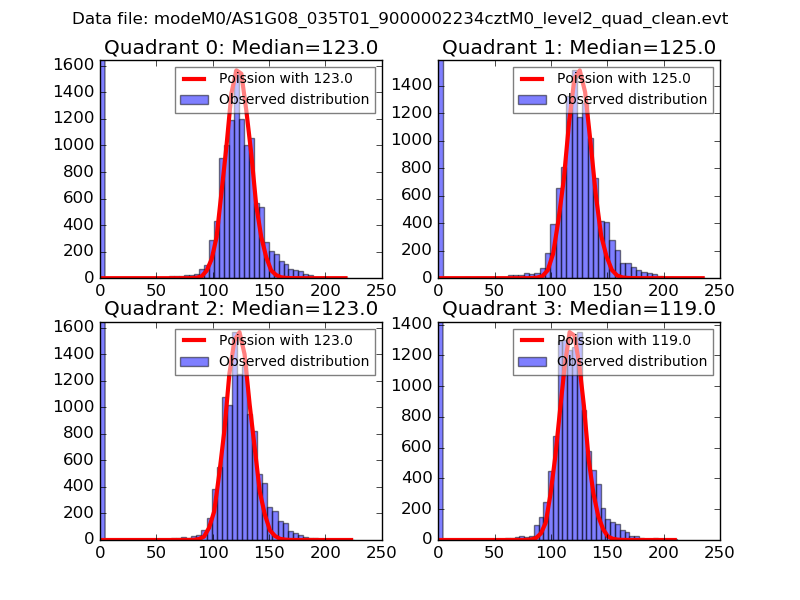 |
 |
| Quadrant-wise count rates Data is divided into 100 sec bins |
 |
|
| Module-wise count rates for Quadrant A Data is divided into 100 sec bins |
 |
 |
| Module-wise count rates for Quadrant B Data is divided into 100 sec bins |
 |
 |
| Module-wise count rates for Quadrant C Data is divided into 100 sec bins |
 |
 |
| Module-wise count rates for Quadrant D Data is divided into 100 sec bins |
 |
 |
| Parameter | Plot |
|---|---|
| CZT HV Monitor |  |
| D_VDD |  |
| Temperature 1 | 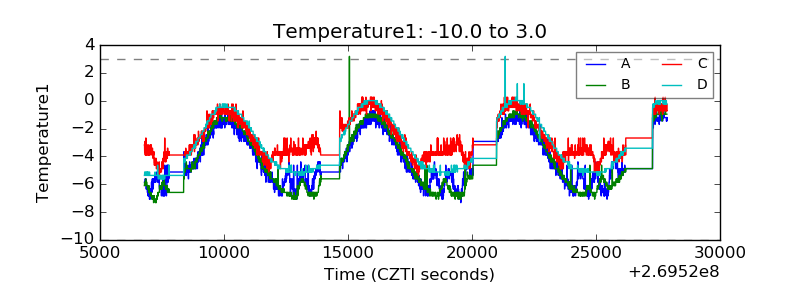 |
| Veto HV Monitor | 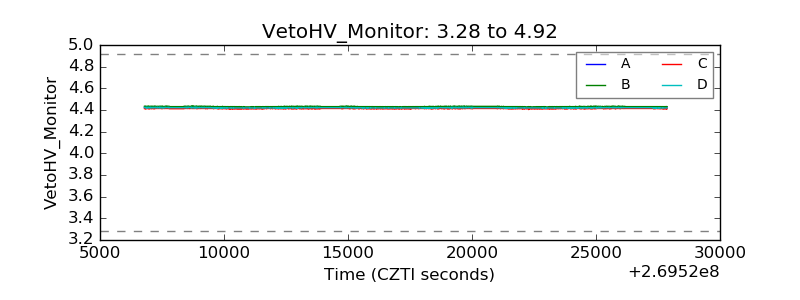 |
| Veto LLD |  |
| Alpha Counter | 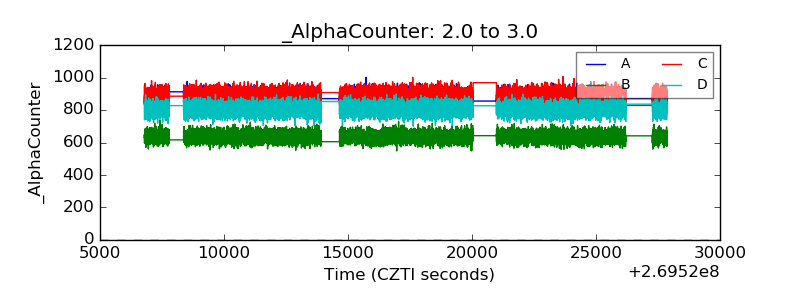 |
| _CPM_Rate |  |
| CZT Counter | 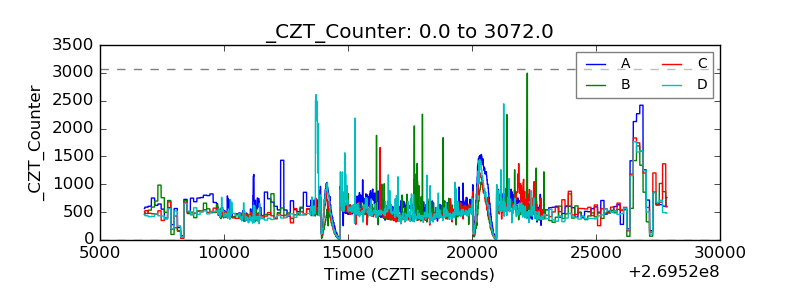 |
| +2.5 Volts monitor |  |
| +5 Volts monitor |  |
| _ROLL_ROT | 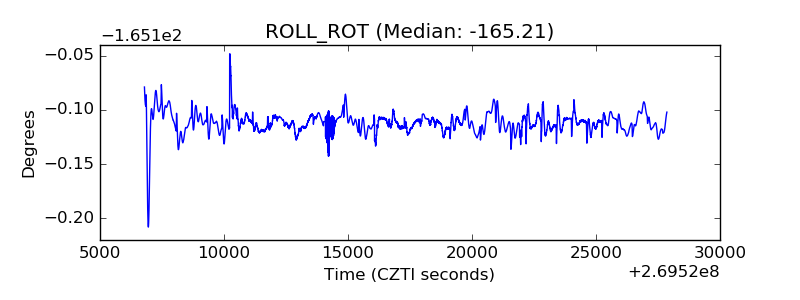 |
| _Roll_DEC |  |
| _Roll_RA |  |
| Veto Counter | 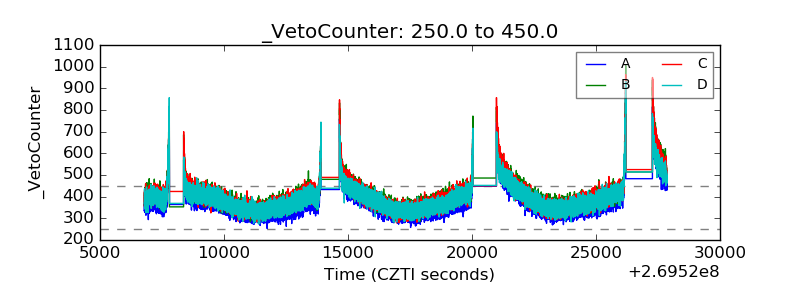 |