| Param | Original file | Final file |
|---|---|---|
| Filename | modeM0/AS1G08_035T01_9000002234_15148cztM0_level2.evt | modeM0/AS1G08_035T01_9000002234_15148cztM0_level2_quad_clean.evt |
| Size (bytes) | 588,902,400 | 99,705,600 |
| Size | 561.6 MB | 95.1 MB |
| Events in quadrant A | 4,934,867 | 616,502 |
| Events in quadrant B | 4,210,071 | 624,976 |
| Events in quadrant C | 3,934,798 | 624,172 |
| Events in quadrant D | 4,209,645 | 594,624 |
| Mode M0 | |||
|---|---|---|---|
| Quadrant | BADHDUFLAG | Total packets | Discarded packets |
| A | 0 | 20181 | 3 |
| B | 0 | 17510 | 2 |
| C | 0 | 16589 | 2 |
| D | 0 | 17840 | 2 |
| Mode SS | |||
|---|---|---|---|
| Quadrant | BADHDUFLAG | Total packets | Discarded packets |
| A | 0 | 168 | 0 |
| B | 0 | 168 | 0 |
| C | 0 | 168 | 0 |
| D | 0 | 168 | 0 |
| Mode M9 | |||
|---|---|---|---|
| Quadrant | BADHDUFLAG | Total packets | Discarded packets |
| A | 0 | 12 | 0 |
| B | 0 | 12 | 0 |
| C | 0 | 12 | 0 |
| D | 0 | 12 | 0 |
| Quadrant | Total seconds | Saturated seconds | Saturation percentage |
|---|---|---|---|
| A | 8033 | 127 | 1.580978% |
| B | 8033 | 189 | 2.352795% |
| C | 8033 | 77 | 0.958546% |
| D | 8033 | 209 | 2.601768% |
Noise dominated data is calculated using 1-second bins in cleaned event files. If a bin has >2000 counts, and if more than 50% of those come from <1% of pixels, then it is considered to be noise-dominated and hence unusable.
| Quadrant | # 1 sec bins | Bins with >0 counts | Bins with >2000 counts | High rate bins dominated by noise | Noise dominated (total time) | Noise dominated (detector-on time) | Marked lightcurve |
|---|---|---|---|---|---|---|---|
| A | 9354 | 8034 | 0 | 0 | 0.00% | 0.00% | 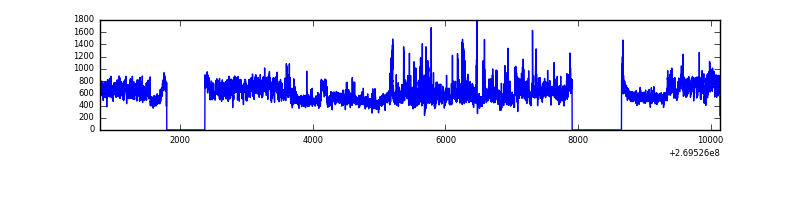 |
| B | 9354 | 8034 | 38 | 38 | 0.41% | 0.47% | 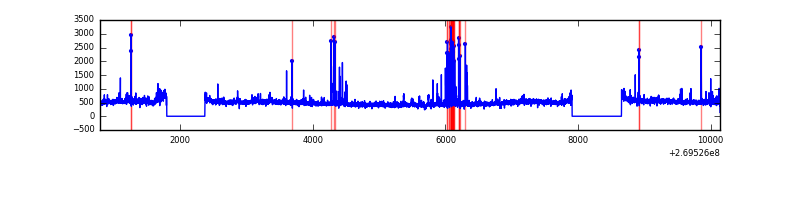 |
| C | 9354 | 8035 | 0 | 0 | 0.00% | 0.00% | 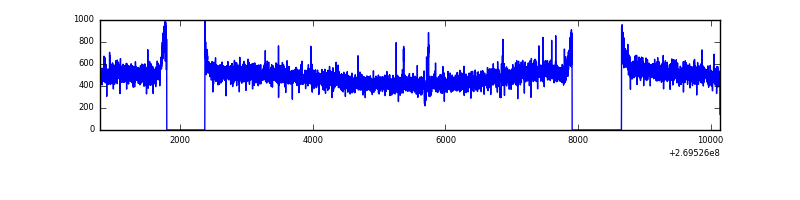 |
| D | 9354 | 8034 | 100 | 100 | 1.07% | 1.24% | 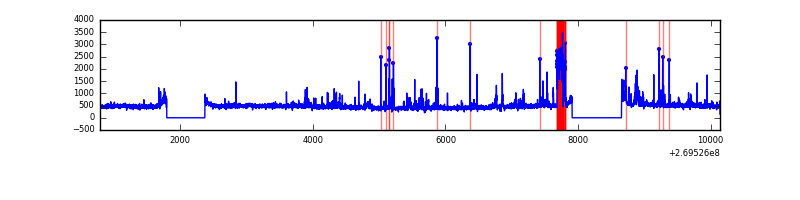 |
Top three noisy pixels from each quadrant. If the there are fewer than three noisy pixels in the level2.evt file, extra rows are filled as -1
| Pixel properties | Quadrant properties | ||||||
|---|---|---|---|---|---|---|---|
| Quadrant | DetID | PixID | Counts | Sigma | Mean | Median | Sigma |
| A | 15 | 239 | 1085057 | 5383.21 | 985 | 963 | 201.4 |
| A | 12 | 189 | 37600 | 181.93 | 985 | 963 | 201.4 |
| A | 11 | 29 | 13352 | 61.52 | 985 | 963 | 201.4 |
| B | 3 | 64 | 266128 | 1391.82 | 982 | 957 | 190.5 |
| B | 4 | 48 | 24509 | 123.62 | 982 | 957 | 190.5 |
| B | 12 | 111 | 22318 | 112.12 | 982 | 957 | 190.5 |
| C | 3 | 233 | 191509 | 857.81 | 958 | 961 | 222.1 |
| C | 13 | 61 | 7093 | 27.61 | 958 | 961 | 222.1 |
| C | 0 | 207 | 4474 | 15.81 | 958 | 961 | 222.1 |
| D | 2 | 33 | 339003 | 1451.14 | 954 | 926 | 233.0 |
| D | 10 | 70 | 66738 | 282.49 | 954 | 926 | 233.0 |
| D | 2 | 16 | 65450 | 276.96 | 954 | 926 | 233.0 |
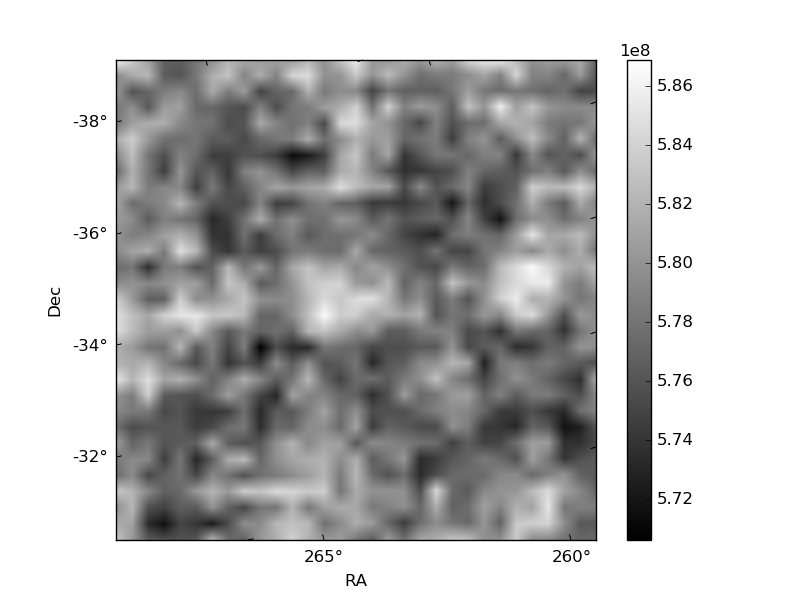
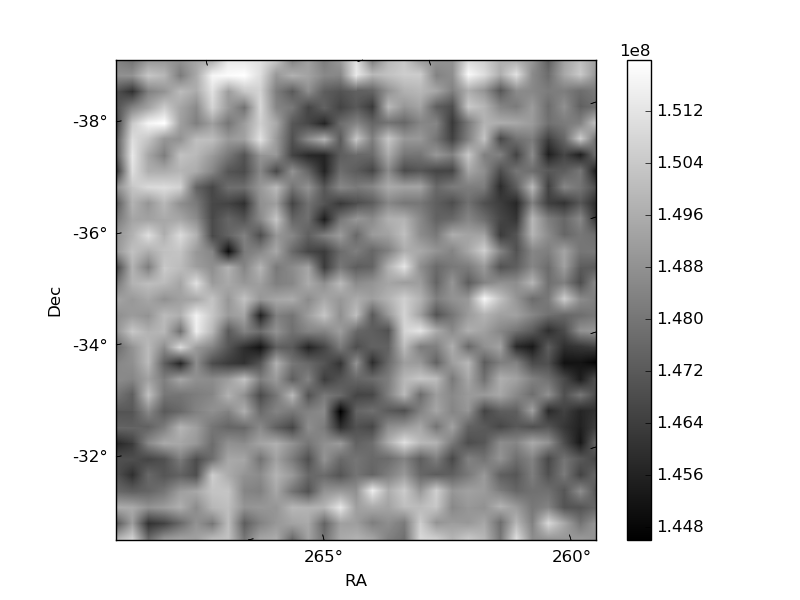
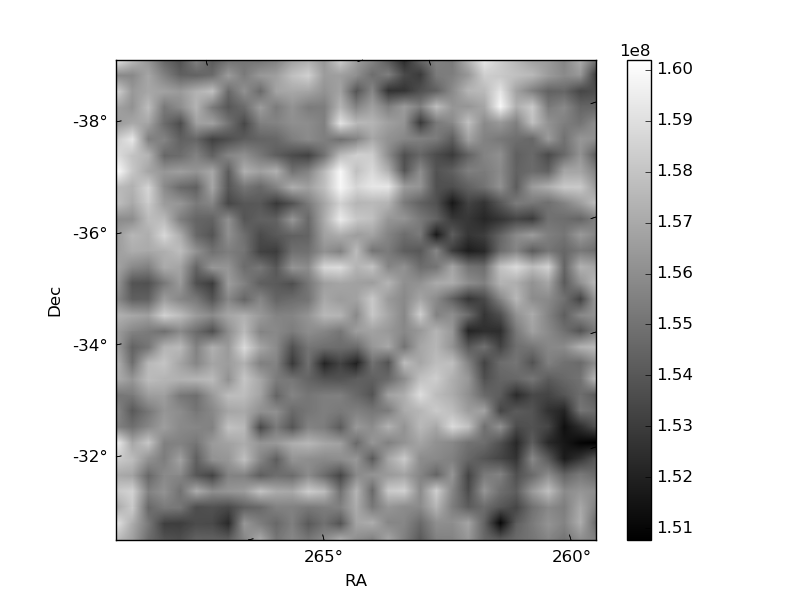
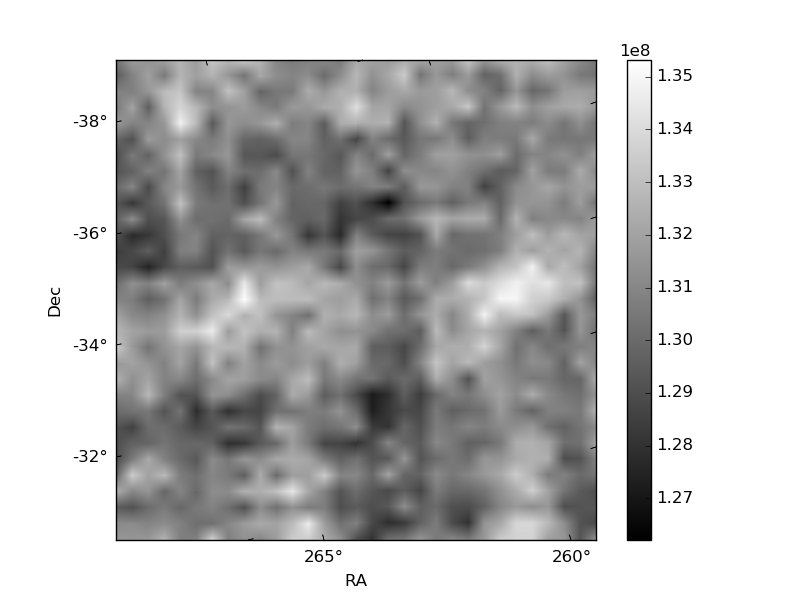
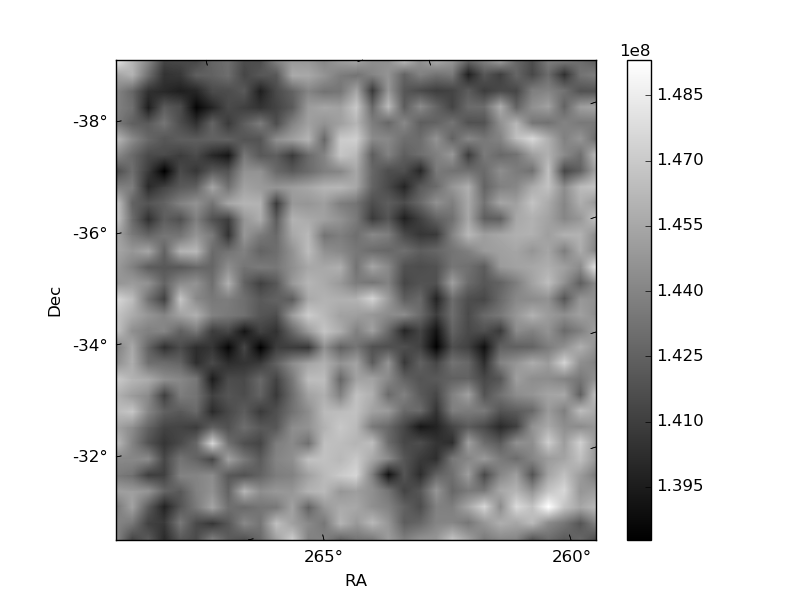
Histogram calculated using DETX and DETY for each event in the final _common_clean file
| Quadrant A | 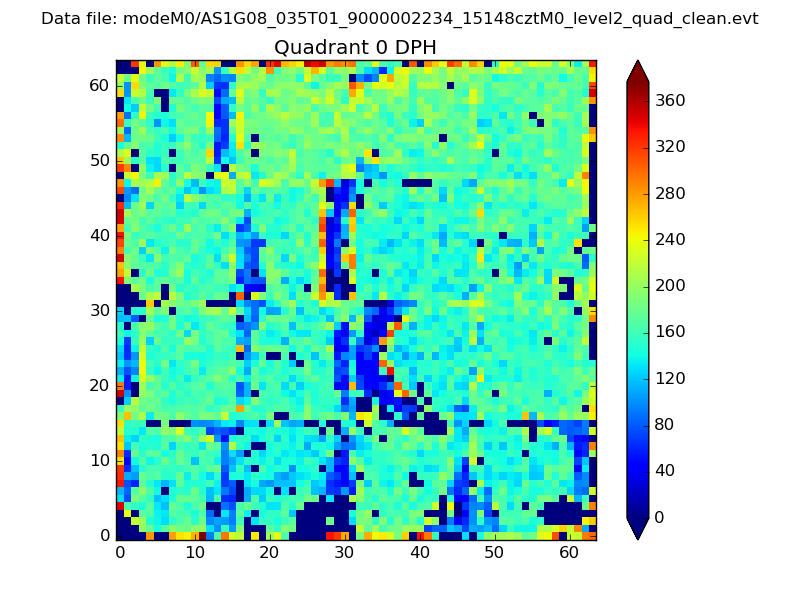 |
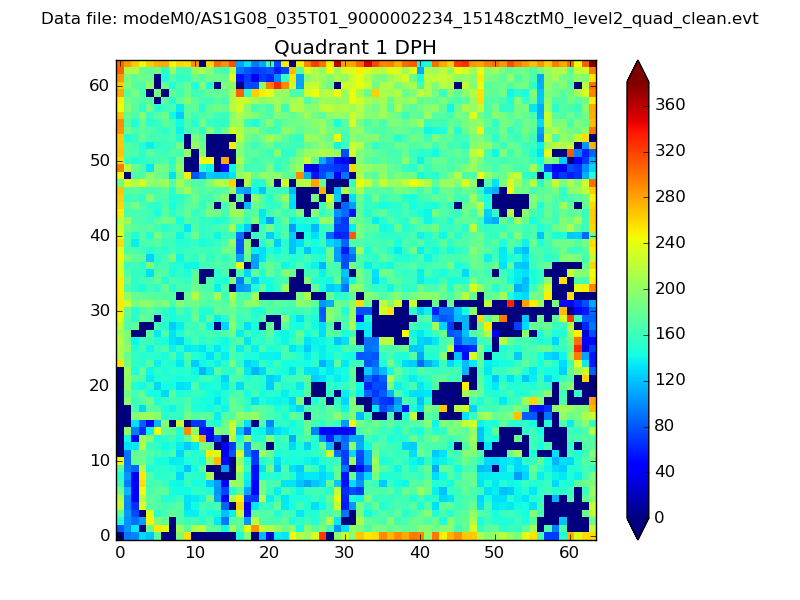 |
Quadrant B |
|---|---|---|---|
| Quadrant D | 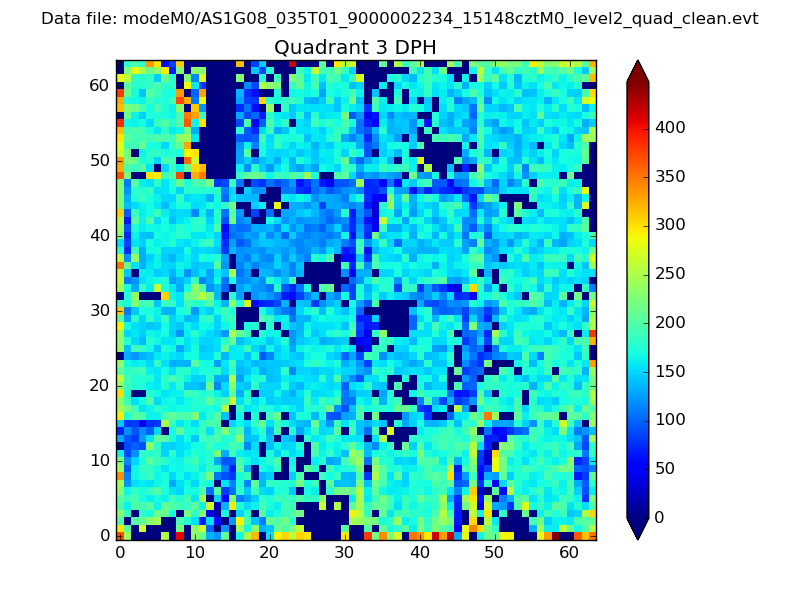 |
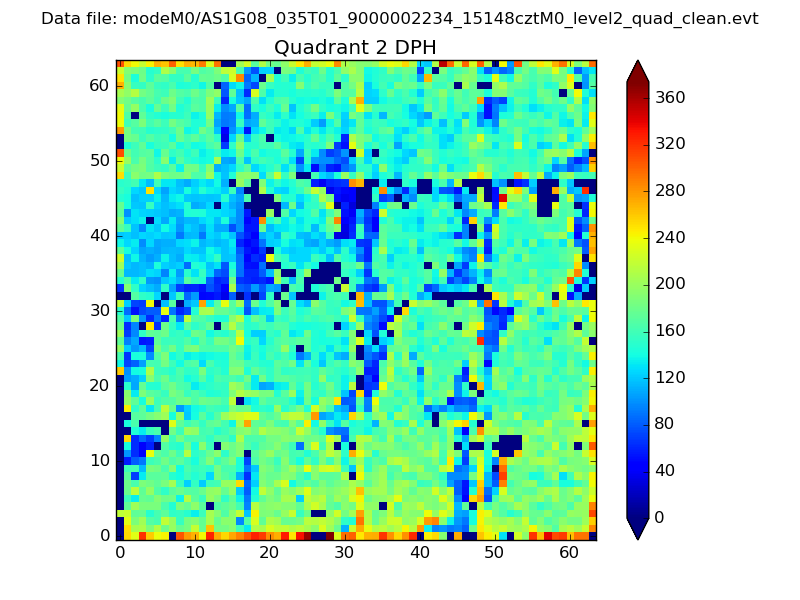 |
Quadrant C |
| Plot type | Count rate plots | Images |
|---|---|---|
| Comparison with Poisson distribution Blue bars denote a histogram of data divided into 1 sec bins. Red curve is a Poisson curve with rate = median count rate of data. |
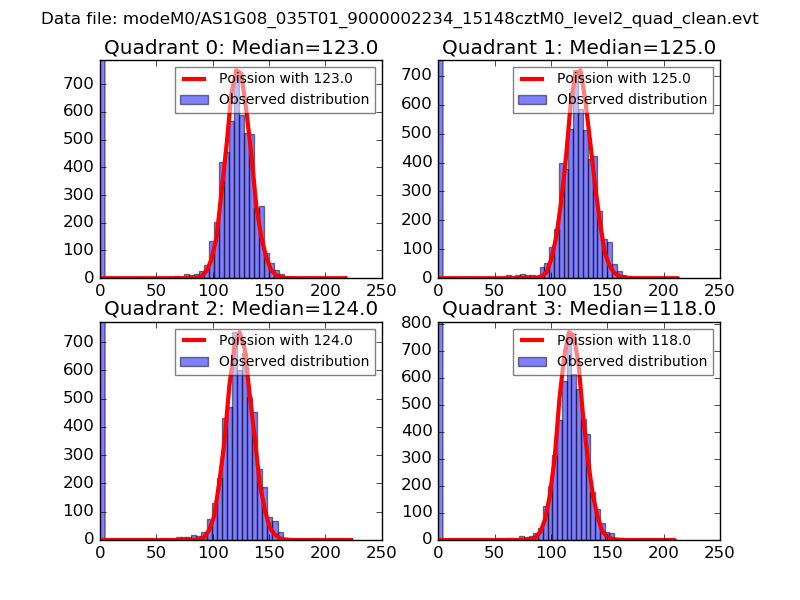 |
 |
| Quadrant-wise count rates Data is divided into 100 sec bins |
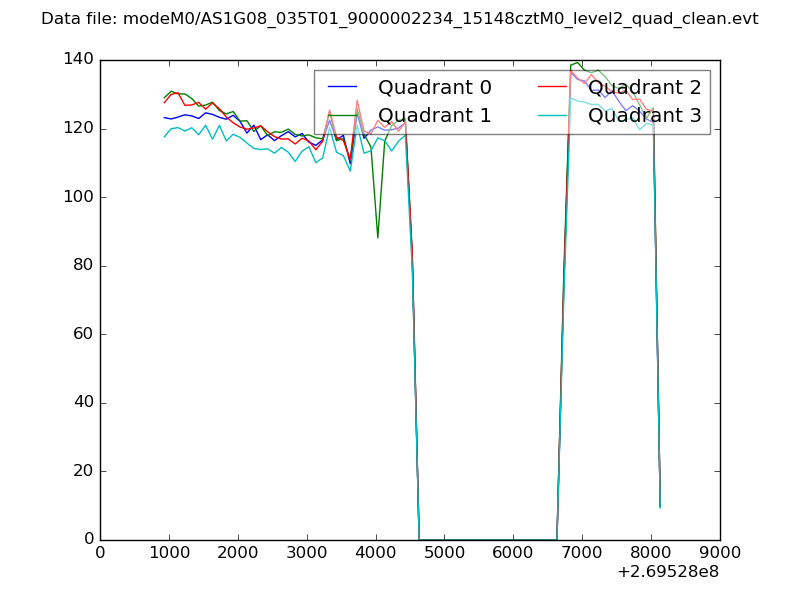 |
|
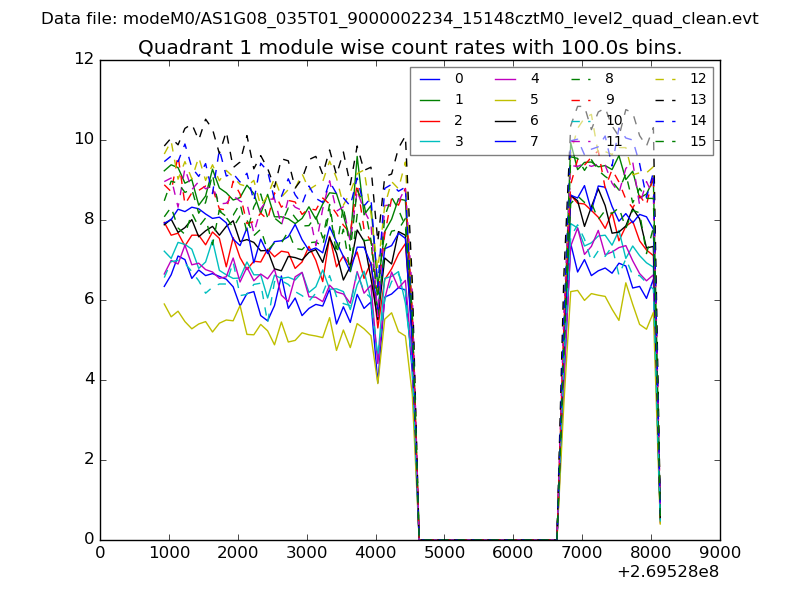
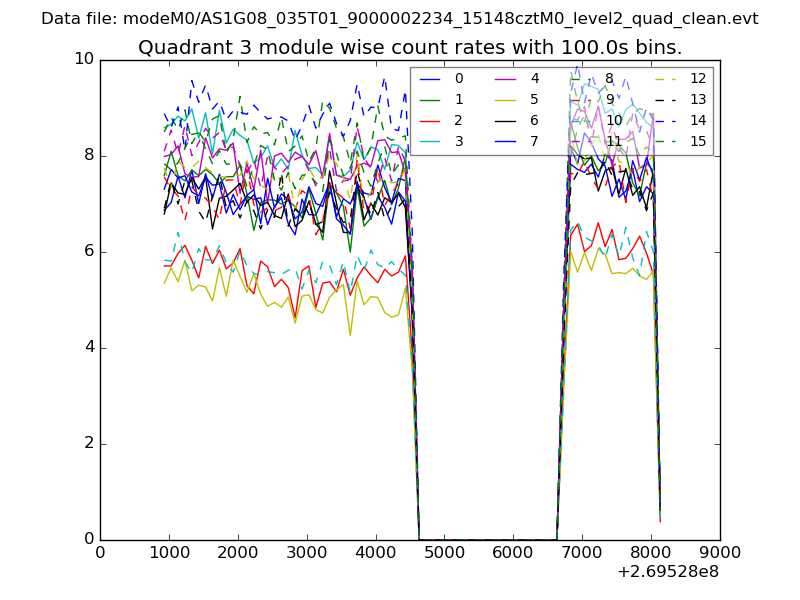
| Module-wise count rates for Quadrant A Data is divided into 100 sec bins |
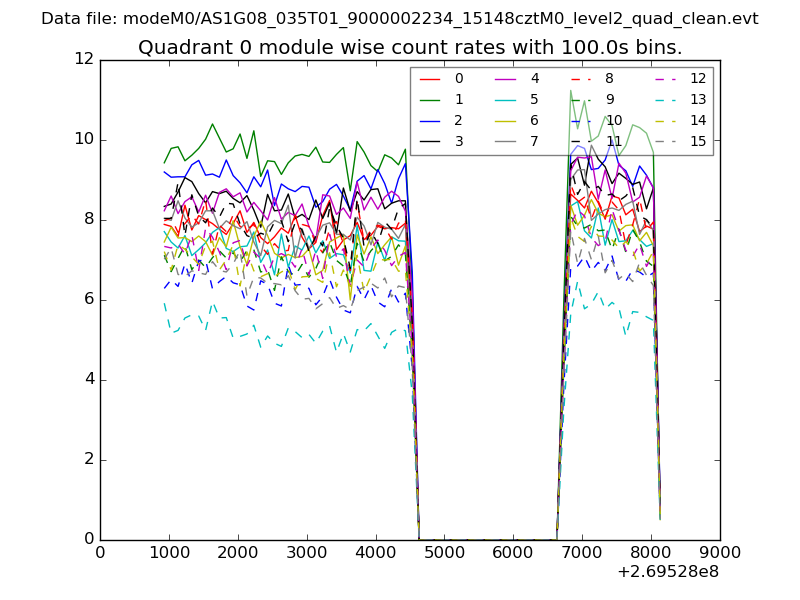 |
 |
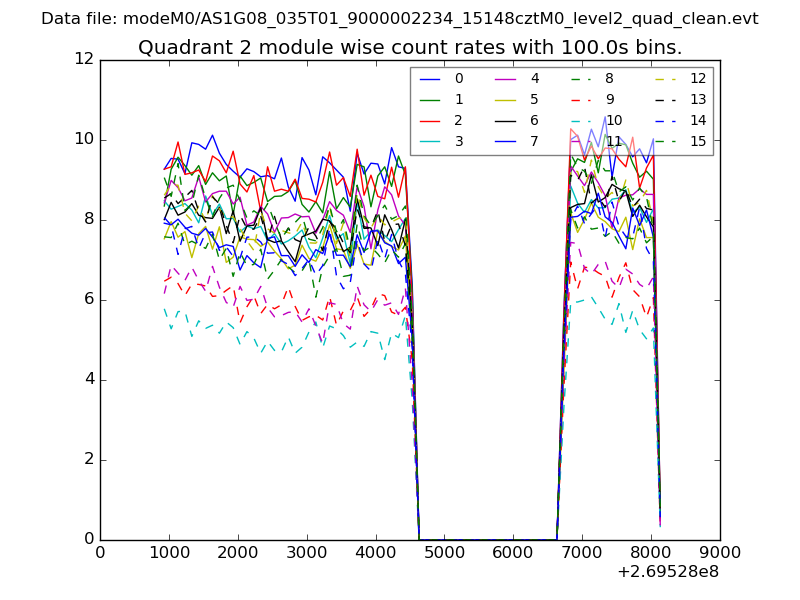
| Module-wise count rates for Quadrant B Data is divided into 100 sec bins |
 |
 |
| Module-wise count rates for Quadrant C Data is divided into 100 sec bins |
 |
 |
| Module-wise count rates for Quadrant D Data is divided into 100 sec bins |
 |
 |
| Parameter | Plot |
|---|---|
| CZT HV Monitor | 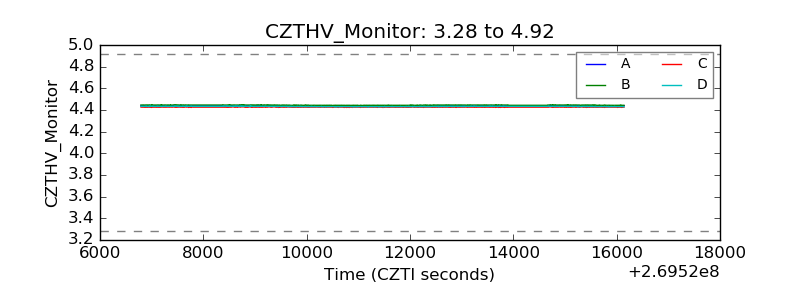 |
| D_VDD | 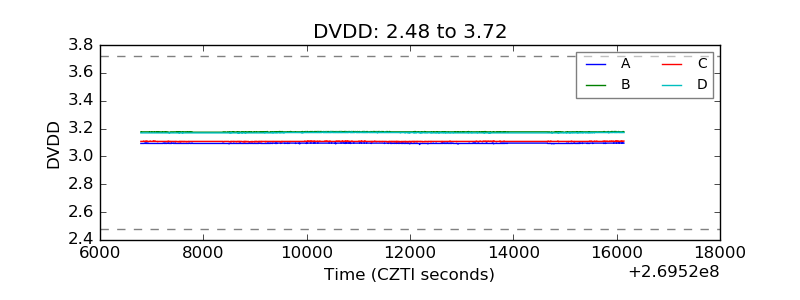 |
| Temperature 1 | 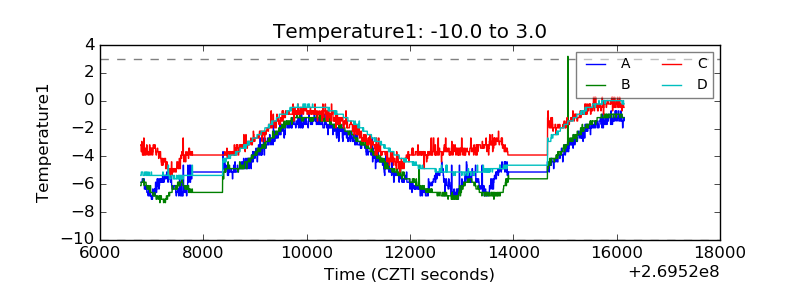 |
| Veto HV Monitor | 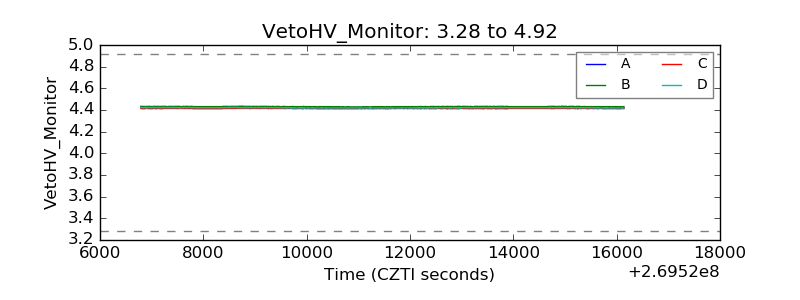 |
| Veto LLD | 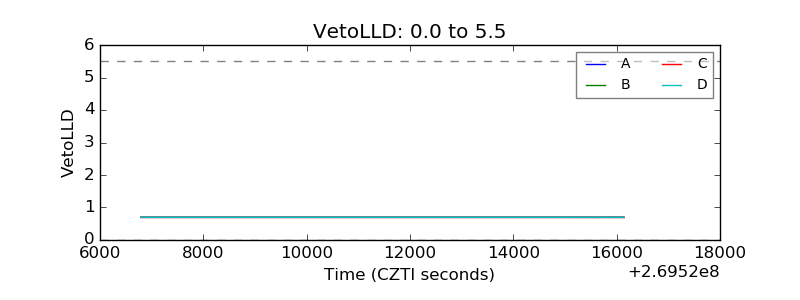 |
| Alpha Counter | 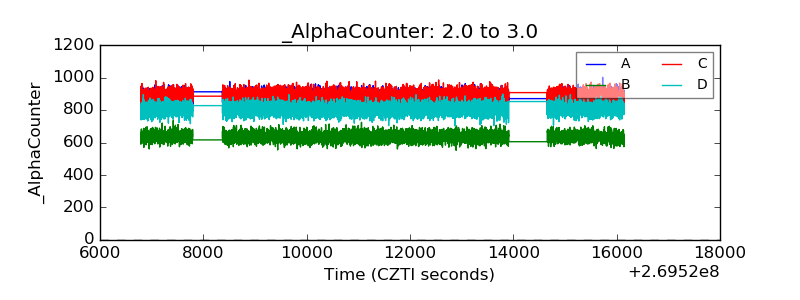 |
| _CPM_Rate | 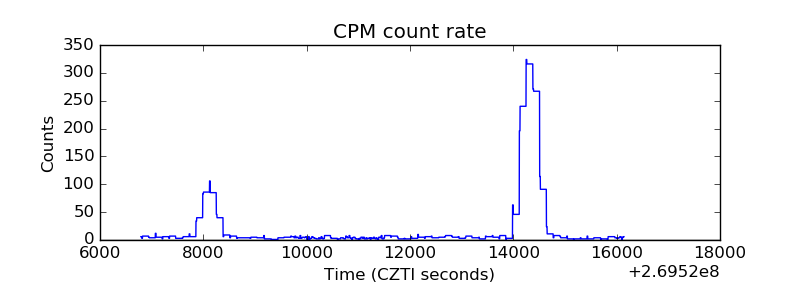 |
| CZT Counter | 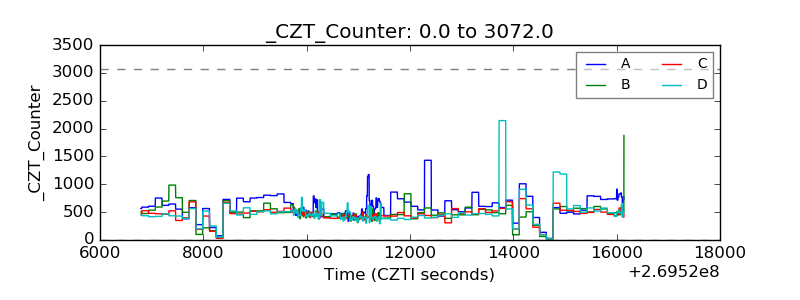 |
| +2.5 Volts monitor | 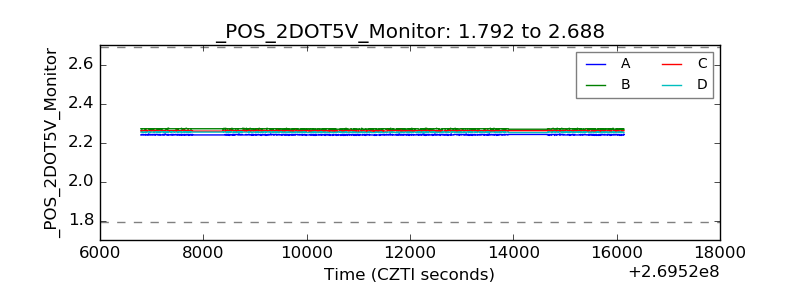 |
| +5 Volts monitor | 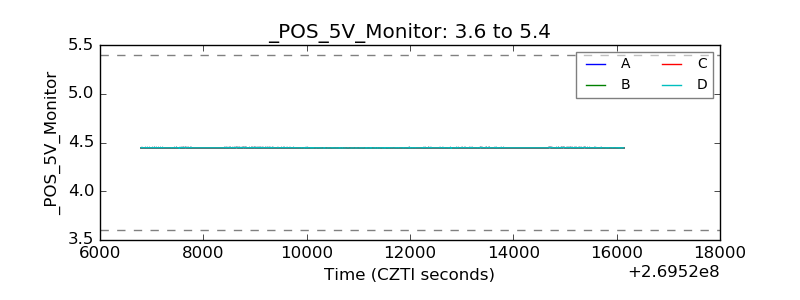 |
| _ROLL_ROT | 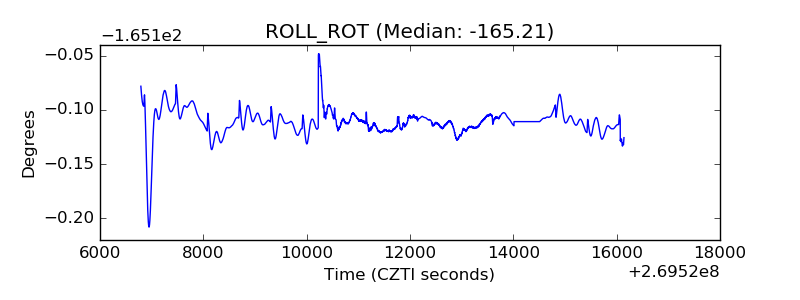 |
| _Roll_DEC | 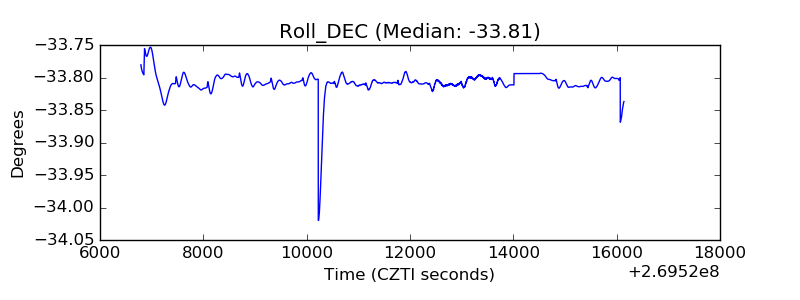 |
| _Roll_RA | 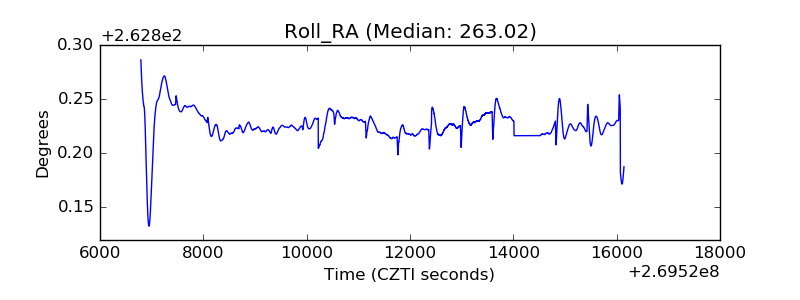 |
| Veto Counter | 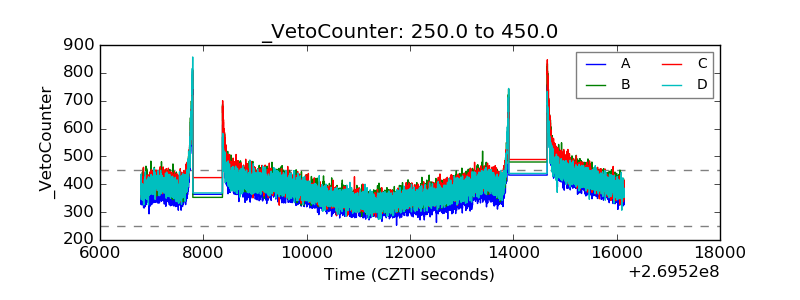 |