| Param | Original file | Final file |
|---|---|---|
| Filename | modeM0/AS1G08_035T01_9000002234_15149cztM0_level2.evt | modeM0/AS1G08_035T01_9000002234_15149cztM0_level2_quad_clean.evt |
| Size (bytes) | 510,854,400 | 98,625,600 |
| Size | 487.2 MB | 94.1 MB |
| Events in quadrant A | 4,021,719 | 634,223 |
| Events in quadrant B | 3,734,306 | 641,746 |
| Events in quadrant C | 3,588,235 | 635,332 |
| Events in quadrant D | 3,670,360 | 606,368 |
| Mode M0 | |||
|---|---|---|---|
| Quadrant | BADHDUFLAG | Total packets | Discarded packets |
| A | 0 | 16485 | 3 |
| B | 0 | 15389 | 2 |
| C | 0 | 15176 | 2 |
| D | 0 | 15298 | 2 |
| Mode SS | |||
|---|---|---|---|
| Quadrant | BADHDUFLAG | Total packets | Discarded packets |
| A | 0 | 138 | 0 |
| B | 0 | 138 | 0 |
| C | 0 | 138 | 0 |
| D | 0 | 138 | 0 |
| Mode M9 | |||
|---|---|---|---|
| Quadrant | BADHDUFLAG | Total packets | Discarded packets |
| A | 0 | 15 | 0 |
| B | 0 | 15 | 0 |
| C | 0 | 15 | 0 |
| D | 0 | 15 | 0 |
| Quadrant | Total seconds | Saturated seconds | Saturation percentage |
|---|---|---|---|
| A | 6727 | 66 | 0.981121% |
| B | 6727 | 138 | 2.051435% |
| C | 6727 | 44 | 0.654081% |
| D | 6727 | 90 | 1.337892% |
Noise dominated data is calculated using 1-second bins in cleaned event files. If a bin has >2000 counts, and if more than 50% of those come from <1% of pixels, then it is considered to be noise-dominated and hence unusable.
| Quadrant | # 1 sec bins | Bins with >0 counts | Bins with >2000 counts | High rate bins dominated by noise | Noise dominated (total time) | Noise dominated (detector-on time) | Marked lightcurve |
|---|---|---|---|---|---|---|---|
| A | 7673 | 6729 | 0 | 0 | 0.00% | 0.00% | 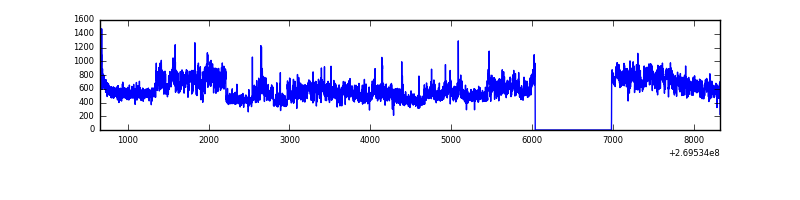 |
| B | 7673 | 6728 | 59 | 59 | 0.77% | 0.88% | 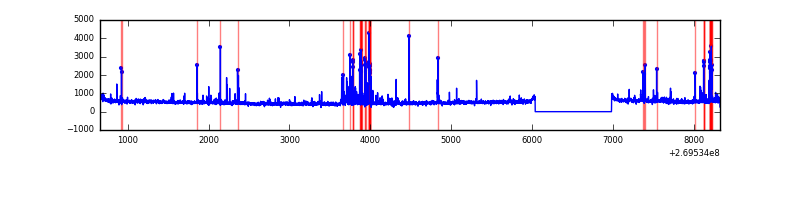 |
| C | 7673 | 6729 | 0 | 0 | 0.00% | 0.00% | 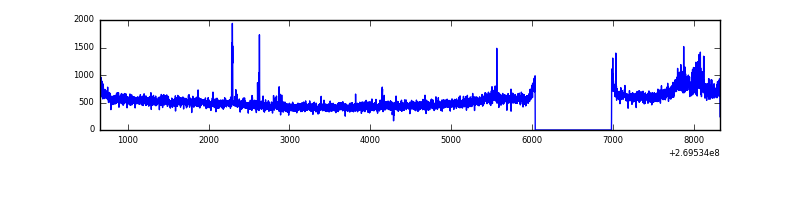 |
| D | 7673 | 6729 | 40 | 40 | 0.52% | 0.59% | 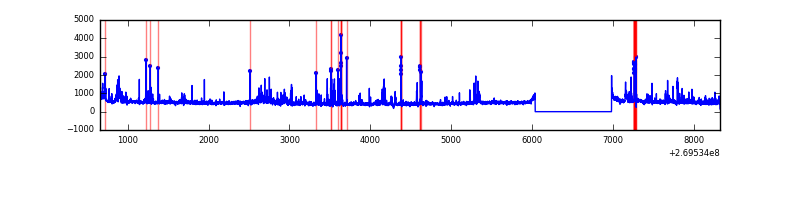 |
Top three noisy pixels from each quadrant. If the there are fewer than three noisy pixels in the level2.evt file, extra rows are filled as -1
| Pixel properties | Quadrant properties | ||||||
|---|---|---|---|---|---|---|---|
| Quadrant | DetID | PixID | Counts | Sigma | Mean | Median | Sigma |
| A | 15 | 239 | 761864 | 4524.97 | 828 | 809 | 168.2 |
| A | 12 | 189 | 57772 | 338.68 | 828 | 809 | 168.2 |
| A | 11 | 29 | 8511 | 45.79 | 828 | 809 | 168.2 |
| B | 3 | 64 | 241068 | 1518.48 | 820 | 800 | 158.2 |
| B | 0 | 229 | 101376 | 635.64 | 820 | 800 | 158.2 |
| B | 4 | 48 | 39475 | 244.42 | 820 | 800 | 158.2 |
| C | 3 | 233 | 462988 | 2512.93 | 795 | 799 | 183.9 |
| C | 14 | 234 | 17162 | 88.97 | 795 | 799 | 183.9 |
| C | 13 | 61 | 5820 | 27.3 | 795 | 799 | 183.9 |
| D | 2 | 33 | 204683 | 1040.32 | 797 | 773 | 196.0 |
| D | 2 | 16 | 199896 | 1015.9 | 797 | 773 | 196.0 |
| D | 7 | 38 | 89022 | 450.23 | 797 | 773 | 196.0 |
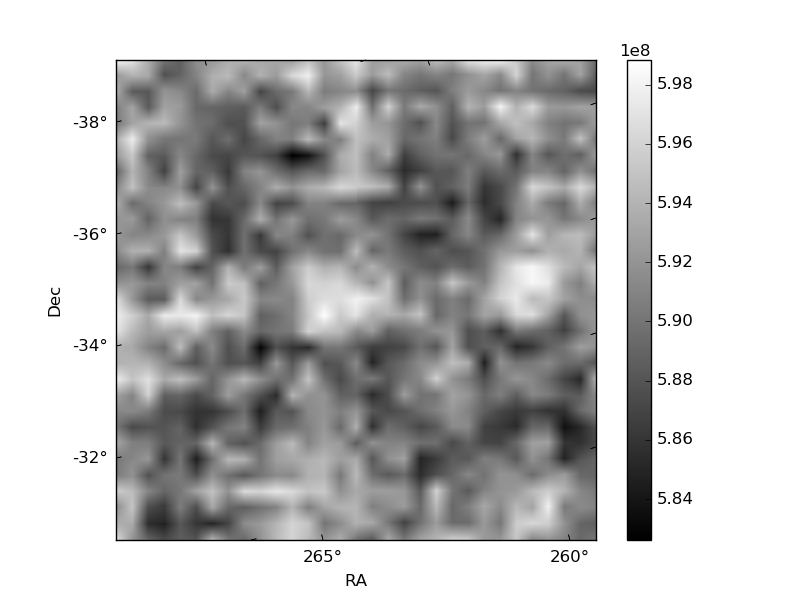
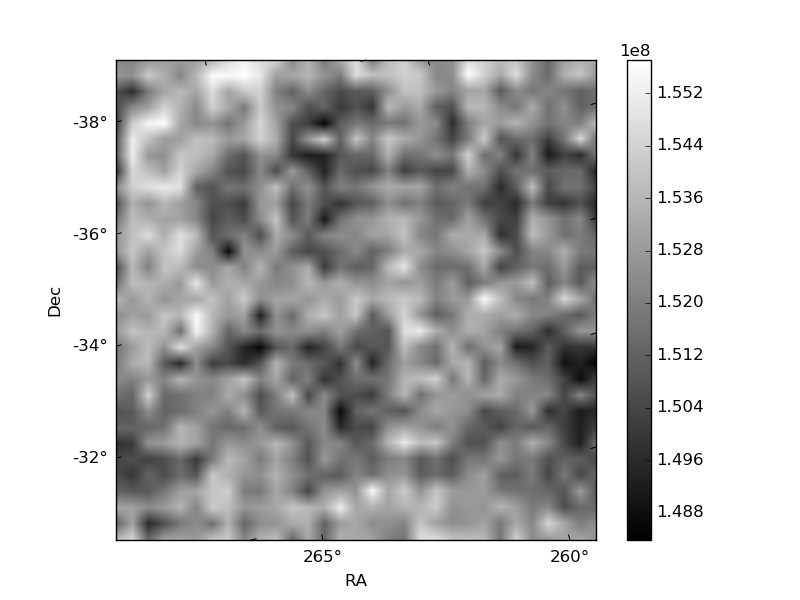
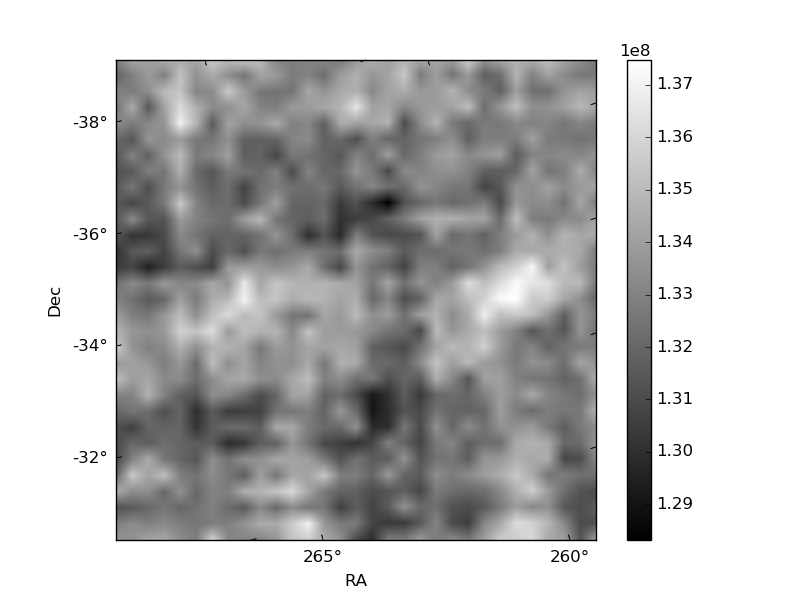
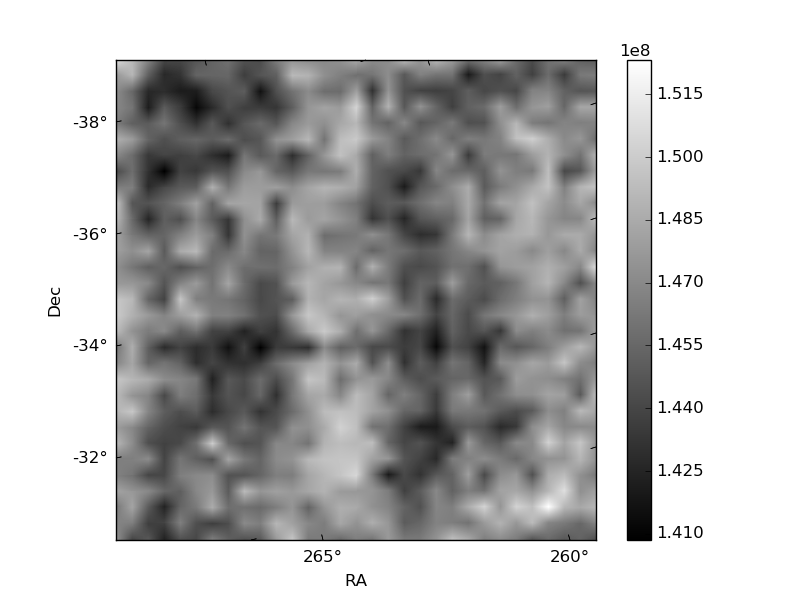
Histogram calculated using DETX and DETY for each event in the final _common_clean file
| Quadrant A | 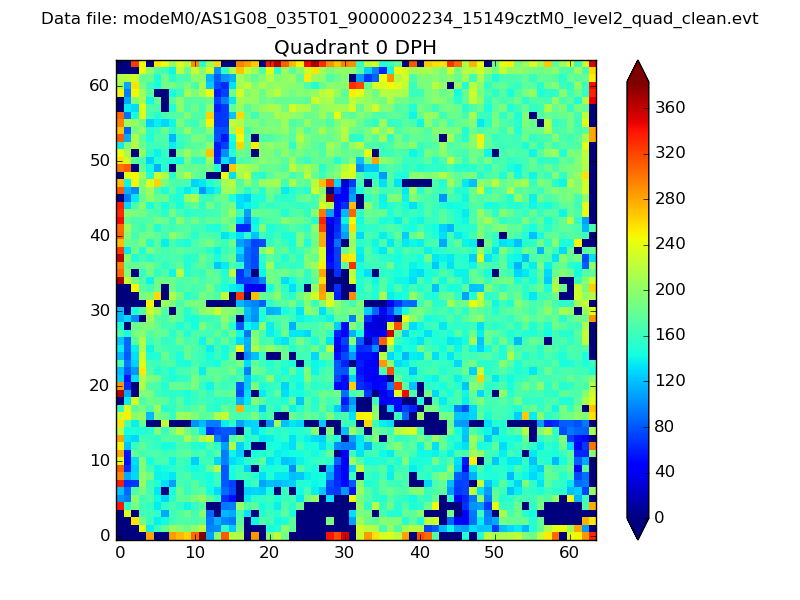 |
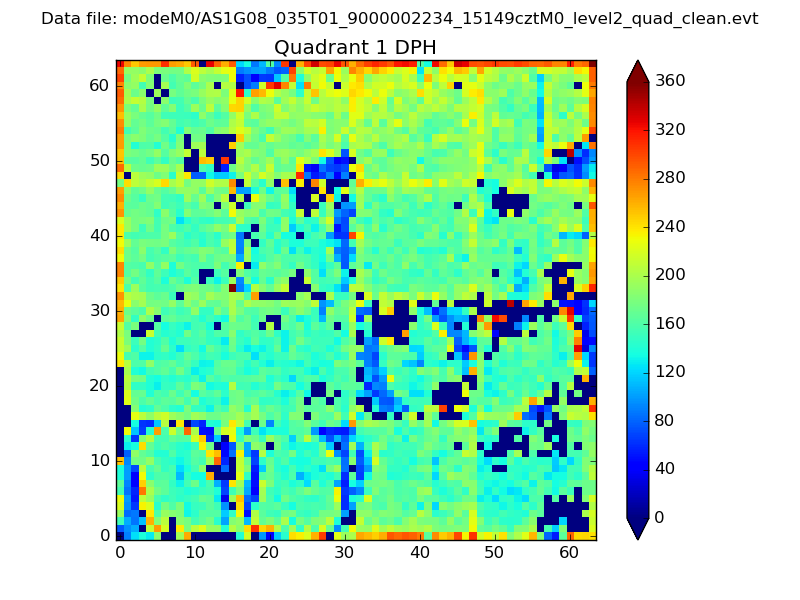 |
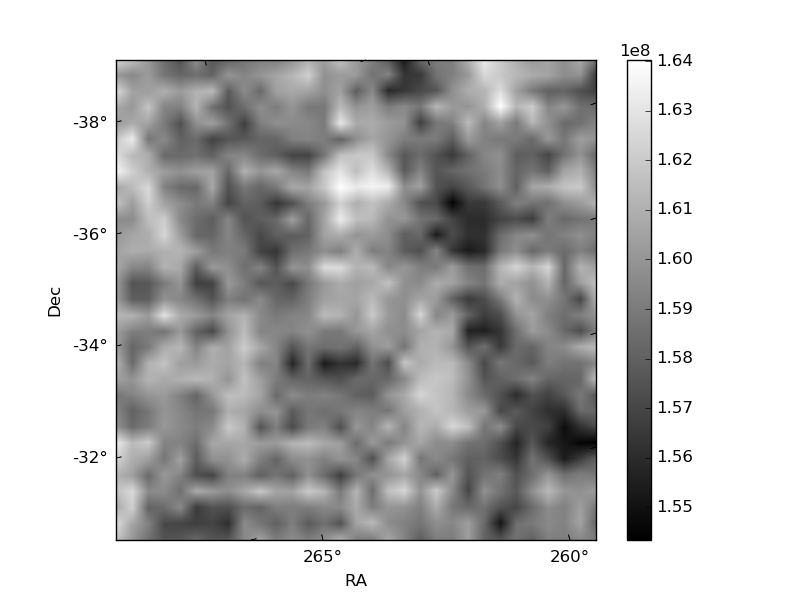
Quadrant B |
|---|---|---|---|
| Quadrant D | 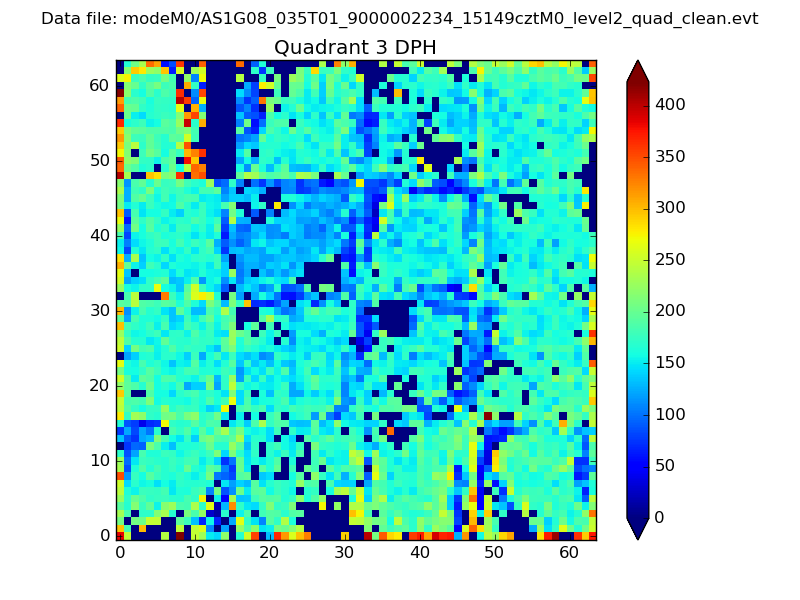 |
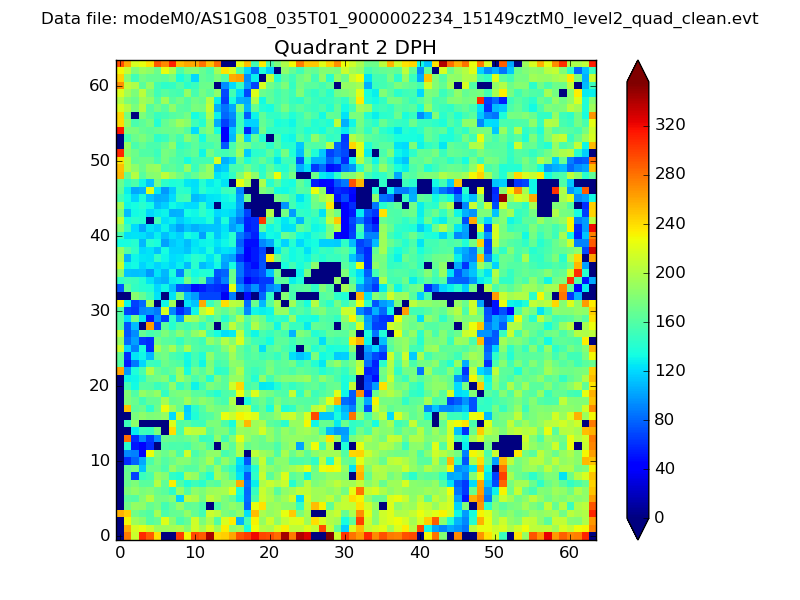 |
Quadrant C |
| Plot type | Count rate plots | Images |
|---|---|---|
| Comparison with Poisson distribution Blue bars denote a histogram of data divided into 1 sec bins. Red curve is a Poisson curve with rate = median count rate of data. |
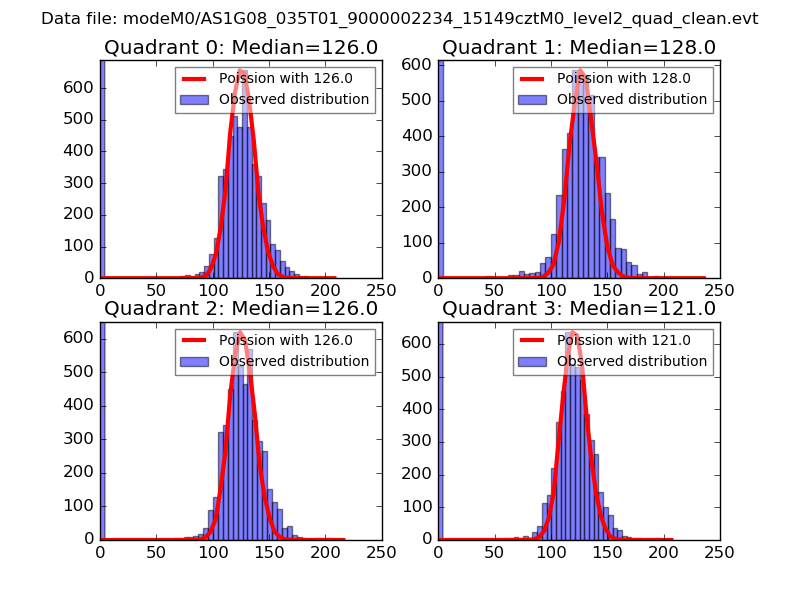 |
 |
| Quadrant-wise count rates Data is divided into 100 sec bins |
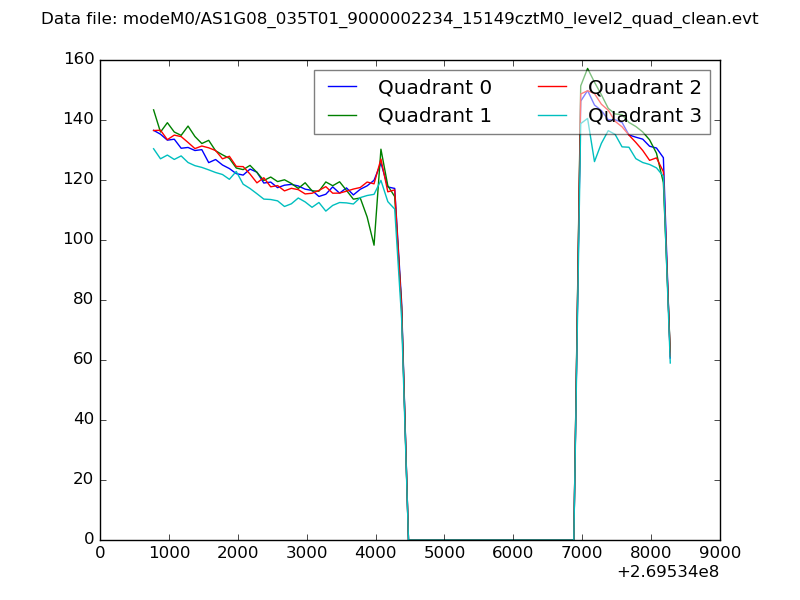 |
|
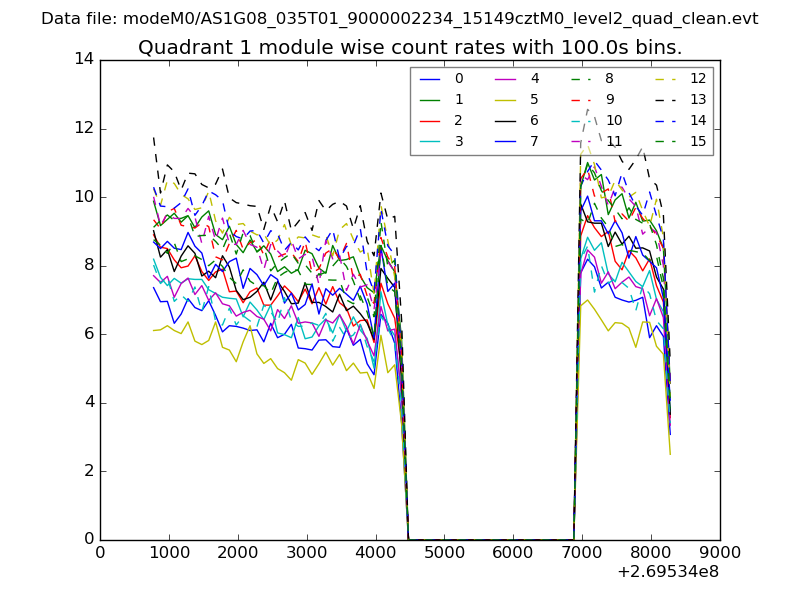
| Module-wise count rates for Quadrant A Data is divided into 100 sec bins |
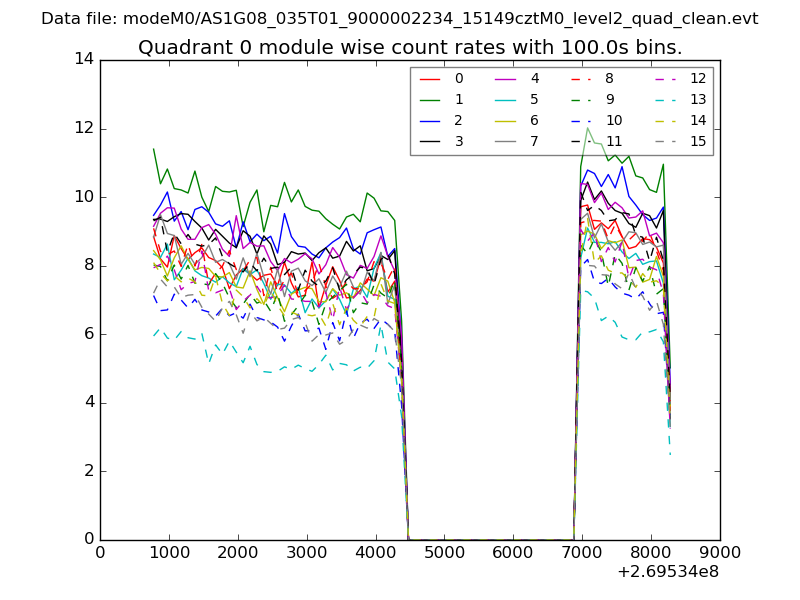 |
 |
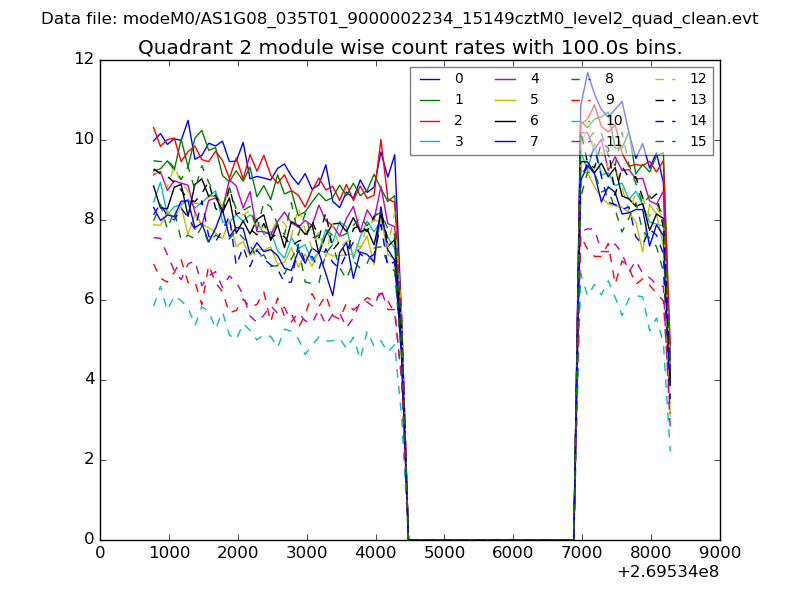
| Module-wise count rates for Quadrant B Data is divided into 100 sec bins |
 |
 |
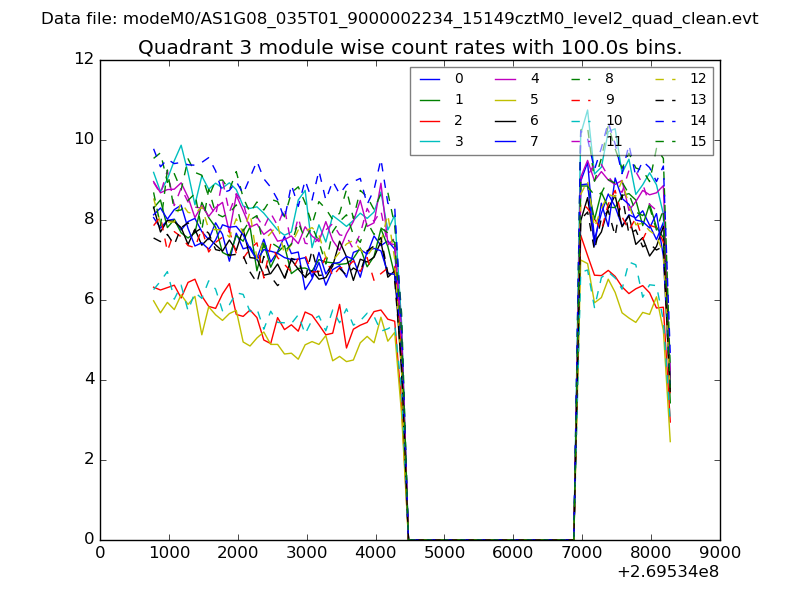
| Module-wise count rates for Quadrant C Data is divided into 100 sec bins |
 |
 |
| Module-wise count rates for Quadrant D Data is divided into 100 sec bins |
 |
 |
| Parameter | Plot |
|---|---|
| CZT HV Monitor | 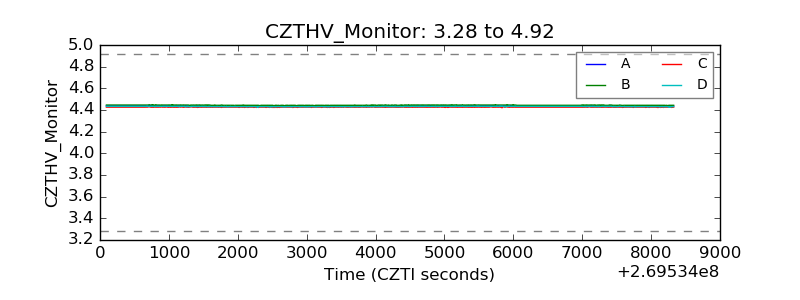 |
| D_VDD | 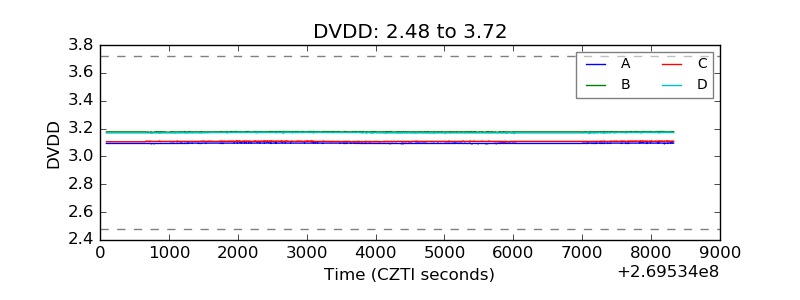 |
| Temperature 1 | 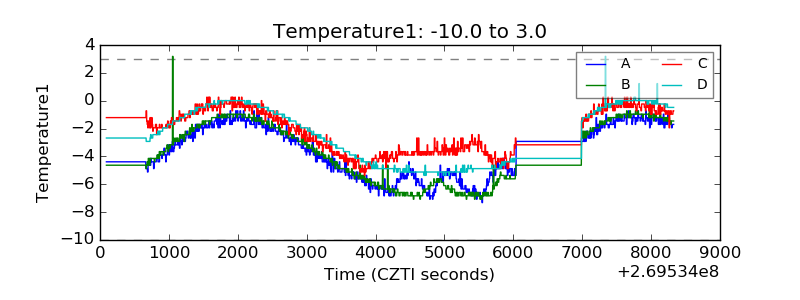 |
| Veto HV Monitor | 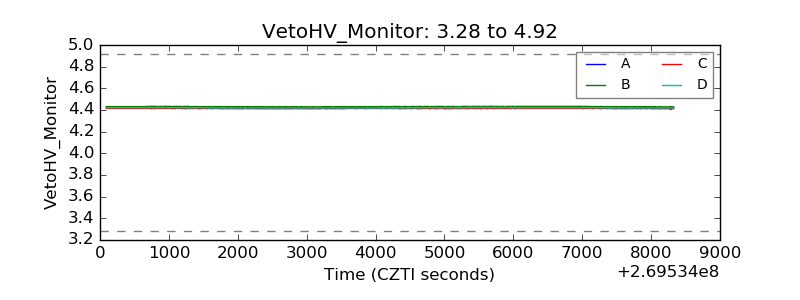 |
| Veto LLD | 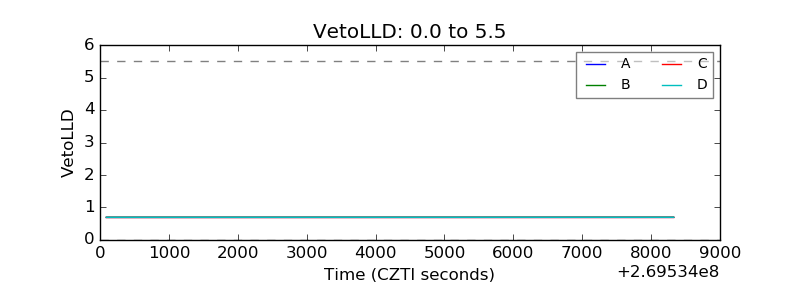 |
| Alpha Counter | 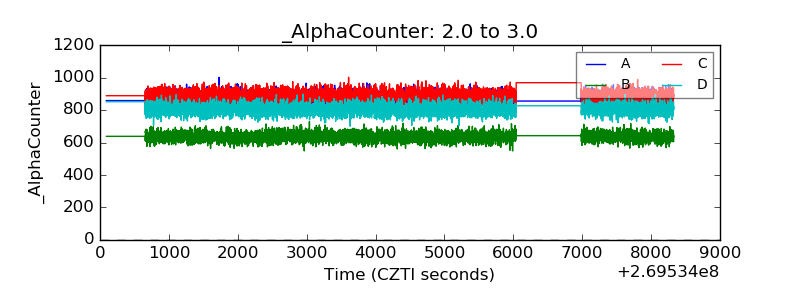 |
| _CPM_Rate | 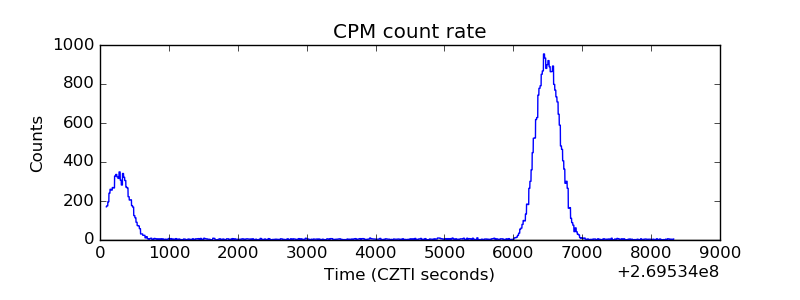 |
| CZT Counter | 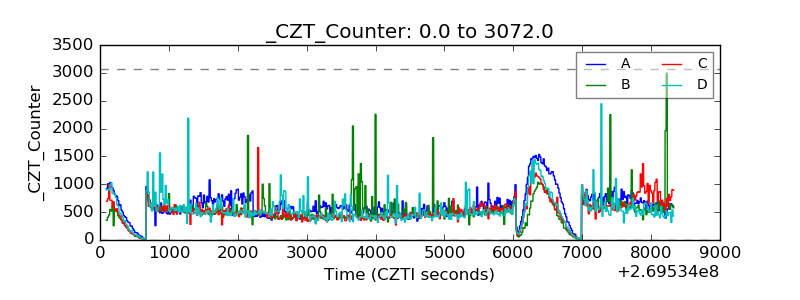 |
| +2.5 Volts monitor | 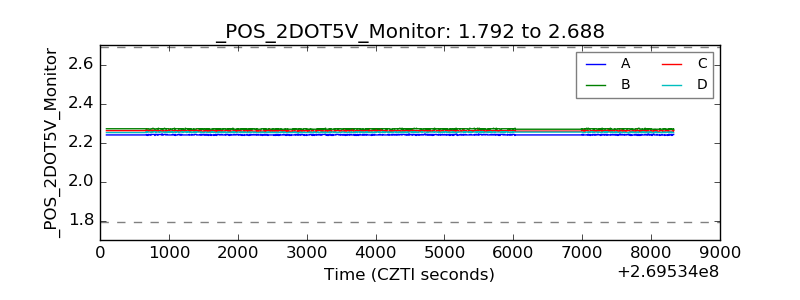 |
| +5 Volts monitor | 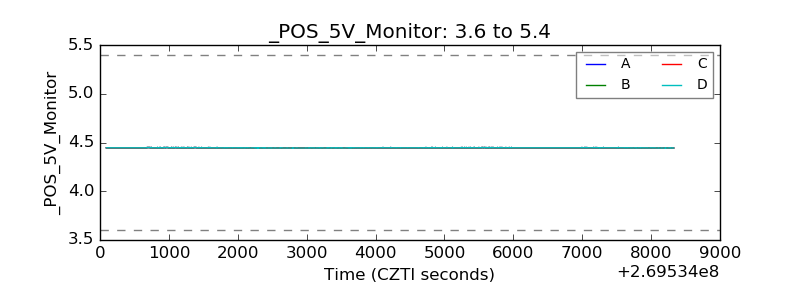 |
| _ROLL_ROT | 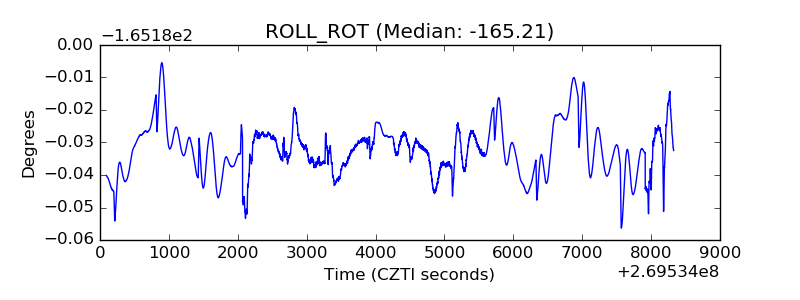 |
| _Roll_DEC | 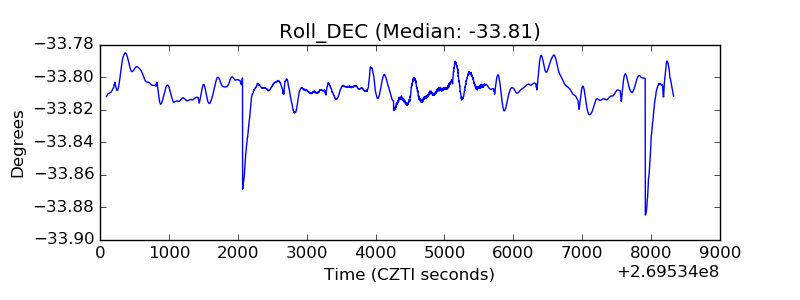 |
| _Roll_RA | 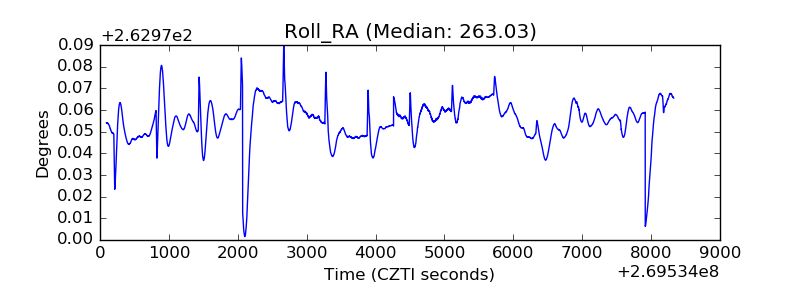 |
| Veto Counter | 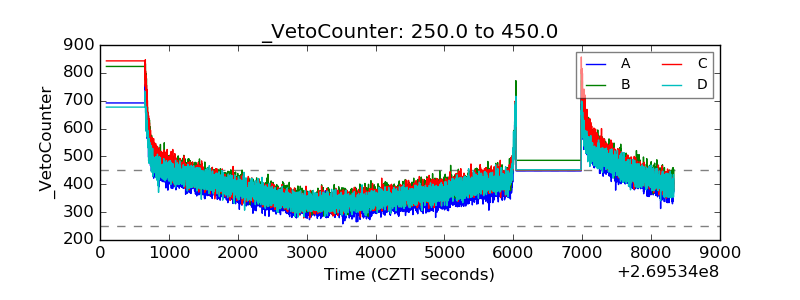 |