| Param | Original file | Final file |
|---|---|---|
| Filename | modeM0/AS1G08_035T01_9000002234_15152cztM0_level2.evt | modeM0/AS1G08_035T01_9000002234_15152cztM0_level2_quad_clean.evt |
| Size (bytes) | 54,838,080 | 13,711,680 |
| Size | 52.3 MB | 13.1 MB |
| Events in quadrant A | 376,063 | 93,267 |
| Events in quadrant B | 416,469 | 94,594 |
| Events in quadrant C | 463,031 | 91,017 |
| Events in quadrant D | 362,169 | 87,345 |
| Mode M0 | |||
|---|---|---|---|
| Quadrant | BADHDUFLAG | Total packets | Discarded packets |
| A | 0 | 1558 | 1 |
| B | 0 | 1685 | 1 |
| C | 0 | 1862 | 1 |
| D | 0 | 1439 | 1 |
| Mode SS | |||
|---|---|---|---|
| Quadrant | BADHDUFLAG | Total packets | Discarded packets |
| A | 0 | 12 | 0 |
| B | 0 | 12 | 0 |
| C | 0 | 12 | 0 |
| D | 0 | 12 | 0 |
| Mode M9 | |||
|---|---|---|---|
| Quadrant | BADHDUFLAG | Total packets | Discarded packets |
| A | 0 | 5 | 0 |
| B | 0 | 5 | 0 |
| C | 0 | 5 | 0 |
| D | 0 | 6 | 0 |
| Quadrant | Total seconds | Saturated seconds | Saturation percentage |
|---|---|---|---|
| A | 583 | 8 | 1.372213% |
| B | 583 | 14 | 2.401372% |
| C | 583 | 8 | 1.372213% |
| D | 583 | 7 | 1.200686% |
Noise dominated data is calculated using 1-second bins in cleaned event files. If a bin has >2000 counts, and if more than 50% of those come from <1% of pixels, then it is considered to be noise-dominated and hence unusable.
| Quadrant | # 1 sec bins | Bins with >0 counts | Bins with >2000 counts | High rate bins dominated by noise | Noise dominated (total time) | Noise dominated (detector-on time) | Marked lightcurve |
|---|---|---|---|---|---|---|---|
| A | 584 | 584 | 0 | 0 | 0.00% | 0.00% | 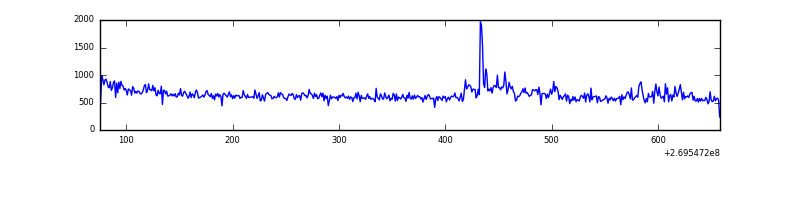 |
| B | 584 | 584 | 4 | 4 | 0.68% | 0.68% | 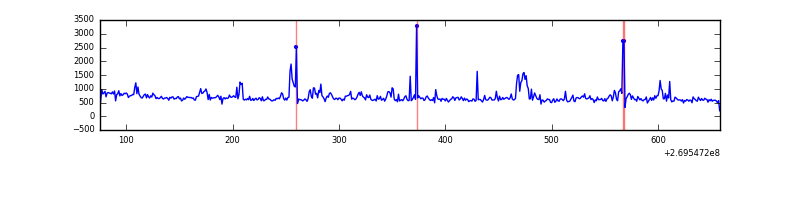 |
| C | 584 | 584 | 4 | 4 | 0.68% | 0.68% | 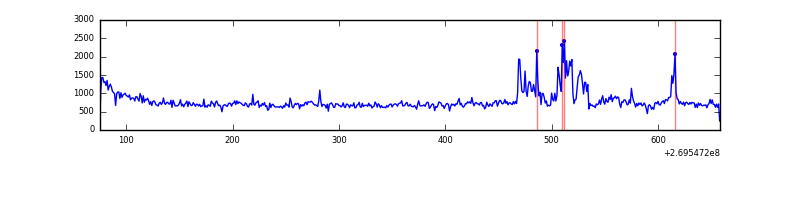 |
| D | 584 | 584 | 4 | 4 | 0.68% | 0.68% | 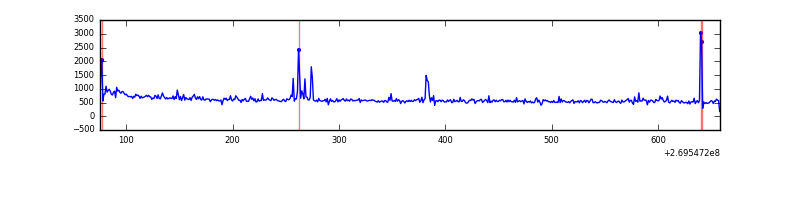 |
Top three noisy pixels from each quadrant. If the there are fewer than three noisy pixels in the level2.evt file, extra rows are filled as -1
| Pixel properties | Quadrant properties | ||||||
|---|---|---|---|---|---|---|---|
| Quadrant | DetID | PixID | Counts | Sigma | Mean | Median | Sigma |
| A | 15 | 239 | 12438 | 607.79 | 90 | 88 | 20.3 |
| A | 13 | 248 | 8620 | 419.89 | 90 | 88 | 20.3 |
| A | 12 | 189 | 4631 | 223.58 | 90 | 88 | 20.3 |
| B | 0 | 229 | 38566 | 2000.75 | 89 | 86 | 19.2 |
| B | 4 | 48 | 9596 | 494.47 | 89 | 86 | 19.2 |
| B | 0 | 189 | 8251 | 424.53 | 89 | 86 | 19.2 |
| C | 3 | 233 | 131791 | 6033.42 | 84 | 84 | 21.8 |
| C | 13 | 61 | 564 | 21.99 | 84 | 84 | 21.8 |
| C | 3 | 187 | 209 | 5.73 | 84 | 84 | 21.8 |
| D | 10 | 70 | 19628 | 853.41 | 86 | 84 | 22.9 |
| D | 12 | 222 | 3103 | 131.83 | 86 | 84 | 22.9 |
| D | 2 | 16 | 2942 | 124.8 | 86 | 84 | 22.9 |
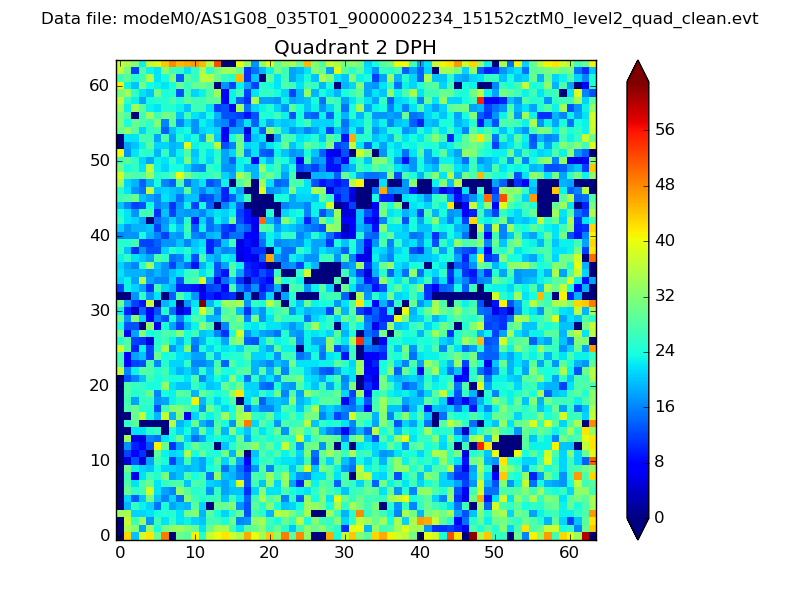
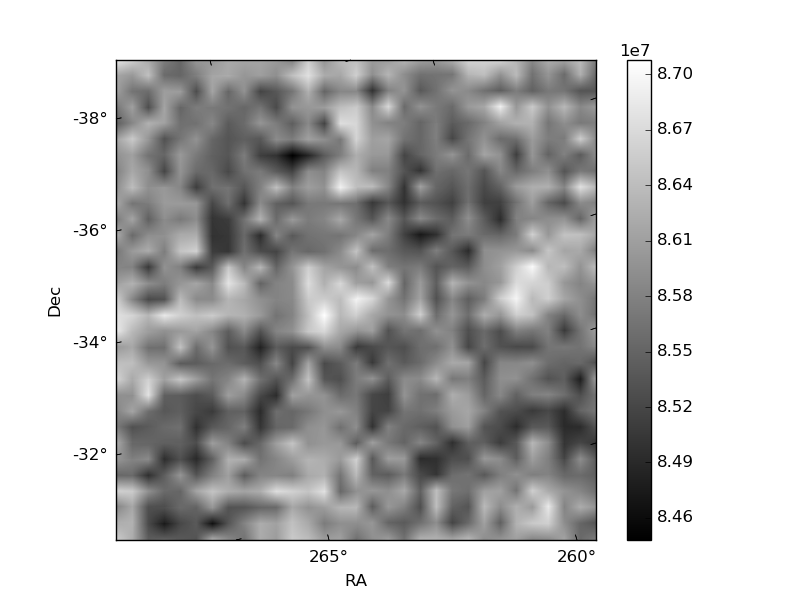
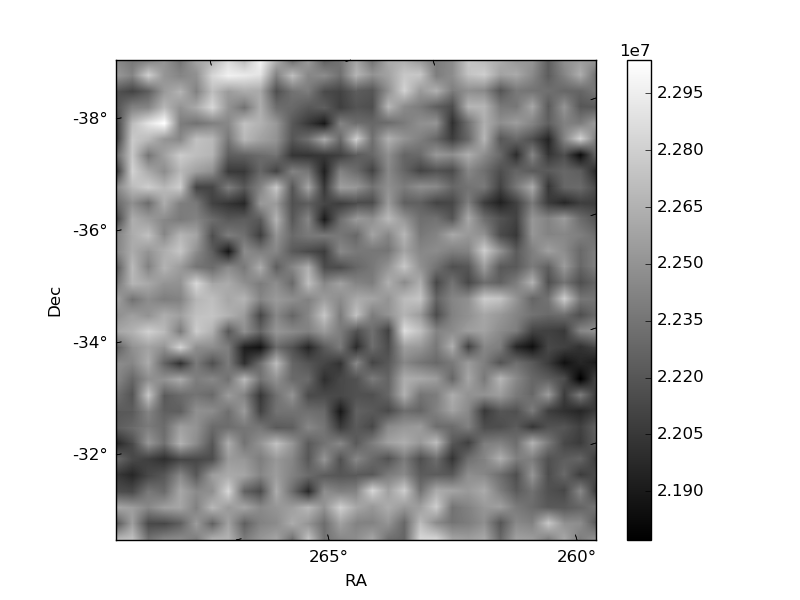
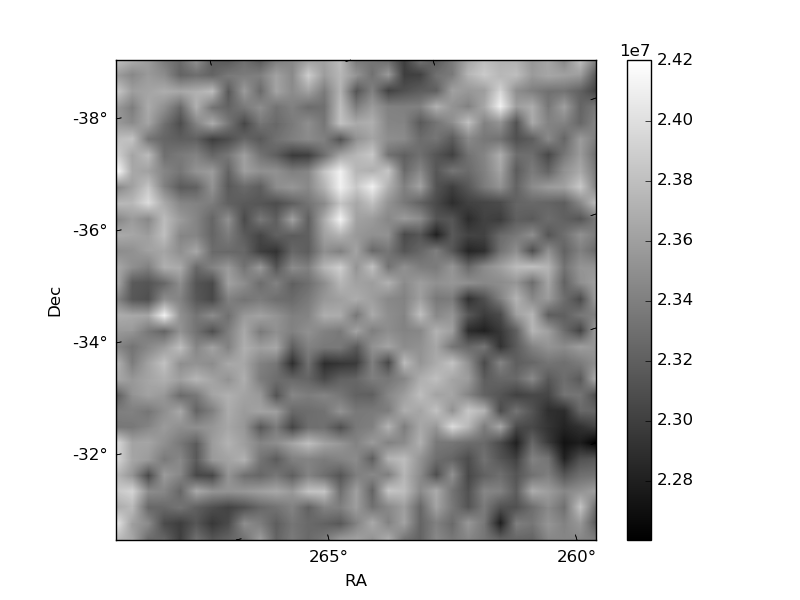
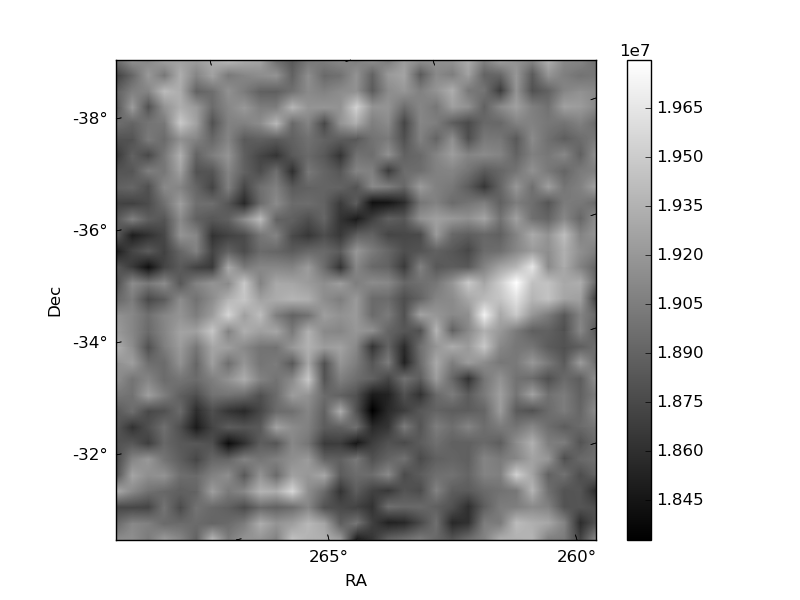
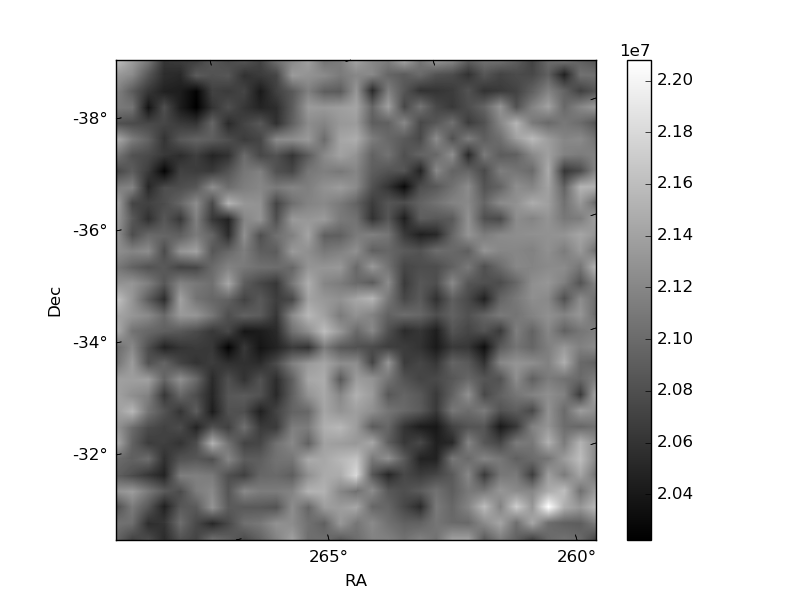
Histogram calculated using DETX and DETY for each event in the final _common_clean file
| Quadrant A | 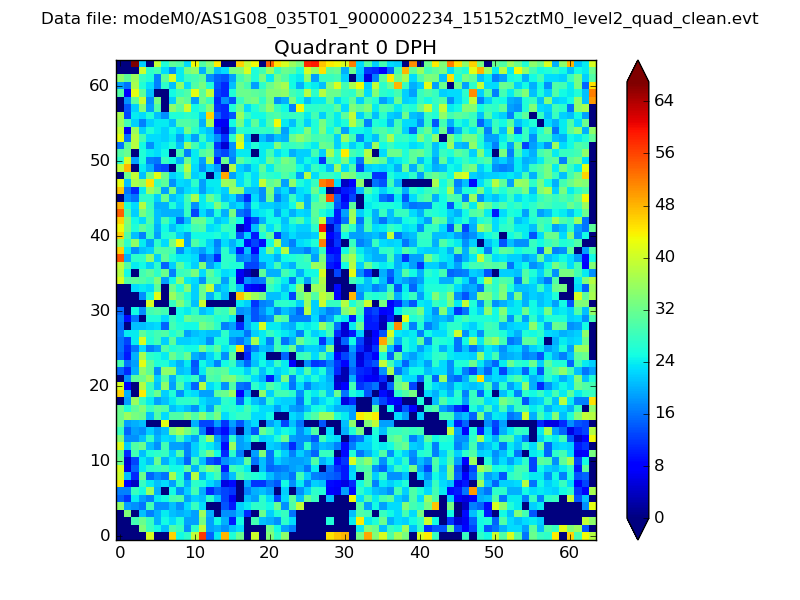 |
 |
Quadrant B |
|---|---|---|---|
| Quadrant D | 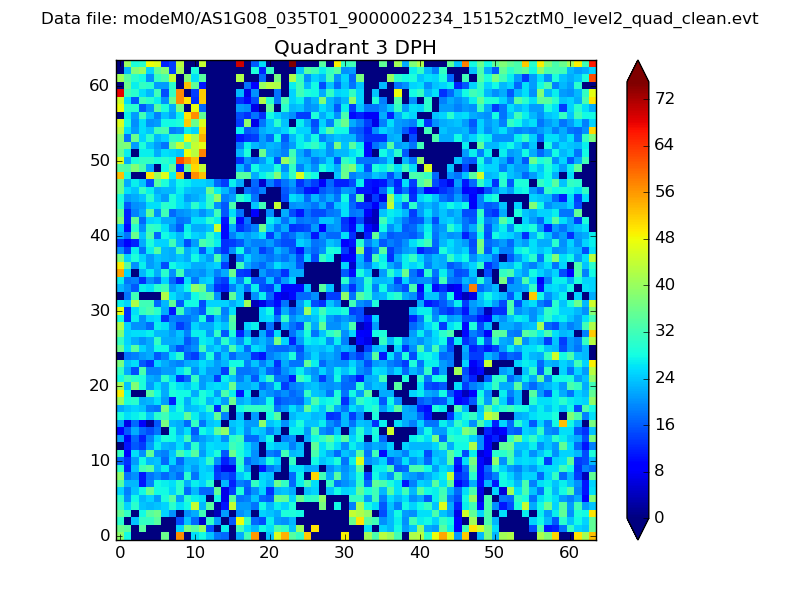 |
 |
Quadrant C |
| Plot type | Count rate plots | Images |
|---|---|---|
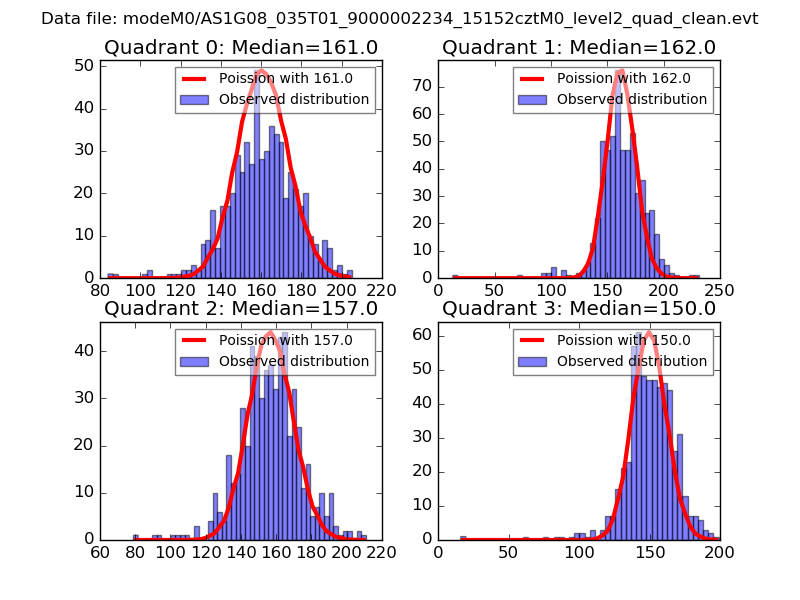
| Comparison with Poisson distribution Blue bars denote a histogram of data divided into 1 sec bins. Red curve is a Poisson curve with rate = median count rate of data. |
 |
 |
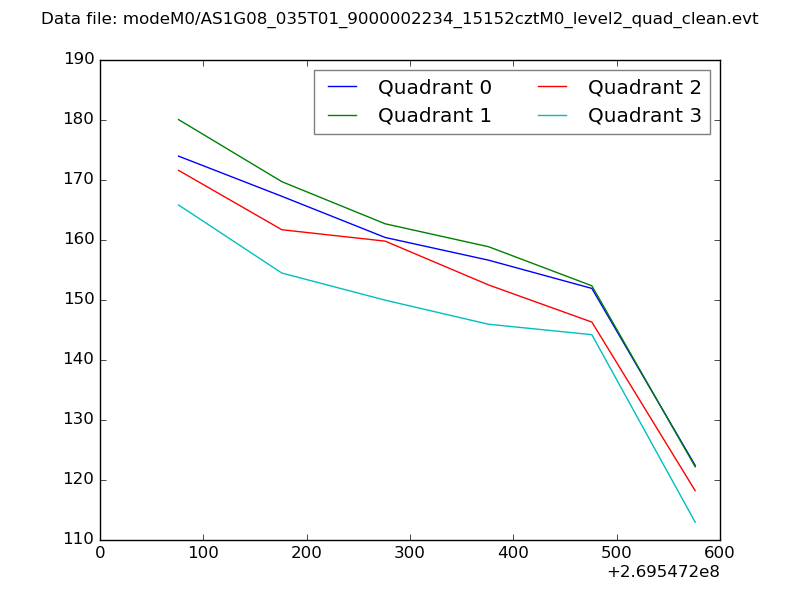
| Quadrant-wise count rates Data is divided into 100 sec bins |
 |
|
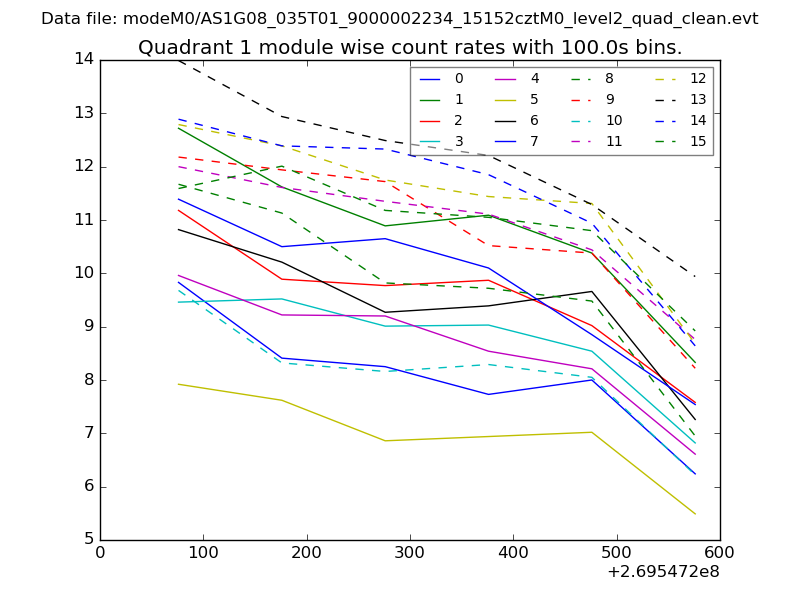
| Module-wise count rates for Quadrant A Data is divided into 100 sec bins |
 |
 |
| Module-wise count rates for Quadrant B Data is divided into 100 sec bins |
 |
 |
| Module-wise count rates for Quadrant C Data is divided into 100 sec bins |
 |
 |
| Module-wise count rates for Quadrant D Data is divided into 100 sec bins |
 |
 |
| Parameter | Plot |
|---|---|
| CZT HV Monitor | 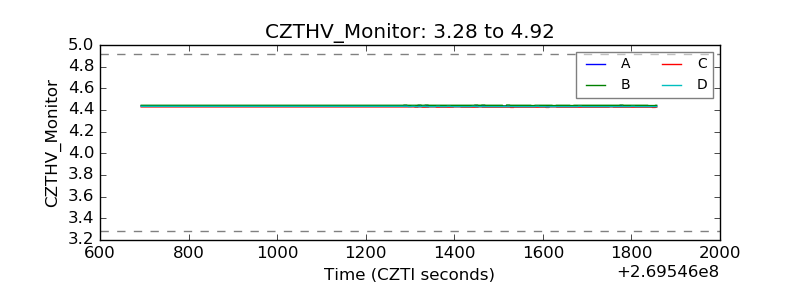 |
| D_VDD | 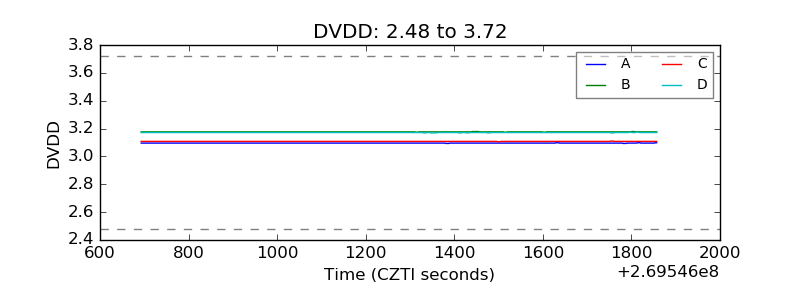 |
| Temperature 1 | 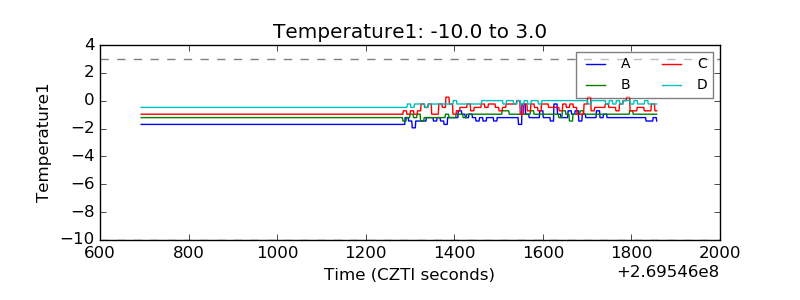 |
| Veto HV Monitor |  |
| Veto LLD | 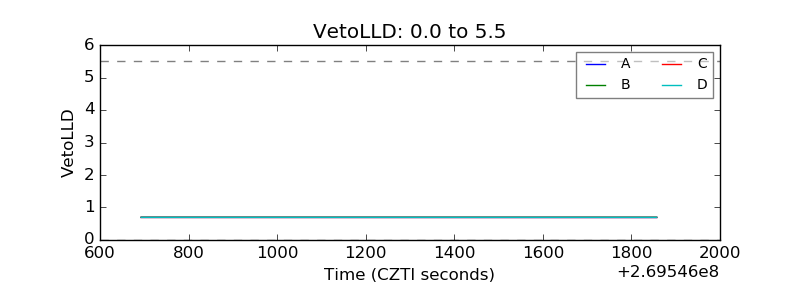 |
| Alpha Counter | 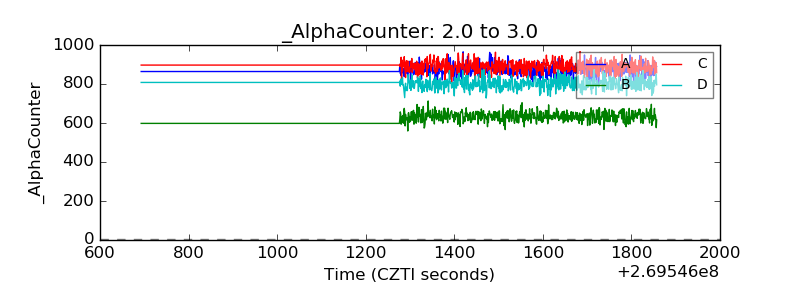 |
| _CPM_Rate | 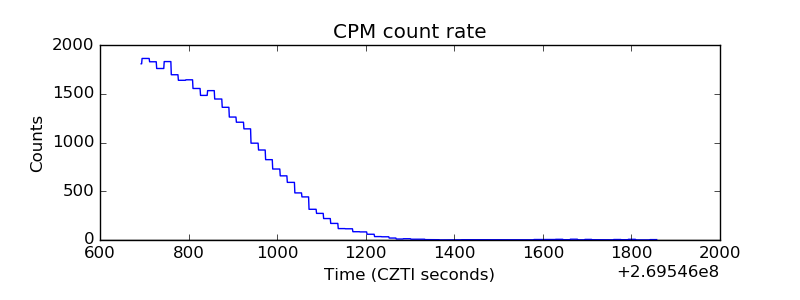 |
| CZT Counter | 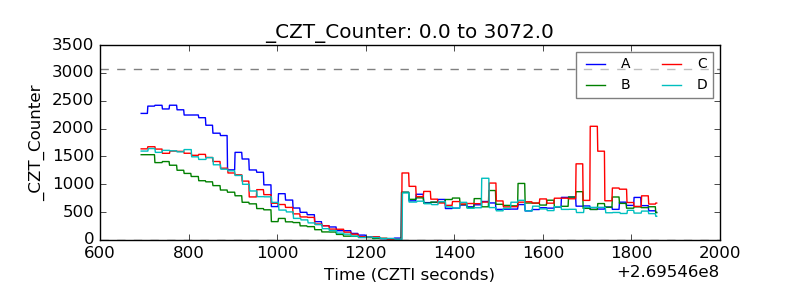 |
| +2.5 Volts monitor | 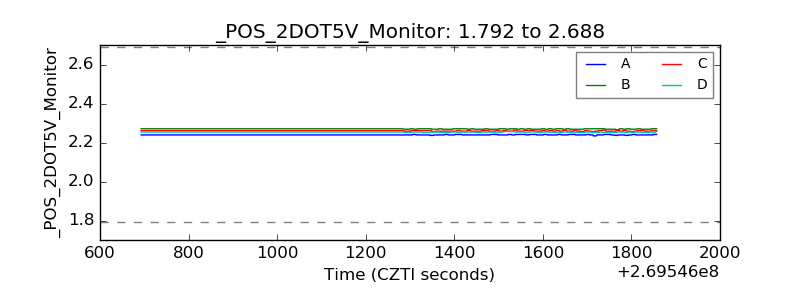 |
| +5 Volts monitor |  |
| _ROLL_ROT | 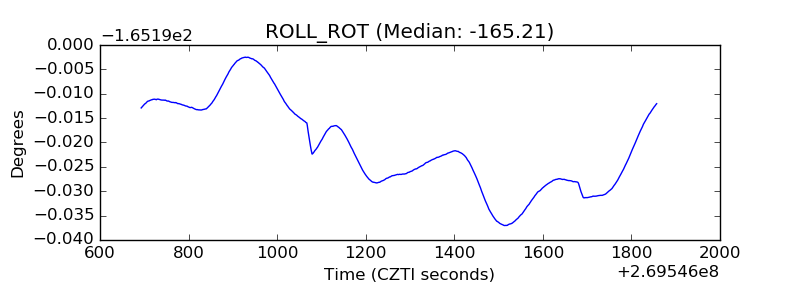 |
| _Roll_DEC |  |
| _Roll_RA | 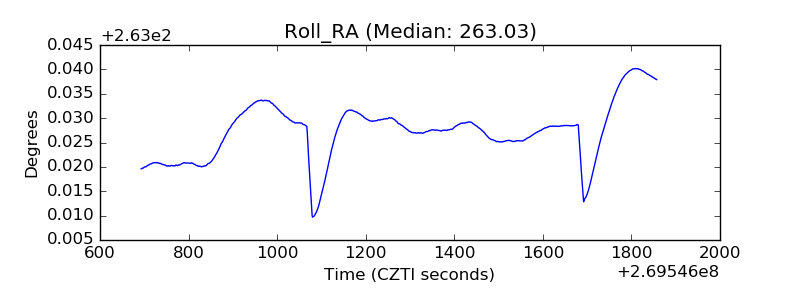 |
| Veto Counter | 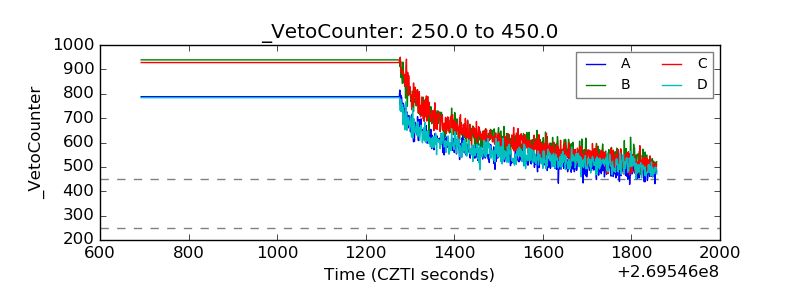 |